Any correspondence concerning this service should be sent
to the repository administrator:
[email protected]
This is an author’s version published in:
http://oatao.univ-toulouse.fr/22516
Official URL
DOI :
https://doi.org/10.1109/GLOCOM.2018.8647907
Open Archive Toulouse Archive Ouverte
OATAO is an open access repository that collects the work of Toulouse
researchers and makes it freely available over the web where possible
To cite this version:
Lucciardi, Jean-Alain and Mesnager, Gilles and
Thomas, Nathalie and Poulliat, Charly and Boucheret, Marie-Laure and
Buscarlet, Guillaume Piecewise Volterra Series Approximation for
Improved Non-Linear Channel Modelization and Detection. (2019) In:
IEEE Global Communications Conference (GLOBECOM 2018), 9
December 2018 - 13 December 2018 (Abu Dhabi, United Arab Emirates).
Piecewise Volterra Series Approximation for
Improved Non-Linear Channel Modelization and
Detection
Jean-Alain Lucciardi∗, Gilles Mesnager∗, Nathalie Thomas†, Charly Poulliat†, Marie-Laure Boucheret† and Guillaume Buscarlet∗
∗ Embedded Systems, IRT Saint-Exupery, Toulouse, France
Email: [email protected]
†University of Toulouse, INPT-ENSEEIHT/IRIT, Toulouse, France
Email: [email protected]
Abstract—In satellite communications, the non-linear distor-tions introduced by the amplifier in the payload have to be overcome. When advanced mitigation techniques are considered at the receiver side, the current channel model is often based on Volterra series derived from an approximation of the non linear transfer function of the on-board amplifier. This nonlinear model is conditioning the performance at the receiver side. In this paper, a new non-linear model is proposed, leading to improved receiver performances. The polynomial approximation is improved considering both the usual model truncation to the 3rd
order and the signal fluctuation at the input of the amplifier. First, the impact of the polynomial order of the AM/AM and AM/PM curve approximation is studied. Then, a non-linear model is derived based on a piecewise polynomial approximation of the amplifier response. Based on this refined nonlinear model, significant detection performance improvements are shown for both Nyquist and Faster-than-Nyquist rates.
I. INTRODUCTION
The new standard DVB-S2X [1] offers an improved achiev-able spectral efficiency of around 15% in satellite transmis-sions. Two major innovations lead to this capacity increase: the roll-off factor reduction (0.1, 0.05) and the use of higher Am-plitude and Phase Shift Keying (APSK) modulation orders (64-APSK, 128-APSK and 256-APSK). However, the lower roll-off and the higher modulation order reduce the transmission robustness against non-linear. The current strategy consists of linearized amplifiers paired with Least-Mean-Square (LMS) equalizers [2]. As a consequence, the achievable transmission performance does not achieve the full potential of the standard. The non-linear channel modelization with Volterra series was first proposed by Benedetto et al. in [3]. This mod-elization leads to the well-known Volterra model based on kernels used for advanced detection techniques. The upper-bound performance of those mitigation techniques is given by Maximum-A-Posteriori (MAP) detection schemes based on BCJR algorithms [13]. The MAP detector can be based on a Forney type [14] or a Ungerboeck type [15] receivers (including their numerous reduced states/complexity versions). For complexity reduction, different other receiver structures can be implemented such as Colavolpe’s factor graph (FG)
based detector [4] or an iterative Minimum Mean-Square Error (MMSE) derived for non-linear channels [5].
The given previous mitigation techniques are currently based on a truncated Volterra model of 3rd or 5th order. However, the impact of the polynomial approximation has not be widely discussed in previous studies whereas its impact will be shown significant for detection. Whatever the detection scheme is among MAP, FG or MMSE, the Volterra model can be improved by only approaching a part of the response of the amplifier instead of the whole response.
When implementing advanced receivers in non-linear chan-nel, Faster-than-Nyquist (FTN) can be considered without complexity increase in the transmission chain. First inves-tigated by Mazo [6], FTN signaling leads to an increased capacity in both linear channel [7]-[8] and non-linear channel [9]. The inherent Inter-Symbol Interference (ISI) in FTN transmission distorted by non-linear amplification requires however an accurate Volterra modelization. The channel model improvement proposed in this paper is indeed more significant when the Nyquist criterion is not met.
The paper is organized as follows. Section II briefly depicts the current satellite transmission channel. Both Nyquist and FTN signaling are considered and the related Volterra model for satellite non-linear channel is given. In section III, we investigate on the impact of the truncation of the Volterra kernels order considering different polynomial orders. Then, a piecewise amplifier response approximation is investigated in order to improve the non-linear channel modelization. Finally, the impact on the performances of different advanced detection methods is presented in section IV. A brief conclusion is given in section V.
II. SATELLITE TRANSMISSION CHANNEL
In this section, the satellite transmission chain is detailed, from the transmitter to the receiver side, including the satellite payload (see Figure 1).
Fig. 1: Satellite transmission chain
A. Transmitter side
At the transmitter side, uncoded data bits uk are encoded with regard to the DVB-S2X standardized coding rates using a Low-Density-Parity-Check (LDPC) encoder, leading to coded bitsck. After interleaving, those bits are mapped onto complex symbols ak belonging to one of the constellation specified by the DVB-S2X standard [1]. The complex symbols are sent to a Square-Root Raised Cosine (SRRC) filterh(t) with roll-off factor α. The occupied bandwidth B by the transmission is B = (1 + α)Rs where Rs = 1/Ts is the symbol rate andTs the symbol period. In the following, we consider an occupied bandwidth B = 40MHz and a roll-off factor α = 0.1 leading to a Nyquist symbol rateRs= 36MBauds.
Since both Nyquist and FTN signaling are considered, we define the compression factor τ ∈]0, 1]. At the transmission side, the Nyquist criterion is met forτ = 1, ensuring no Inter-Symbol Interference (ISI). Finally, the transmitted signalxe(t) is given by:
xe(t) =X k
akh(t − kτ T ) (1) where T = 1
τ Rs is the period of the SRRC filter (inverse of the usual Nyquist rate). Finally, this signal reaches the satellite segment.
B. The satellite payload and the Volterra model
The block ”SATELLITE CHANNEL” in Figure 1 is detailed in this subsection (see Figure 2).
Fig. 2: Satellite payload
In this paper, a transparent satellite is considered. The payload consists of an Input MUltipleXer (IMUX) filterhI(t), a High Power Amplifier (HPA) and an Output MUltipleXer (OMUX) filterhO(t). The received signal xe(t) is first splitted in different sub-bands by the IMUX filter. Then, the different sub-bands are amplified by the HPA. This amplifier can be linearized or non-linearized. In order to fully benefit from a Volterra model, we consider a non-linearized amplifier (see Figure 4). Finally, the sub-bands are re-combined by the OMUX filter and sent to the downlink.
In [3], the amplifier response in modulus and phase is ap-proached with a polynomial decomposition in Volterra series. Considering the properties of the signal in the payload, only odd terms are kept since the even harmonics are rejected by the filters. Then, the signal at the output of the HPA denoted byxO(t) can be written as a polynomial function of the input signalxI(t): xO(t) = k=N−1 2 X k=0 γ2k+1xI(t)2k+1 (2) where N denotes the polynomial order of the decompo-sition, xI(t) is the signal at the output of the IMUX filter: xI(t) = xe∗ hI(t). The complex polynomial coefficients γ2k+1 model both the modulus and the phase distortions due to the amplifier. In classical Volterra model with no truncation, N = +∞. The signal at the output of the HPA is filtered by the OMUX filter, resulting iny(t) = xO∗ hO(t) which is sent on the downlink.
C. Receiver side
On the downlink, an additive white Gaussian noise n(t) with a power spectral densityσn= 2N0is added to the signal y(t). At the receiver side, a Partial Matched Filter (PMF) is implemented, only matching the shaping filter h(t) without consideration for the satellite channel, hr(t) = h∗
(−t). The resulting received signalr(t) after filtering is given by:
r(t) = y ∗ hr(t) + n ∗ hr(t) (3) This signal is sampled at the symbol rate τ Rs, leading to the well-known Volterra model truncated to the3rdorder (see [5]): rk=X l ak−lKl(1)+ X m,n,p ak−mak−na∗ k−pKm,n,p+nk,τ(3) (4) where Kl(1) and K (3)
m,n,p respectively denote the 1st and 3rd order Volterra kernels deduced from the polynomial approxi-mation. Whenτ 6= 1, the resulting filtered and sampled noise nk,τ = n ∗ hr(kτ Ts) is correlated.
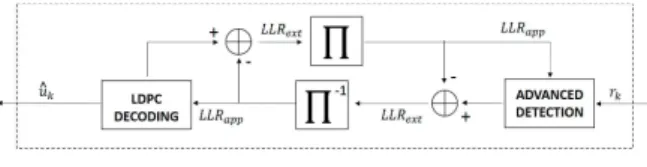
Finally, in order to recover the data, an iterative detection is implemented. The turbo-equalization scheme is given in Figure 3.
Fig. 3: Turbo-detection scheme
Following the turbo principle, all Log-Likelihood Ratios (LLR) exchanged during the iterative process are extrinsic quantities. The considered ”ADVANCED DETECTION” is based on the model in (4) and can be based on MAP, MMSE or FG detection. The different parameters of the detection
schemes are discussed in section IV when observing the detection behaviour.
III. POLYNOMIAL APPROXIMATION IMPROVEMENT
A. Polynomial approximation
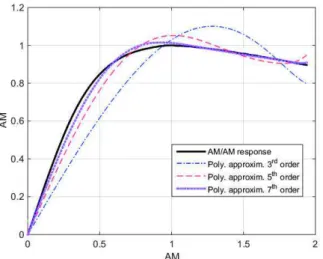
In (2) we defined the polynomial approximation order N . In this section we address the issue of the value of N to be selected considering a Volterra based model truncated to the3rdorder. We focus on the normalized AM/AM curve of the conventional HPA. First, we compute an approximation of the AM/AM response for different polynomial orders, N = 3, N = 5 and N = 7. The resulting coefficients are [γ1(3), γ (3) 3 ] for N = 3, [γ (5) 1 , γ (5) 3 , γ (5) 5 ] for N = 5 and finally [γ1(7), γ (7) 3 , γ (7) 5 , γ (7)
7 ] for N = 7. The polynomial approximation with no truncation are given in Figure 4.
Fig. 4: AM/AM curve and associated approximations for different polynomial orders and no truncation
As expected, increasing the polynomial order improves the approximation.
Since the Volterra model is truncated to the 3rd order, the polynomial order relevance should be studied with a truncated polynomial of order 3. We consider a polynomial approximation of degreeν truncated to degree 3.
xO(t) = γ1(ν)xI(t)1+ γ (ν)
3 xI(t)3 (5) We give the AM/AM curve approximation considering the truncation to the 3rd order forν = 3, ν = 5 and ν = 7 (see Figure 5).
The behaviour of the approximation can be analyzed as follows:
• When considering the linear part of the AM/AM re-sponse, the higher order polynomial approximation is still the most relevant even with the truncation. This phenomenon is due to the preponderance of the low orders when the amplitude is low.
Fig. 5: AM/AM curve and associated approximations for different polynomial orders and truncation to the3rd
order
• When approaching the saturation point, the predominance of the lower orders is no longer true and the higher poly-nomial approximation orders diverge from the AM/AM curve. When operating the amplifier in the saturation regime, the 3rdorder polynomial approximation is more relevant since no truncation is mandatory in order to compute a3rd order Volterra model.
The observations in this section lead to the conclusion that both a high order truncated polynomial (ν = 7) and a low order polynomial (ν = 3) are not satisfying in order to model correctly the non-linear distortions introduced by the amplifier. In the following section we propose a new method improving the channel model relevance by computing polynomials on sub-ranges of the amplifier transfer function instead of the whole range, leading to a piecewise polynomial approximation.
B. Partial approximation
When the approximation is based on a3rdorder polynomial, fitting the whole AM/AM curve leads to poor performance (see Figure 5). The HPA operating point corresponds to the signal mean power. Because of the complex envelop fluctuations, instantaneous signal power lies on both sides of the targeted operation point.
First, we investigate the statistical properties of the signal at the amplifier input. Let us consider the following parameters: a roll-off factor α = 0.1 for the shaping filter h(t) and an up-sampling factor of 10 for the computer simulations. The considered modulations are [8PSK, τ = 1.0], [8PSK, τ = 0.75] and [16APSK, τ = 1.0].
In Figure 6, we plot the histogram of the amplitude of the signals xI(t) (320000 samples) generated with the different modulations and compression factors.
We observe that the statistical distribution of [8PSK, τ = 1.0] is close to a Gaussian distribution. The 90th percentile is1.20, we can then consider that 90% of our signal will be
Fig. 6: Histogram of the signal amplitude|xI(t)|
amplified between AM = 0 and AM = 1.2 × AMin, where AMin is the amplifier operating point. The distributions of [8PSK, τ = 0.75] and [16APSK, τ = 1.0] are different. Their 90th percentile are respectively 1.35 and 1.50. The whole AM/AM curve approximation is then not required. By identifying the signal amplitude histograms, we can focus on a partial approximation of the amplifier response.
Let us consider a polynomial approximation of orderν = 3 of a sub-range of the AM/AM response of the amplifier. For this example, we focus on the Gaussian fitting of the signal [8PSK, τ = 1.0]. We consider two different zones in order to illustrate our method. First, a zone called ”zone 2” centered on AMin = 0.60, bounded between AMmin = 0.40 and AMmax = 0.80. A second zone called ”zone 1” centered on AMin = 1.00, bounded between AMmin = 0.80 and AMmax = 1.20. The two different zones address an ampli-fication in both the linear part (”zone 2”) and the saturation part (”zone 1”).
In Table I, we give the polynomial coefficients associated to the approximation of the whole curve and to the two partial approximations.
TABLE I:3rd
order polynomial coefficients for AM/AM response approximation on partial zones.
Poly. app. zone Poly. coeff. Whole AM/AM response γ1(3)= 1.09 + 0.712j AMmin= 0to AMmax= 1.94 γ(3)3 = 0.279 + 0.0808j
Zone 2 γ1(z2)= 1.96 + 0.543j AMmin= 0.40 to AMmax= 0.80 γ3(z2)=−1.579 + 0.299j
Zone 1 γ1(z1)= 1.29 + 0.789j AMmin= 0.80 to AMmax= 1.20 γ3(z1)=−0.532 − 0.123j
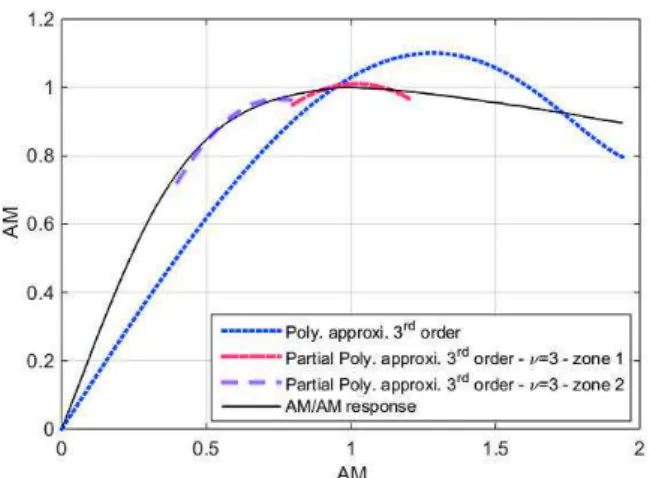
The resulting polynomial approximations in the different zones are given in Figure 7.
Approximation based on a piecewise polynomial approx-imation is far more efficient than the usual approxapprox-imation. However, observing the different signal histograms in Figure 6 leads to the conclusion that the whole signal is not amplified in a limited part of the AM/AM curve. We now plot the
Fig. 7: AM/AM curve and associated3rd
order polynomial approx-imations on partial operational ranges
polynomial approximations with the coefficients sets from Table I on the whole amplifier operational range in Figure 8.
Fig. 8: AM/AM curve and associated3rd
order polynomial approx-imations on the whole operational range
• The usual polynomial approximation with coefficients [γ(3)1 , γ
(3)
3 ] does not diverge substantially from the AM/AM response on the whole operational range of the amplifier. As a balance, this approximation does not fit with precision the real model, which should lead to decreased performance of the detection in the following section.
• The polynomial approximation of the linear part of the operational range (”zone 2”) results in the coefficients [γ(z2)1 , γ
(z2)
3 ]. Figure 8 shows-off that in the linear regime of the amplifier, this partial model is far more efficient than the usual one. The drawback is that the signal properties have to be accurately defined in order not to operate the amplifier outside the relevant part of
the approximation. We can indeed observe that strong divergence occur when we move away from the operating pointAin = 0.60.
• Finally, the polynomial approximation of the non-linear part of the operational range (”zone 1”) results in the coefficients[γ1(z1), γ
(z1)
3 ]. This partial model offers an im-proved AM/AM approximation in the saturation regime compared to both the usual and ”zone 2” approximated models. Moreover, this model is better than the usual one in the linear part of the operational range of the amplifier. In the same manner as for ”zone 2”, the drawback is that operating the amplifier with an increased Ain leads to a divergent model. By contrast with ”zone 2”, it is less likely that the operation point selected by the satellite operator is higher thanAin= 1.0.
In this section, we have proposed improved polynomial approximations of the AM/AM response of the amplifier in order to increase the Volterra model accuracy. In the following section, we investigate the impact of such an improvement on the Volterra kernels behaviour and the detection performance.
IV. IMPACT ON THEVOLTERRA MODEL AND THE DETECTION PERFORMANCE
First, we address the channel modelization issue by observ-ing the Volterra kernels behaviour when both usual and partial approximations are considered. Then, the potential resulting detection improvement is investigated through both the MAP and the MMSE detection based on the Volterra model. A. Kernels behaviour
We consider the different 3rd order polynomial approxi-mations given in Table I. As explained in [4], the kernels resulting from coefficients [γ1, γ3] are computed as follows for a sampling instantt0:
Kl(1)= γ1HI∗ HO(t0− lTs) (6) and Km,n,p(3) = 3 4γ3 Z +∞ −∞ HO(τ )HI(t0− mTs− τ ) HI(t0− nTs− τ )H∗ I(t0− pTs− τ )dτ (7)
where HI(t) = h ∗ hI(t) and HO(t) = hO∗ hr(t).
Relations (6) and (7) highlight the impact of the polynomial coefficients on the Volterra based model. The kernels distribu-tion is the same for both the usual and the improved model, only the kernels magnitudes differ.
TABLE II: MSE
IBO (dB) Transmission config. MSE (usual) MSE (improved) 0dB [8PSK, τ = 1.0] 0.033 0.0046 0dB [8PSK, τ = 0.75] 0.034 0.0094 0dB [16APSK, τ = 1.0] 0.037 0.014 2dB [8PSK, τ = 1.0] 0.019 0.0029 2dB [8PSK, τ = 0.75] 0.027 0.0060 2dB [16APSK, τ = 1.0] 0.028 0.0086
In order to characterize the interest of the proposed im-proved model, we first compute a Mean-Square Error (MSE) between the transmitted signal in the transmission chain (see Figure 1) and its discrete domain equivalent obtained by convolution (see (4)) based on both the usual and the improved model. This model relevance is addressed for different back-offs for both the Nyquist and FTN signaling. We consider shaping and matched filters with α = 0.1. The considered memory for a 8-PSK (respectively a 16APSK) is L = 5 (respectively L = 4) for the discrete models in order to have a trellis with85−1states (respectively164−1states).
The following observations have to be highlighted observing Table II:
• The Mean-Square Error (MSE) resulting from the pro-posed partial approximation is lower than the MSE fol-lowing the usual approximation. Whatever the modula-tion and the compression factor, the non-linear channel modelization is improved by a factor2 to a factor 10. • For a similar uncoded achievable spectral efficiency
(4bit.s−1/Hz), the 8PSK FTN signaling with a com-pression factorτ = 0.75 offers an improved transmission modelization compared to the 16APSK transmission at the Nyquist rate. We confirm the interest of compressed lower modulation orders with comparison to higher mod-ulation orders at the Nyquist rate [10] in a non-linear channel.
Considering the channel truncation issue due to the mod-ulation order and the number of states in the trellis, FTN signaling indeed can improve the current satellite capacity. In the following, we investigate the impact of the proposed improved Volterra model on the detection behaviour.
B. Detection improvement
1) EXIT charts for performance measurement: In this pa-per, the asymptotic performance for the different advanced detection schemes is based on EXIT charts computations [11]. By using the area theorem (area under the obtained EXIT curve), the achievable coding rate of the transmission is evaluated for targeted Signal-to-Noise Ratio (SNR) and Input Back-Off (IBO). Even if the area theorem is only proved for the binary erasure channel, it provides good approximation for other types of channels. Finally, the achievable spectral efficiency can be deduced from those EXIT charts, as a function of the SNR [12]. This method is suited to both the MAP and the MMSE detections investigated in the following of this section. The validity of this method will be supported by Bit Error Rate (BER) computations.
2) MAP detection: The advanced receiver optimization is not addressed in this paper, we only investigate the detection improvement resulting from the proposed partial polynomial approximation. By this way, we consider a BCJR [13] type Maximum-A-Posteriori (MAP) detection based on a trellis. The trellis branch metric from states to state s′
denoted by φ(s, s′
) is Forney type [14], based on the Volterra modelization of the non-linear channel:
φ(s, s′ ) ∝ |rk− (X l ak−lKl(1) + X m,n,p ak−mak−na∗ k−pKm,n,p(3) )|2+ 2N0lnP (ak) (8)
with l ∈ [−1, +3] and (m, n, p) ∈ [−1, +3]3. It results in a model with 5 kernels of 1st order and 53 = 125 kernels of3rdorder. Thanks to the EXIT method described in the previous subsection, we compute the achievable spectral efficiency (ASE) of both [8PSK, τ = 1.0] configuration and [8PSK, τ = 0.75] configuration. As a reminder, the truncated channel length for 8PSK modulation is L = 5, resulting in a trellis with 84 states. In Figure 9, we give the ASE of the two configurations with both the usual and the improved polynomial approximation with zero back-off (IBO=0dB).
Fig. 9: ASE of MAP detection for [8PSK, τ = 1.0] and [8PSK, τ = 0.75] with both the usual and the improved polynomial approximation - IBO=0dB
The MAP detection is improved for both Nyquist and FTN signaling when using the partial polynomial approximation for Volterra modelization of the non-linear channel. However, this modelization improvement leads to different gains when considering a Nyquist or FTN transmission. On one hand, for a targeted ASE in SNR range [3dB − 10dB], the Nyquist MAP detection threshold is improved by about 1dB. In the same SNR range, the FTN (τ = 0.75) MAP detection threshold is 3dB better when operating the amplifier at the saturation point (IBO=0dB). When considering higher SNR values (above 10dB), the relevance of the non-linear channel modelization with the proposed partial approximation results in a gain over 4dB.
When observing the blue curves on Figure 9 (usual models), FTN signaling for low SNR values based on the usual poly-nomial approximation is not relevant. The compression factor indeed increases both the achievable rate and the introduced ISI, leading to null gain. By contrast, with the improved
modelization, in the SNR range [3dB − 8dB], FTN signaling results in a capacity increase of15% to 20%.
Finally, for higher SNR values, FTN signaling with im-proved model leads to an ASE increase of 30%, which is a significant improvement for satellite communications.
3) MMSE detection: The MMSE algorithm proposed for non-linear channel in [5] is investigated in order to propose a low-complexity receiver. The same Nyquist and FTN config-urations as for MAP detection analysis are used, i.e. [8PSK, τ = 1.0] and [8PSK, τ = 0.75]. In this MMSE detection, we took into account5 non-causal and 15 causal 1storder kernels Kl(1),l ∈ [−5, +15]. In order to keep a feasible detector, we can not take into account the resulting213kernels of3rdorder. We only keep the 3rd order kernels satisfying the condition |Km,n,p| > 0.001 × |K(3) 0(1)|. The resulting ASE are given in Figure 10.
Fig. 10: ASE of MMSE detection for [8PSK, τ = 1.0] and [8PSK, τ= 0.75] with both the usual and the improved polynomial approximation - IBO=0dB
As for MAP detection, the proposed improved approxi-mation leads to a detection performance improvement. The detection behaviour is however different. First, by comparison with Figure 9, we observe that for the higher SNR values, the ASE resulting from MMSE detection is below the ASE offered by the MAP detection. Moreover, when the proposed improved approximation is not implemented, we observe that the achievable capacity falls down for higher SNR values. It is indeed due to the fact that the ISI introduction becomes predominant on the noise added. Then, the model precision becomes critical, explaining the different behaviour of the de-tection with and without improved approximation. Finally, the MMSE detection with the partial polynomial approximation is relevant for low SNR values, offering an interesting trade-off between non-linear distortions mitigation and reduced complexity.
V. CONCLUSION
In this paper, we proposed a polynomial approximation improvement for the non-linear modelization of the channel using a Volterra decomposition. In order to truncate to the third order the Volterra based model for non-linear channel equalization, we currently approach the amplifier response by a polynomial of order3 or higher.
We proposed a piecewise approximation of the amplifier response instead of on its whole operational range, the third order polynomial approximation being followed by a third order truncation on the Volterra based model. We highlighted in this paper that this method leads to an improved detection performance for both Nyquist and faster-than-Nyquist trans-missions in non-linear channel. Beyond the detection threshold improvement, for faster-than-Nyquist in non-linear channel, the achievable spectral efficiency upper bound is improved.
REFERENCES
[1] ETSI, Digital Video Broadcasting (DVB): Second generation framing
structure, channel coding and modulation systems from Broadcasting, Interactive Services, News Gathering and other broadband satellite applications. Part 2: DVB-S2 Extensions (DVB-S2X), ETSI EN 302 307-2 V1.1.1, 10/2014.
[2] J.G. Proakis, M. Salehi, Digital Communications, 5th Edition, McGraw-Hill, 2008 - Chapter 10.
[3] S. Benedetto, E. Biglieri, and R. Daffara, Modeling and performance
evaluation of nonlinear satellite links-a volterra series approach, IEEE Transactions on Aerospace and Electronic Systems, vol. AES-15, no. 4, pp. 494 507, july 1979
[4] . G. Colavolpe, A. Piemontese, ”Novel SISO Detection Algorithms for
Nonlinear Satellite Channels”, IEEE Wireless Communications Letters, Feb. 2012.
[5] B. Benammar, N. Thomas, M.L. Boucheret, C. Poulliat, M. Dervin
”A comparison of iterative receivers for the non linear satellite chan-nel”IEEE 16th International Workshop on Signal Processing Advances in Wireless Communications (SPAWC), 2015
[6] J.E. Mazo, ”Faster than Nyquist Signaling”Bell Syst. Tech. J., vol. 54, pp, 1451-1462, Oct. 1975.
[7] A. D. Liveris, C. N. Georghiades, ”Exploiting Faster-Than-Nyquist
Sig-naling”IEEE Transactions on Communications, Vol. 51, No. 9, Sept. 2003 [8] F. Rusek and J. B. Anderson, ”Constrained capacities for faster than
Nyquist signaling”, IEEE Trans. Inf. Theory, vol. 55, no. 2, pp. 764-775, Feb. 2009.
[9] A. Piemontese, A. Modenini, G. Colavolpe, N. S. Alagha ”Improving
the Spectral Efficiency of Nonlinear Satellite Systems through Time-Frequency Packing and Advanced Receiver Processing”, IEEE Trans-actions on Communications, vol. 61, no. 8, Aug. 2013
[10] J.A. Lucciardi, N. Thomas, M.L. Boucheret, C. Poulliat, G. Mesnager
”Trade-Off Between Spectral Efficiency Increase and PAPR Reduction When Using FTN Signaling: Impact Of Non Linearities”IEEE Interna-tional Conference on Communications (ICC), 2016
[11] Stephan Ten Brink, ”Convergence Behavior of Iteratively Decoded
Parallel Concatenated Codes”, IEEE Transactions On Communications, vol. 49, No. 10, October 2001
[12] Alexei Ashikhmin, Gerhard Kramer and Stephan ten Brink, ”Extrinsic
Information Transfer Functions: Model and Erasure Channel Properties”
IEEE Transactions On Information Theory, vol. 50, No. 11, November 2004
[13] L. R. Bahl, J. Cocke, F. Jelinek, and J. Raviv , ”Optimal Decoding of
Linear Codes for Minimizing Symbol Error Rate”, IEEE Transactions on Information Theory, March 1974
[14] G. David Forney, ”Maximum-Likelihood Sequence Estimation of Digital
Sequences in the Presence of Intersymbol Interference ”, IEEE Transac-tions on Information Theory, vol. IT-18, No. 3, May 1972
[15] G. Ungerboeck, ”Adaptive Maximum-Likelihood Receiver for
Carrier-Modulated Data-Transmission Systems”, IEEE Transactions on Commu-nications, vol. COM-22, No. 5, May 1974
![Fig. 9: ASE of MAP detection for [8PSK, τ = 1.0] and [8PSK, τ = 0.75] with both the usual and the improved polynomial approximation - IBO=0dB](https://thumb-eu.123doks.com/thumbv2/123doknet/2965619.81977/7.892.467.796.471.731/fig-ase-map-detection-usual-improved-polynomial-approximation.webp)