!
"
"##
!
#
$% " &'()*
" % $"
&+ &+&)#, ,
- .+&/ +0 +.*
1
"## 2
-#&+ &+&)#, ,
- .+&/ +0 +.*
" 3 , 4
5
4 6
4
7
%
4
3 , 4 5
"
.+&/ 4 8
9
5
4
*/.4 4
(* ! )0
-"
!
:
!
!
Effect of carboxymethylcellulose on potassium bitartrate crystallization
on model solution and white wine
Audrey Bajul
a,b, Vincent Gerbaud
b,⇑, Sébastien Teychene
b, Audrey Devatine
b, Gilles Bajul
aa
CELODEV SAS, Aÿ, France
bLaboratoire de Génie chimique, Université de Toulouse, CNRS, INPT, UPS, Toulouse, France
a r t i c l e
i n f o
Keywords:
A1. Crystal morphology A1. Nucleation
A2. Industrial crystallization B1. Potassium compounds B1. Salts
B1. Carboxymethylcellulose
a b s t r a c t
Instability in bottled wines refer to tartaric salts crystallization such as potassium bitartrate (KHT). It is not desirable as consumers see the settled salts as an evidence of a poor quality control. In some cases, it causes excessive gushing in sparkling wine. We investigate the effect of two oenological carboxymethyl-cellulose (CMC) for KHT inhibition in a model solution of white wine by studying the impact of some properties of CMC such as the degree of polymerization, the degree of substitution, and the apparent dis-sociation constant determined by potentiometric titration. Polyelectrolyte adsorption is used for deter-mining the surface and total charge and for providing information about the availability of CMC charged groups for interacting with KHT crystal faces. The inhibitory efficiency of CMC on model solution is evaluated by measuring the induction time with the help of conductimetric methods. Crystals growth with and without CMC are studied by observation with MEB and by thermal analysis using DSC. The results confirm the effectiveness of CMC as an inhibitor of KHT crystallization in a model solution. The main hypothesis of the mechanism lies in the interaction of dissociated anionic carboxymethyl groups along the cellulose backbone with positively charged layers on KHT faces like the {0 1 0} face. Key factors such as pH, CMC chain length and total charge are discusses.
1. Introduction
Potassium bitartrate (KHT) develops naturally in wine causing settled salts in wine bottle. Besides, an excessive gushing when the bottle is opened with a sparkling wine can occur since endoge-nous tartrate crystals entrap gas pockets and thus start the bubble production as nucleation sites[1]. Both phenomena are badly con-sidered by consumers. To avoid crystallization of these salts, sev-eral chemical and physical methods are possible including the most commonly used but expensive cold stabilization. It consists in a cooling down to lower the saturation temperature noted Tsat followed by filtration. Other alternatives exist such as using addi-tives. The use of molecules from the carboxymethylcellulose family is authorized by the OIV (Organisation Internationale de la Vigne et du Vin) since 2009 with a maximal dosage at 100 mg/l. It is consid-ered less expensive, efficient for white wine and quick to add to the winemaking process.
The crystallization of potassium hydrogen tartrate is controlled by solid-liquid equilibrium of the solute species K+with the disso-ciated species TH!from L(+)-tartaric acid in wine according the following equation:
Kþ
solþ C4H5O!6sol!KC4H5O6 ð1Þ
Equilibrium is not reached during the bottling process. The complexity and diversity of wines make it difficult to assess the mechanisms of crystallization inhibition in situ and we use in this work a model solution, instead.
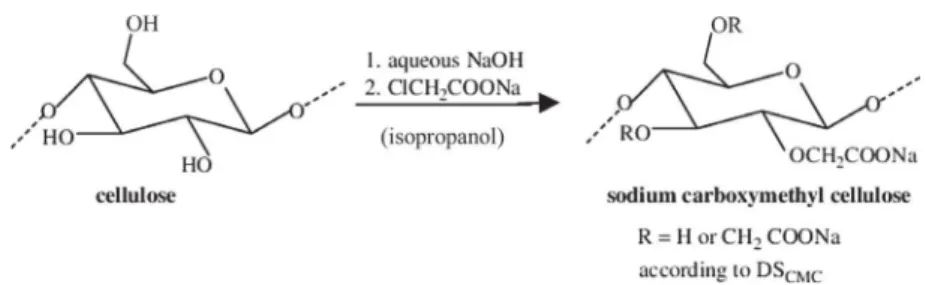
Carboxymethylcellulose (CMC) is a derivative of cellulose and is widely used as a food additive so called E466 in concentrations up to several g/l in dairy products. For wine, carboxymethylcellulose is used as a sodium salt CMC-Na. The polymers are obtained by mercerization in sodium hydroxide followed by etherification with monochloroacetic acid to change primary or secondary alcohol groups of b-D glucose units on cellulose chains to sodium acetate groups (Fig. 1). Carboxymethylcellulose is an ionic cellulose ether with a non-uniform distribution of substitution of the hydroxyl groups on the backbone. CMC consists of unsubstituted (D
-glucose), monosubstituted (2-, 3- and 6-mono-carboxymethyl-D
-glucose), disubstituted (2,3-, 2,6- and 3,6-di-O-carboxymethyl-D
-⇑Corresponding author.
E-mail addresses:[email protected](A. Bajul),vincent.gerbaud@ensiacet. fr (V. Gerbaud),[email protected] (S. Teychene),audrey.devatine@ ensiacet.fr(A. Devatine),[email protected](G. Bajul).
glucose), and trisubstituted (2,3,6-tri-O-carboxymethyl-D-glucose)
units (Fig. 1).
Both the degree and the type of substitution influence the solu-bility of the polymer and its ionicity[2]. If the inhibitory effect of CMC on KHT crystallization is undisputed[3–6], its mechanisms are not well understood. This is our main goal. In several studies [3–6], it has been postulated that CMCs may interact with their negative charge with the positive charge on the crystal surface of KHT caused by potassium layers[7–9].
In this paper, we study in detail the effect of CMC on KHT crystal in a model solution rather than wine in order to avoid interaction with others wine components like polyphenols and other forms of colloidal materials. Those wine components have been showed to be natural inhibitors of KHT crystallization affecting both nucle-ation and crystal growth processes[10].
Our work aims at providing a sounder understanding of the interaction mechanisms between CMC and KHT. After a presenta-tion of the theoretical background for the preparapresenta-tion of a model solution and induction time measurements (Section2), we report results for two oenological carboxymethylcelluloses noted CMC A and CMC B. The results are then discussed. Then, we present exper-imental studies (Section3) aiming at determining properties of the CMCs like the total charge with the help of adsorption of cationic polyelectrolyte[11]and their influence on the growth morphology of KHT crystals obtained from model solution and in white wine. Inhibitory mechanisms are inferred from these results and dis-cussed all along.
2. Theoretical procedure
2.1. Supersaturation determination for a model solution 2.1.1. Characterization of model solutions and physico-chemistry
Model solutions were prepared to match a white sparkling wine before wine stabilization[12,13]. The supersaturation SKHTin the model solution is dependent on the temperature conditions and other thermodynamic properties such as pH, temperature, ethanol content, solubility product, the ionic strength, density of solution [8,14,15]. Supersaturation can be computed by solving the thermo-dynamic equations depending on the salt and organic acid dissoci-ation equilibria, taking into account activity coefficients and molality of each species[16,17].
The alcohol content for this study is set to 12.5% (v/v) and the pH to 3.25. The saturation temperature Tsatis 18.6 !C. Under these conditions, the density is 982.3 kg/m3, the acid dissociation con-stants of the tartaric acid are pKa1(TH2) = 3.24 and pKa2(TH2) = 4.59[14]and the solubility product KST(KHT) is 8.3 % 10!5mol2/ kg2. The dissociation of tartaric acid enables to evaluate the per-cent of each dissociated species in the model solution without tak-ing into account the KHT complexes[8]. The total molality of the tartaric species is given by Eq.(2)as follows:
mTH2;total¼ mTH2þ mTH!þ mT2! ð2Þ
With:
mTH2Molality of non-dissociated tartaric acid species (mol/kg of
solvent)
mTH!Molality of tartrate ion (mol/kg of solvent)
mT2! Molality of bitartrate ion (mol/kg of solvent).
By using the usual expression for acid dissociation equilibria [10], one can predict the molality of TH!as follow. The activity coefficient of non-dissociated TH2 is set equal to one. The other activity coefficients are defined by Eqs.(3) and (4).
c
2 ';H:TH¼c
Hþ%c
TH! ð3Þc
3 ';H2:T¼c
2 Hþ%c
T2! ð4ÞMolalities of tartrate species are obtained from Eqs.(5) and (6) with Ka1= 10!pKa1and Ka2= 10!pKa2.
mTH!¼ mTH2;total 1 þKa2c2';H:TH mHþc3 ';H2:Tþ mHþc2 ';H:TH Ka1 ð5Þ mT2! ¼ Ka2mTH!
c
2';H:TH mHþc
3'H2:T ð6ÞThe distribution of the tartaric acid species at different pH is represented inFig. 2. The percent of TH!for the model solution with a pH of 3.25 is 48.12%.
In Eqs.(3) and (4), the activity coefficient in KHT solution is computed by using the extended Debye Hückel law. This model is valid in case of a weak ionic strength noted I, equation(7), lower than 0.1 mol kg!1[18]. It depends on the charges z
iof the dissolved species: I ¼12X i miz2i ð7Þ 0% 20% 40% 60% 80% 100% 2 2.5 3 3.5 4 4.5 5 % species pH TH- % T2- % TH2 %
Fig. 2. Percent of tartaric acid dissociation in model solution at different pH with the qqsolution at Tsat= 18.6 !C and EtOH of 12.5% (v/v) at 25 !C.
log10ð
c
'Þ ¼ !ADHzþjz!j % ffiffi I p 1 þ BDHa
p þ CffiffiI DHI ð8ÞWith the constants:
ADH¼ 1 4
p
lnð10Þ e ffiffiffiffiffiffiffiffie
kT p # $3 ffiffiffiffiffiffiffiffiffiffiffiffiq
0NA 2 r ð9Þ BDH¼ ffiffiffiffiffiffiffiffiffiffiffiffiffiffiffiffiffiffiffiffi 2e2NAq
0e
kT r ð10Þ CDH¼ 0:055 ð11Þ witha
The shortest approach distance close to hydrated cation (0:4 % 10!9m for Hþ;0:5 % 10!9m for Kþ)e
The product of relative dielectric relative constant of the solvent r and the Permittivity,e
¼e0er
e0
Permittivity (8:854187 % 10!12F m!1) e Electron charge (1:602177 % 10!19C)k Constant of Boltzmann (1:380658 % 10!23J K!1) NAAvogadro’s Number (6:022136 % 10!23mol!1)
q
0Density of solvent (kg m!3)Our model solution contains at first a mixture of water and 12.5 vol% ethanol as the solvent, and tartaric acid and potassium salt as K2SO4as solute along with Na brought by sodium hydroxide to set the pH constant. The potassium salt is considered completely soluble in the solvent. Recombination of sulfate in sulfuric acid is taken into account with pKa1,H2SO4= !3 and pKa2,H2SO4= 1.93[8]. Hence, the ionic species present are H+, K+, Na+ for cations and HSO4!, SO42!, TH!and T2!for anions. Because of the low concentra-tion of the CMC additives, their ionic contribuconcentra-tion is considered insignificant. The calculation of the molality of all species proceeds iteratively by initializing in the first place a molality of H+and an ionic strength to solve the equation of the electro neutrality as fol-lows in Eqs.(12) and (13):
X ðzimiÞcations¼ X ðzimiÞanions ð12Þ mHþþ mKþþ mNaþ¼ 10 !14
c
2 HþmHþþ mHSO ! 4þ 2mSO2!4 þ 2mT2!þ mTH ! ð13ÞWith the molality of the species depending on the molality of H+, the equation has one unknown, which is m
Hþ. The proton H+
activity coefficient is computed using a mean activity coefficient equation like Eq.(3)with McInnes convention[8].
In Eq.(13), only the free potassium ions are considered. Never-theless, the complexation of salts KHT exist in hydro-alcoholic media[8,19]. Hence, by using the KHT complexes dissociation con-stant Kd(KHT) = 0.05 mol/kg of solvent[8] one can evaluate the precise amount of fully solvated potassium cations as follows. In Eq. (14) the molality of potassium ion is determined based on K2SO4salts introduction with mK+equal to 2mK2SO4.
mKHT¼
mKþ% mTH!%
c
2';H:TH
KdðKHTÞ ð14Þ
2.1.2. Supersaturation
The supersaturation ratio noted SKHTis expressed in term of activities using the molal scale[20]. SKHT, Eq.(15), is defined as a ratio between Kathe product of activities of free ions and KSTthe thermodynamic solubility product of the salt.
SKHT¼ ffiffiffiffiffiffiffi Ka KST s ¼ ffiffiffiffiffiffiffiffiffiffiffiffiffiffiffiffiffiffiffiffiffiffiffiffiffiffiffiffiffiffiffiffiffiffiffiffiffiffi ð
c
2 ';H:THmTH!mKþÞ KSTðKHTÞ s ð15ÞBy definition, the supersaturation is equal to one at the so-called saturation temperature noted Tsat.
2.2. Induction time
The induction time noted tindis the time necessary for crystals to appear. It is affected by many factors. The induction time delay can be due to a change of the equilibrium solubility or the solution structure by adsorption or chemisorption on nuclei or also by the formation of complex in solution [21]. Other important factors are the level of supersaturation, the state of agitation, the presence of impurities, the viscosity, etc.[21].
The induction time can be divided in different time lags: there is the relaxation time called tr that is required for this system to achieve a quasi-steady-state distribution of molecular clusters. Time is also required for the formation of a stable nucleus called tnand finally the time for the nucleus to grow to a detectable size is noted tg. They all sum up to give the induction time according to Eq.(16) [21]:
tind¼ trþ tnþ tg ð16Þ
It is difficult to separate each contribution and we are only interested on the induction time. The presence of impurities or seed crystals can reduce considerably the induction time when they induce secondary nucleation, usually much faster than pri-mary nucleation. For the sake of a fair comparison of the induction time delay induced by several additives, we maintain similar con-ditions during the experiments: a strong mixing, the same volume of reactor, careful monitoring of the temperature, a closed reactor to avoid any introduction of other impurities.
The induction time is a measure of the nucleation event under the assumption that the induction time is inversely proportional to the rate of nucleation according to Eq.(17) [21]:
tind/ J!1 ð17Þ
According to Mullin, the classical nucleation relationship may be written and has been simplified according to the Eq.(18)as fol-lows[22]: tind¼ k A0exp B ln2 ðSÞ ! ð18Þ B ¼16
pr
3V 2 m 3k3T3 ð19ÞWith k being the Boltzmann constant, the molecular volume Vm in m3and
r
interfacial tension in J m!2.A plot of log(tind) versus (logS)!2regressed with a straight line allows to evaluate the interfacial tension
r
. The value of the inter-facial tension is then used as an indicator of the ability of the solute to be crystallized in the solution spontaneously. The higher the value, the more difficult it is for the solute to crystallize.2.3. Dissociated groups in cellulose derivative
The adsorption of cationic polymers with a high charge density is a powerful method to determine the availability of ionized groups on macromolecules such as CMC. Cationic polymers with a low molecular weight have more easily access to all charges on the surface because of the conformation of the chain in solution. Alternatively, cationic polymers with a high molecular weight in the medium tend to fold and then, more time is necessary to have
a complete determination of charges [23]. Knowledge of the amount of cationic polymer enables to determine by extrapolating the plateau value of adsorption reaching 0 mV, the isoelectric point. Then, the total charge is supposed to be proportional to the number of available ionized group on the cellulose[24]. 3. Materials and methods
3.1. Model solution
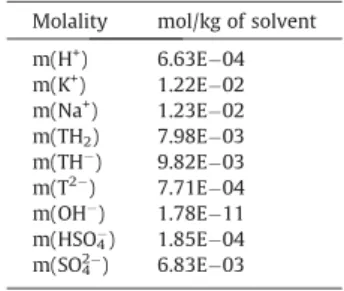
Model solutions were prepared by dissolving 1.2 g/l of potas-sium salt K2SO4(Sigma Aldrich) and 3.0 g/l of tartaric L(+) acid (Sigma Aldrich) into water with 12.5% (v/v) of ethanol (ethanol absolute anhydrous Carlo Erba). Then, pH was adjusted by using a solution of NaOH at 5 M to obtain a value of 3.25 within the pH range of wine and to have a sufficient amount of TH!to favor the KHT crystallization (seeFig. 2). Knowing the concentration of species, equations from Section2.1enable to compute the activity coefficient (Table 1) and the molality of different ions (Table 2). The ionic strength of model solution is I = 0.033 mol kg!1 and Tsat= 18.6 !C.
3.2. Carboxymethylcellulose
3.2.1. Solution of carboxymethylcellulose
For this study, we choose two oenological CMC previously washed with acetone and ethanol. For induction time measure-ments, solutions of CMC A and CMC B were prepared as follows: adding 1 g of each polymer powder into 100 ml in vigorously stir-red deionized water and further stirring for 30 min at 30 !C for a better dissolution. The solutions were refrigerated overnight to ensure complete hydration of polymer.
3.2.2. Degree of substitution
The degree of substitution measurements were done by NMR to determine the average distribution of groups on a glycoside unit. The protocol was as follows[25]: 150 mg of the CMC sample was placed in a beaker then adding 1 ml of D2O. Then 1 ml of (50:50) (v/v) D2O + D2SO4was slowly added to the previous mixture to dis-perse the CMC completely. The mixture was heated to 90 !C for at least 30 min and up to 2 h with steady agitation to help break the gel effect that often happens when dissolving CMC. Once the hydrolysis was complete, the solution obtained was homogeneous and fluid and displayed a pale yellow color. Approximately 0.4 ml of solution was save by a syringe filter for NMR analysis.
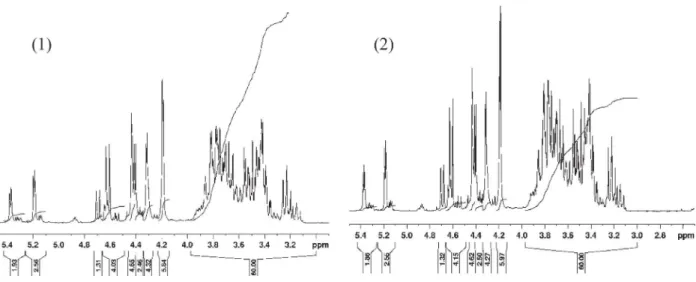
The method above allows the complete depolymerization of the CMC unsubstituted unit[26]. The determination of the mole frac-tions is carried out by an addition of the different areas from NMR spectrum of the hydrolysate of CMC sample. The NMR analy-ses of CMC A (1) and CMC B (2) are shown inFig. 3.
3.2.3. Degree of polymerization
The degree of polymerization and the molar mass were deter-mined by viscosimetry following the ASTM D2515 protocol. Vis-cosimetric measurements were carried out with an automatic viscoclock SI Analytics capillary Ubbelohde tube at 25 !C and the
viscosity constant K was about 0.01 mm2/s2. Intrinsic viscosities of CMC were obtained by dissolving the sample at different con-centrations in 0.5 M NaOH. The concentration range investigated was from 1 to 6 g/l. The correction of the kinematic viscosity was obtained by the following Eq.(20)with the different parameters: K for the constant equal to 0.01 mm2/s2, then t for the time mea-sured in s with the device and y the Hagenbach correction time.
m
c¼ Kðt ! yÞ ð20ÞWith the kinematic viscosity and the density of the solution, the intrinsic viscosity
mc
is given by:g
¼qm
c ð21ÞThe molecular weights of the CMC were calculated by determi-nation of the intrinsic viscosity and by using Huggins and Kramer Eqs.(22) and (23) [27]:
g
sp c ¼ ½g
, þ k1½g
, 2 c ð22Þ lnðg
rÞ c ¼ ½g
, þ k2½g
, 2 c ð23Þwhere
gsp
= (g
!g
s)/gs
andgr
=g
/gs
withgs
andg
the viscosi-ties of the solvent and the solution respectively. The intrinsic vis-cosity equals 10 times the ordinate at the intersection with the x-axis origin. Then, the molecular weight was determined using the corresponding Mark-Houwink Eq.(24) [28]:½
g
, ¼ 5:37 % 10!4M0:73
w ð24Þ
To finalize, the degree of polymerization DP in Eq.(25) was obtained for each CMC depending on the degree of substitution noted DS:
DP ¼162 þ ð80 - DSÞMw- 1000 ð25Þ
3.2.4. Characterization of carboxymethylcellulose
After analysis of the NMR data inFig. 3, calculation of the peak areas gives access to the fraction of carboxymethyl groups in each position O-2, O-3 and O-6 (Table 3). DP, DS and Mwof CMC A and CMC B are also summarized inTable 3.
Table 3shows that CMC A and CMC B have the same DS but a DP that is different. The distribution of the substitutes is important for understanding the acting mode of CMC particularly because of steric hindrance and winding shape of CMC under set conditions (pH in particular).1H NMR spectroscopy results in a direct infor-mation on the substituent distribution within at the O-2, O-3 and O-6 atom. FromTable 3, it is noticed that the distribution of substi-tutions along the chain for both CMCs is ranked in the order O-2 > O-6 > O-3. It is also evident that different distribution can be obtained for the same DS. Hence, DS information alone does not discriminate CMCs. Table 1 Calculation of activity coefficient. Activity coefficient c(H+) 0.840 c(K+) 0.833 c± (K:HT) 0.836 c± (H2:T) 0.703 Table 2
Calculation of molality of each species in model solution.
Molality mol/kg of solvent
m(H+) 6.63E!04 m(K+) 1.22E!02 m(Na+) 1.23E!02 m(TH2) 7.98E!03 m(TH!) 9.82E!03 m(T2!) 7.71E!04 m(OH!) 1.78E!11 m(HSO4!) 1.85E!04 m(SO42!) 6.83E!03
3.2.5. Degree of dissociation by potentiometric methods
To measure the total charges along the chain, solutions of CMC were prepared at 0.025% (w/w) in deionized water. Poly(dimethyl-diallylammonium) chloride (PolyDADmac) (Mw> 100,000) was used for the surface charge determination. All acid groups of the CMC were converted to the form CMC-H with HCl. The pH was adjusted to 2.5 with 0.1 M HCl. The suspension was stirred to reach adsorption equilibrium at each pH value. pH was recorded with a pH-meter Thermo Scientific (ORION VersaStar) and increased by adding NaOH (0.1 M). Each measure was done three times.
Once pH was set, 10 ml of solution of CMC was titrated with PolyDADMAC using a MUTEK PCD-02 particle charge detector to detect the zero potential point. The amount of charge adsorbed with the polymer at this point was taken as the charge of the CMC solution. The charge density was determined by the following Eq.(26):
q ¼ C V) polyDADMAC! Vblank* 1000w ð26Þ
where Vblankand VpolyDADMACare titration volumes in ml of poly-DADMAC for the blank sample and the CMC sample, respectively. C is the weight concentration of cationic polymer, 1000 is the ratio of the total volume of filtrate and the volume of filtrate suspension taken to the titration, and w is the dry mass of the sample in g.
The plots inFig. 4show that the adsorption of CMC on cationic polymer increases with pH and, at some point, it reaches a constant value. This point is considered as the apparent pKa value. For pH < pKa, CMC exhibits predominantly the form CMC-OCH2COOH. When the pH increases, more carboxymethyl substitutes dissociate and the volume of cationic polymer needed to do the titration increases. After the pKavalue, CMC is completely dissociated as CMC-OCH2COO!. Both CMCs display the same trend with pKa val-ues close to each other but CMC B has a higher total charge (Table 4).
It was observed that the titration duration was longer for CMC A compared to CMC B. This could be explained by the longer chain of CMC A (larger DP) that would cause folding. This phenomenon influences the accessibility of the surface sites for adsorption with the cationic polymer, and more time is needed to reach the titra-tion equilibrium at each pH value.
The results at any pH, and in particular at the value used in the induction time measurements (pH = 3.25) show that the CMC B curve lies above that of CMC A on average. We may conclude that it has more anionic sites.
Fig. 3.1H NMR spectra of CMC A (1) and CMC B (2).
Table 3
Degree of substitution DS of carboxymethylcellulose (CMC) determined by NMR spectroscopy, Degree of polymerization DP of CMC determined by viscosimetry method and molecular weight Mw.
Samples Mole fraction of carboxymethyl groups DS DP Mw(kg/mol)
O-2 O-3 O-6
CMC Aa 0.344 0.236 0.296 0.93 238 59.8
CMC Ba 0.363 0.285 0.315 0.93 51 13.0
aOenological carboxymethylcellulose (food grade).
3 4 5 6 7 8 9 10 2 3 4 5 6 7 8 9 10 11 v o lu m e o f P o ly D A D M A C ( m l) pH CMC A CMC B
Fig. 4. Polyelectrolyte adsorption of CMC samples at 0.025% in deionized water as a function of pH (lines are for guidance only).
Table 4
pKadissociation value estimated by adsorption and total charge at pH 9.
Sample Apparent pKavalue Total charge (mmol/kg) at pH 9
CMC A 5.0 218.25 ± 6.13
3.3. Induction time
All induction time experiments start with 100 ml of model solu-tion in the double-walled Pyrex"
reactor thermostated at 25.0 ± 0.1 !C by liquid circulation through a constant temperature bath (LAUDA Ultra Kryomats RUK 90 SW) with a temperature Pt100 external sensor. Equal volume of model solution were added in each reactor, tightly closed to minimize the introduction of impurities and stirred with a magnetic rod at a constant rotation speed of 500 rpm.
To estimate the induction time, the conductimetric method was used. The signal output of the conductivity electrodes (Radiometer Analytical SA; XE100) was monitored by a setup from LABMATION. An electrode was immersed in a reference vessel containing 100 ml of 0.1 M KCl to control the calibration and follow exactly the vari-ation of temperature during the experiment. The temperature was set at 25 !C at the beginning and once the solution temperature became steady and the conductivity remained constant, the exper-iment was deemed ready to proceed. The temperature was reduced from 25 !C until a desired one to set the supersaturation with a temperature ramp of temperature set at 0.62 !C/min. For each ser-ies of experiments 15 replicates (3 - 5 reactors at the same time) were performed. The experiment was repeated with CMC A and CMC B in 1.5 mg/l concentration.
The first series of experiment with CMC A and CMC B carried out at 7 !C aimed at comparing the inhibitory efficiency of both carboxymethylcellulose. The second series of experiments was done at several temperatures to evaluate the interfacial tension crystal growth without additive and with the most efficient CMC.
3.4. Crystal analysis
3.4.1. Thermal analysis of KHT from model solution
Potassium salts crystals were prepared from pure KHT solutions (99.5%, Sigma Aldrich), ethanol (anhydrous Carlo Erba) to 12.5% (v/ v) in deionized water at 40 !C in a bottle of 1 L. The solutions were then cooled down at 5 !C without stirring for one week without and with 7.5 mg/l of carboxymethylcellulose. No stirring enables to have larger crystal and observe their face easily. The crystals were vacuum filtered on glass filters with retention of particles less than one micron and then dried in the open air to avoid deteriora-tion of crystal and expected CMC adsorbed on the surface.
The thermal properties of the KHT crystal were determined using a differential scanning calorimeter (Q2000 TA Instrument). For the measurement, a sample (10–15 mg) was placed in alu-minum pans and hermetically sealed. An empty alualu-minum pan was used as reference. The samples were heated to 300 !C at 2 !C/min from 30 !C under N2(50 ml/min). The thermal analysis was conducted on two types of samples previously grinded because of their large size reaching 0.9 mm: crystals of KHT grow-ing without additive and those grown with CMC B.
3.4.2. Morphological analysis of KHT from model solution and wine The same samples than the one used in the thermal analysis were analyzed by Scanning Electron Microscopy (FEG-SEM). As usual, gold was deposited on the samples to prevent damaging the crystals and to enhance the surface conductivity.
To obtain KHT crystals in wine, we proceeded as follow: 200 ml of white wine (12.2% of EtOH, pH = 3.09, tartaric acid 4.3 g/l, potas-sium 563 mg/l and Tsat measured by CheckStab = 20.7 !C) was cooled down at !5 !C for two weeks without agitation and with 0.5 mg/l of CMC. Crystals were filtered by using filters with reten-tion of particles less than one micron and then the crystals were dried in the open air.
4. Results and discussion 4.1. Induction time
Induction times of KHT measured at 7 !C in the 100 ml reactor are reported inTable 5.
CMC B is more efficient regarding KHT inhibition than CMC A. We recall that CMC B has more negative charges along the chain (Table 4) at all pH values and is shorter (Table 3) than CMC A. Then, we propose as a first explanation for the inhibition of KHT nucle-ation that it is related to the available charge density along the chain of the polymer.
Then, the reproducibility of measurements with CMC A is lim-ited as evidence by the large standard deviation and we may attri-bute it to its bigger DP (Table 3) which may favor folding. It is another possible factor not favorable for inhibiting nucleation, compared to CMC B.
Regarding the information about the DS or the repartition of substitutes in position O-2, O-3 or O-6 (Table 3), we find no corre-lation with the trend on the influence of the CMC on the induction time.
We can draw the partial conclusions:
1. The lower the DP of the CMC, the better the adsorption effi-ciency and the accessibility of charges sites along the chain to interact with sub-critical nuclei and prevent them to become crystals.
2. The higher the total charge at the operating pH, the most effi-cient is the CMC in terms of KHT crystal inhibition.
4.2. Interfacial tension
The interfacial tension was determined for the most efficient CMC, namely CMC B. Experiments were done at different supersat-uration depending on the temperature. Supersatsupersat-uration S at each temperature was calculated according to the procedure in
Sec-Table 5
Induction time without additive and with 1.5 mg/l of CMC A, CMC B at 7 !C.
Sample tind
Blank 50 min 33 s ± 4 min 50 s CMC A 4 h 40 min 35 s ± 36 min 36 s CMC B 7 h 34 min 40 s ± 3 min 34 s
Table 6
Induction time at different temperature with calculated supersaturation with CMC and Blank. Temperature (!C) S tind(s) Blank CMC B 2.3 1.793 – 605 2.5 1.781 – 750 3.0 1.750 – 775 3.3 1.732 – 912 3.5 1.700 – 1828 4.0 1.690 – 2166 6.3 1.559 2052 12,122 6.5 1.548 2366 15,618 7.0 1.521 2833 27,262 7.3 1.505 3420 – 7.5 1.494 4987 – 8.0 1.468 6578 – 8.5 1.442 8436 – 9.0 1.416 14,233 –
tion2.1. The temperature range was 2–7 !C with respectively a range of supersaturation S from 1.781 to 1.521 with CMC B and was varied from 6 !C to 9 !C without additive with S from 1.559 to 1.416. The experiment at each temperature was doubled. The results of induction time are reported inTable 6.
The logarithm of induction times as a function of equation B/ ln2(S) was reported in Fig. 5 to obtain the slope giving directly the interfacial tension value according to Eqs.(18) and (19).
By setting the molecular volume of KHT at 3.3 Å3[8]the inter-facial tension equals 58.13 ± 3.93 mJ/m2(with R2= 0.9923) with-out additive and 76.86 ± 3.12 mJ/m2 (R2= 0.9701) with CMC B. These results show that the presence of additive increases the interfacial tension during the nucleation and reduced KHT ability to crystallize.
4.3. Crystal analysis
4.3.1. Thermal analysis of KHT from model solution The DSC profile is shown inFig. 6.
The DSC profile for the KHT sample shows an endothermal peak at 258.31 !C without additive and at 258.33 !C in the presence of CMC B. But with CMC B, a second exothermic peak at 202.33 !C was observed in more than half the crystals grown in the presence of additive. The origin of this second peak is unclear, but it might result from the traces of additives on the crystal surface as micro-scopic observations hinted at that (see Section4.3.2). Notice that the amount of additive was negligible compared to the mass of crystals: 5 g of dry crystals and a mere fraction of the 7.5 mg/l of additive added in the preparing solution.
6 7 8 9 10 11 5000 10000 15000 20000 25000 30000 ln (tin d ) m)/(3k3T3ln2S) CMC B Blank
Fig. 5. Determination of interfacial tension in model solution with (CMC B) or without additive at different supersaturation.
-2.5 -2 -1.5 -1 -0.5 0 0.5 1 1.5 2 -3.5 -3 -2.5 -2 -1.5 -1 -0.5 0 170 180 190 200 210 220 230 240 250 260 270 280 290 300 H ea t fl o w (W /g ) (2 ) H ea t fl o w (W /g ) (1 ) temperature (°C) (1) (2)
Fig. 6. Thermal analysis by DSC of two types of crystals without additive (1) and with CMC B (2).
The high exothermic peak around 250 !C is attributed to the KHT crystal itself. It is more chaotic in the presence of the CMC. But, it is unsafe to conclude regarding a possible inclusion of CMC B in the structure that would explain the DSC profile variation between 258 !C and 262 !C. Subsequent analysis of the fusion tem-peratures of the two types of crystals and background results of X-ray analysis (XRD) of the same crystals showed that the two
crystal structures are similar with the same faces present (not shown).
4.3.2. Morphological analysis of KHT from model solution and wine The crystal structure was modelled in[8] and display of the main faces were then published. It consists of a superposition of a network tartrate ion TH!connected by hydrogen bonds in the
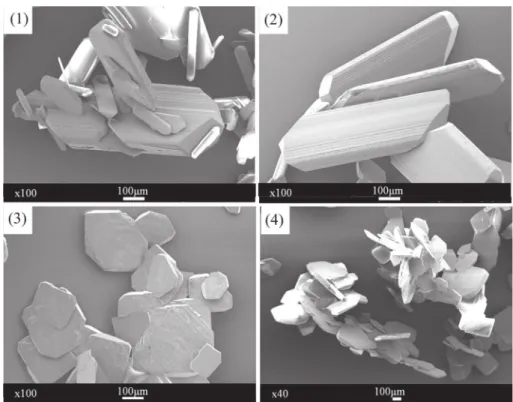
Fig. 8. Microscopic analysis at room temperature of KHT crystals from model solution without additive (1) and (2) and with the presence of CMC B (3) and (4).
(1): KHT with CMC B x40, X: 1933.595µm Y: 1558.594µm (2) KHT without additive, x30 X : 2559.375 µm Y: 2368.750 µm (3) KHT without additive, x40
form of a layer followed by another layer of K+cations perpendic-ular to the [0 1 0] direction. Crystal growth occurs predominantly following an accumulation of positive and negative charges in the direction [01 0] and continues with parallel macro-steps in the [1 0 0] on the face {0 1 0}. Other facets have been identified in the literature according to theFig. 7 [8] and the morphology of crystals in the wine is not the same as in the model solutions because of the presence of colloids or impurities, which block the adsorption of growth sites on the surface giving a more rounded form to the crystal[7].
Crystals observation by MEB are displayed inFig. 8with crystals from model solution used for thermal analysis.Fig. 9gives results from MEB for crystals from white wine. X and Y given above indi-cate the maximal size of crystal.
A qualitative observation of the crystals habit (Fig. 8) hints at a preeminence of the {0 1 0} face in the presence of additive. This was already noticed in the literature[3,10]. Despite the same supersat-uration and growth time without any agitation, KHT crystals with-out additive have an average size of 870
l
m (Fig. 8-1) that is smaller and KHT crystals with CMC B have an average size of 500l
m (Fig. 8-4).Without additive, the surface of the crystal also presents paral-lel layers. On the other hand, the crystal surface with CMC B pre-sents macro steps, which hint at the inclusion of impurities or additives on the surface[20,21].
The crystals obtained from wine show a very different habit in the shape of flowers (Fig. 9). That irregularity has to do with pres-ence of many components, incl. macromolecules in wine. Without additive, the shape of the crystal is always the same. When addi-tives as CMC B is added, the shape of the KHT crystal is completely unrecognizable due to the sites blocked by CMC.
In summary, the conclusions of this Section4.3are:
1. CMC seems to be included in the structure of the KHT crystal but the amount could not be quantified because of the low concentration.
2. CMC is adsorbed on the surface created random macro steps on the crystal surface, likely because of growth sites blocking induced by the interaction of anionic charges of CMC with the K+positive dominant layers on the main faces like {0 10}. As a consequence, the growth in the [0 10] direction is slowed down and the crystal habit shows a preeminent {0 1 0} face.
3. CMC has effect on crystal growth on model solution as well as on wine by blocking growth sites and reducing crystals size. 5. Conclusion
We have confirmed the effectiveness of two oenological car-boxymethylcellulose as inhibitors of KHT crystallization in a model solution where they increase the induction time by a fivefold to eightfold factor. Interfacial tension estimation confirmed that CMC reduces the ability of KHT to crystallize. The main hypothesis of the mechanism lies in the interaction of dissociated anionic car-boxymethyl groups along the cellulose backbone with positively charged layers on KHT faces like the {0 1 0} face. This mechanism is postulated regarding sub-nuclei but it was evidenced for larger KHT crystals where CMC inclusion and/or adsorption is suspected based on miscrocopic observations that showed a flattening of the KHT crystal habit.
We have investigated some of the CMC properties, in particular their degree of substitution DS and of polymerization DP, the dis-tribution of carboxymethyl groups on the cellulose backbone and their total charge at different pH. We have found that the apparent dissociation constant of a weak polyelectrolyte such as car-boxymethylcellulose is around 5.0–5.3. The same experiment allowed to The most inhibiting CMC showed also the largest total
charge, determined by polyelectrolyte adsorption, and the smallest DP.
The solution pH affects the inhibition of potassium hydrogen tartrate KHT by CMC in several ways. First, it influences the KHT supersaturation and consequently the risk of nucleation as the tar-taric acid dissociation is pH dependent. Second, it affects the CMC dissociation and the number of -COO!charges. This degree of dis-sociation of the CMC also depends on the DS and the polymer charge density in solution.
The length of the CMC chain (DP) has an important influence on time induction measurement regarding its the variability. It was attributed to the CMC conformation, which is more likely to fold a larger DP and to reduce the accessibility of the CMC to surface sites, being polymer in the polyelectrolyte titration or the KHT crystal surface. The working condition as pH are also known to influence folding of macromolecules.
Further work is in progress regarding the salt content (higher ionic strength), ethanol content on polyelectrolyte adsorption. Acknowledgments
The author is grateful to Dr. J.F. Blanco for his constructive sug-gestions about measurements of DS and NMR and also Dr. M. Che-min to provide results from CELODEV. This work has been financed by CELODEV under Research Project CELOSTAB (2014–2016). References
[1]G. Liger-Belair, R. Marchal, P. Jeandet, Close-up on bubble nucleation in a glass of Champagne, Am. J. Enol. Vitic. 53 (2002) 151–153.
[2]H.D. Heydarzdeh, G.D. Najafpour, A.A. Nazari-Moghaddam, Catalyst-free conversion of alkali cellulose to fine carboxymethylcellulose at mild conditions, World Appl. S. J. 4 (2009) 564–569.
[3]V. Gerbaud, N. Gabas, J. Blouin, J.C. Crachereau, Study of wine tartaric salt stabilization by addition of carboxymethylcellulose (CMC). Comparison with the « protective colloïds » effect, J. Int. Sci. Vigne Vin 44 (2010) 135–150. [4]A. Bosso, D. Salmaso, E. De Faveri, M. Guaita, D. Franceschi, The use of
carboxymethylcellulose for the tartaric stabilization of white wines, in comparison with other oenological additives, Vitis 49 (2010) 95–99. [5]H. Claus, S. Tenzer, M. Sobe, M. Schlander, H. König, J. Fröhlich, Effect of
carboxymethyl cellulose on tartrate salt, protein and colour stability of red wine, Aust. J. Grape Wine Res. 20 (2014) 186–193.
[6]R. Guise, L. Filipe-Ribeiro, D. Nascimento, O. Bessa, F.M. Nunes, F. Cosme, Comparison between different types of carboxymethylcellulose and other oenological additives used for white wine tartaric stabilization, Food Chem. 156 (2014) 250–257.
[7]R. Rodriguez-Clemente, I. Correa-Gorospe, Structural, morphological, and kinetic aspects of potassium hydrogen tartrate precipitation from wines and ethanolic solutions, Am. J. Enol. Viti. 39 (1988) 169–179.
[8] V. Gerbaud, Détermination de l’état de sursaturation et effet des polysaccharides sur la cristallisation du bitartrate de potassium dans les vins. PhD thesis, Institut National Polytechnique de Toulouse, 1996. Open access athttp://ethesis.inp-toulouse.fr/archive/00001182/.
[9]J.C. Crachereau, N. Gabas, J. Blouin, B. Hebrard, A. Maujean, Stabilisation tartrique des vins par la carboxyméthylcellulose (C.M.C.), Bull. OIV. 74 (2001) 151–159.
[10] V. Gerbaud, N. Gabas, J. Blouin, C. Laguerie, Nucleation studies of potassium hydrogen tartrate in model solutions and wines, J. Cryst. Growth 166 (1996) 172–178.
[11]J. Laine, J. Buchert, L. Viikari, P. Stenius, Characterization of Unbleached kraft pulps by enzymatic treatment, potentiometric titration and polyelectrolyte adsorption, Int. J. Bio. Chem. Phys. Tech. Wood 50 (2009) 208–214. [12]D. Bunner, D. Goffette, D. Tusseau, M. Valade, D. Moncomble, La stabilité
tartrique des vins. L’appréciation de la stabilité tartrique des svins, Le Vigneron Champenois 9 (2012) 64–83.
[13]M. Valade, D. Bunner, D. Goffette, D. Tusseau, D. Moncomble, Stavigom. Stabilisation tartrique des vins avec les gommes de cellulose, Le Vigneron Champenois (2014) 28–43.
[14]B. Ratsimba, Cristallisation du bitartrate de potassium à partir de solutions hydroalcooliques – Extension des résultats à l’œnologie PhD thesis, Institut National Polytechnique de Toulouse, 1990.
[15] A. Devatine, Maitrise de l’acidité des vins : désadification par précipitation des malates de calcium et simulation des équilibres physico-chimiques à l’aide du logiciel Mextar. PhD thesis, Institut National Polytechnique de Toulouse, 2002. [16]H.W. Berg, R.M. Keefer, Analytical determination of tartrate stability in wine. I.
[17]L. Usseglio-Tomasset, M. Ubigli, L. Barbero, L’état de sursaturation des vins en tartrate acide de potassium, Bull. OIV 65 (1992) 703–719.
[18]A. Devatine, V. Gerbaud, N. Gabas, J. Blouin, Prediction and mastering of wine acidity and tartaric precipitations: the mextar"software tool, J. Int. Sci. Vigne
Vin 36 (2) (2002) 77–91.
[19]R.A. Robinson, R.H. Stokes, Electrolyte Solutions, second revised ed., Courier Corporation, 2002.
[20]J.W. Mullin, O. Söhnel, Expressions of supersaturation in crystallization studies, Chem. Eng. Sci. 32 (1977) 683–686.
[21]J.W. Mullin, Crystallization, Butterworth-Heinemann, 2001.
[22]M.C. Van Der Leeden, D. Kashchiev, G.M. Van Rosmalen, Precipitation of barium sulfate: induction time and the effect of an additive on nucleation and growth, J. Colloid Int. Sci. 152 (1992) 338–350.
[23]J. Wang, P. Somasundaran, Adsorption and conformation of carboxymethyl cellulose at solid–liquid interfaces using spectroscopic, AFM and allied techniques, J. Colloid Int. Sci. 291 (2005) 75–83.
[24]L. Fras, J. Laine, P. Stenius, K. Stana-Kleinschek, V. Ribitsch, V. Dolecˇek, Determination of dissociable groups in natural and regenerated cellulose fibers by different titration methods, J. Appl. Polym. Sci. 92 (2004) 3186–3195. [25]F.F.L. Ho, D.W. Klosiewicz, Proton nuclear magnetic resonance spectrometry for determination of substituents and their distribution in carboxymethylcellulose, Anal. Chem. 52 (1980) 913–916.
[26]T. Heinze, K. Pfeiffer, Studies on the synthesis and characterization of carboxymethylcellulose, Ang. Makro. Chem. 266 (1999) 37–45.
[27]D. Gómez-Dı´az, J.M. Navaza, Rheology of aqueous solutions of food additives: effect of concentration, temperature and blending, J. Food Eng. 56 (2003) 387– 392.
[28]T.E. Eremeeva, T.O. Bykova, SEC of mono-carboxymethyl cellulose (CMC) in a wide range of pH; Mark–Houwink constants, Carbohydr. Polym. 36 (1998) 319–326.