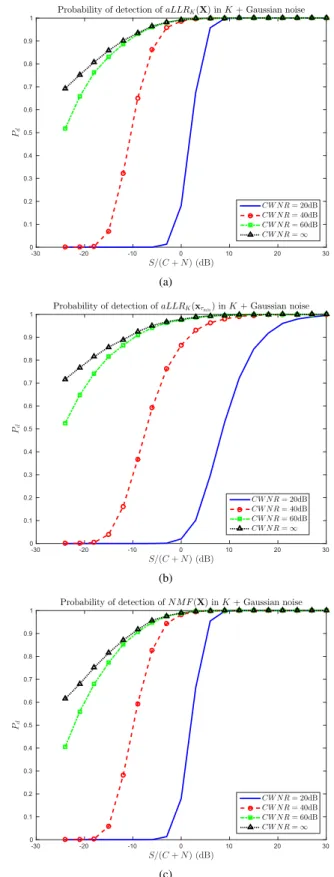
Sensitivity analysis of likelihood ratio test in K distributed and/or Gaussian noise
Texte intégral
Figure


Documents relatifs
We performed CEL-Seq2 both manually and using the C1 on mouse fibroblast cells carrying a CyclinB1-GFP fusion reporter [12] and compared this to data obtained using the
( 2012 ) showed a strong break in the evolution of the soft X-ray light curve after the shocks have overcome the equatorial ring, and we do not yet see such evolution in the 0.5–2.0
Considering a large number of received samples, one can easy see that their covariance matrix exhibit a different behaviour depending on the number of the components of the
Abramovich, “Regularized covariance matrix estimation in complex elliptically symmetric dis- tributions using the expected likelihood approach - part 2: The under-sampled case,”
Asymptotic performance, Unconditional Maximum Likelihood, finite number of data, high Signal to Noise Ratio, Cram´er-Rao bound..
S YSTEMIC OPTIMIZATION PROBLEM PROCEDURE In order to handle the optimization problem of the passive WT submitted to a consumption profile and a given wind speed, we have
Notre étude s’appuie sur les travaux de Henry (2018) qui, à travers sa classification d’outils tangibles, a montré que les finalités d’apprentissage de la programmation
MSM men who have sex with men, CEN childhood emotional neglect, MTF men to female, HDA family history of drug abuse, CSA childhood sexual abuse, HAA family history of alcohol abuse,