O
pen
A
rchive
T
OULOUSE
A
rchive
O
uverte (
OATAO
)
OATAO is an open access repository that collects the work of Toulouse researchers and
makes it freely available over the web where possible.
This is an author-deposited version published in :
http://oatao.univ-toulouse.fr/
Eprints ID : 14301
To link to this article : DOI :10.1109/LSP.2015.2480426
URL :
http://dx.doi.org/10.1109/LSP.2015.2480426
To cite this version :
Besson, Olivier and Abramovich, Yuri
Sensitivity analysis of likelihood ratio test in K distributed and/or
Gaussian noise
. (2015)
IEEE Signal Processing Letters, vol.22 (n°12). pp.2329-2333. ISSN
1070-9908
Any correspondance concerning this service should be sent to the repository
administrator:
[email protected]
Sensitivity Analysis of Likelihood Ratio Test in
Distributed and/or Gaussian Noise
Olivier Besson, Senior Member, IEEE, and Yuri Abramovich, Fellow, IEEE
Abstract—In a recent letter we addressed the problem of
de-tecting a fluctuating target in distributed noise using multiple coherent processing intervals. It was shown through simulations that the performance of the likelihood ratio test is dominated by the snapshot which corresponds to the minimal value of the texture. However, for this particular snapshot the clutter to thermal noise ratio is not large and hence thermal noise cannot be neglected. In the present letter, we continue our investigation with a view to con-sider detection in a mixture of distributed and Gaussian noise. Towards this end we study the sensitivity of our previously de-rived detectors. First, we provide stochastic representations that allow to evaluate their performance in distributed noise only or Gaussian noise only. Then, their robustness to a mixture is as-sessed.
Index Terms—Detector sensitivity, distributed noise,
likeli-hood ratio, radar processing.
I. INTRODUCTION ANDPROBLEMSTATEMENT
D
ETECTION of a target in competition with strong clutter and thermal noise is a predominant problem in most radar systems. The two sources of disturbance emanate from completely different physical phenomena and result in different power levels and statistical distributions. While the Gaussian assumption prevails for thermal noise, in a number of appli-cations, such as low grazing angles or with sea clutter, the heavy-tail nature of clutter has been observed experimentally [1]–[5]. The compound-Gaussian model [6], [7] has been thoroughly used [8]–[14]. It consists in modeling the received signal as where follows a complex Gaussian distribution with zero mean and covariance matrix , and the texture is a positive random variable. The most well-known detector within this framework is the normalized matched filter [10], which is derived by considering deterministic. Most often, mainly because the clutter to noise ratio is generally high, it is assumed that thermal noise can be neglected.In [15], we considered detection of a fluctuating target in fluc-tuating -distributed clutter, a problem formalized as
(1) where , , are a set of independent and identi-cally distributed (i.i.d.) radar returns, and where and stand for the target signature and amplitude, respectively. In [15], we showed that, in contrast to what is commonly admitted, thermal Gaussian noise cannot be ignored, even if clutter to noise ratio is high. Indeed, it was shown that, for heavy-tailed distributions, the detection performance is in fact dominated by a single ob-servation within the i.i.d. observations available, namely the snapshot corresponding to the minimal texture value. To give an order of magnitude, for and the shape parameter of the distribution [respectively ] the average power of the minimal over texture values is 25 dB [respec-tively 38 dB] below the ensemble power of the distributed clutter. This shows that, with multiple i.i.d. observations, in-ternal white Gaussian noise has to be considered even for prac-tically observed input clutter to noise ratios.
Therefore, one should consider the problem of detecting a signal of interest in compound-Gaussian clutter and thermal Gaussian noise ( ):
(2) where stands for the clutter covariance matrix,
and the additive white noise is assumed to be Gaussian, i.e., . The disturbance covariance matrix is given by
(3) Unfortunately, one immediately faces the problem that the dis-tribution of the overall noise is unknown and, at this stage, it seems impossible to resort to a plain generalized likelihood ratio (GLR) approach.
As a preliminary attempt to cope with this problem, we adopt a common practice which consists in evaluating the sensitivity of known detectors to a mismatch or to uncertainties, see [16], [17] for example. More precisely, we consider the detector de-rived from problem (1) where we assumed that disturbance is composed of clutter only and thermal noise was neglected, and
we consider the “mirror” case where the disturbance is Gaussian and the problem is formulated as
(4) In both problems (1) and (4) we assume that is known: these frameworks can be viewed as the “extreme” cases of only and Gaussian only disturbance while (2) is a mixture of the two kinds of noise. Whatever the case, the second order statistics of the noise are known and the difference lies in their different distributions. We tackle the problem by first investigating the robustness of the detectors derived under one hypothesis when applied to the other statistical model. This enables one to give a hint about the ability of these detectors to perform well under a mixture of the two sources of noise. Then we evaluate, through numerical simulations, their performance when (2) is in force.
II. ROBUSTNESS TOEACHTYPE OFNOISE
In the sequel, and similarly to [15], we assume a Gamma distribution for , namely , so that, under , follows a distribution. Let . Under the assumption of known , an approximate log-likelihood ratio (LLR) test was derived in [15], given by
(5)
where
(6)
Interestingly enough, (5) coincides with the GLR obtained as-suming that the variables are deterministic and unknowns [11], while in [15] it was obtained from a large approx-imation of the modified Bessel function. On the other hand, for the classical problem in (4) the GLR is the matched filter, i.e.
(7)
The normalized matched filter (actually the non coherent inte-gration of the NMF for a single snapshot) is given by
(8)
Finally, in [15], we discovered that the test statistic in (5) is mostly influenced by the term corresponding to the minimal value of . Let be this snapshot and let us consider the hypothetical test statistic
(9) We first study the behavior of the detectors in (5)-(9) under . As was shown in [15] (except for which was not considered there), both for -distributed noise or Gaussian
dis-tributed noise, the distributions of , and are the same and given by
(10) (11)
(12)
Only has a different distribution under each assump-tion, namely
(13)
(14) where is the projection onto . For
, and , the same
threshold can be set to ensure a desired probability of false alarm for both noise distributions. Only can incur a variation of due to distribution mismatch. Indeed,
(15)
where corresponds to the threshold of to obtain the desired under Gaussian noise. Conditioned on , the random variable is a sum of
distributed random variables. Its distribution can be obtained but its expression is rather involved [18], [19]. Moreover, in our case, the scale parameters are random and then one needs a further marginalization, which appears a formidable task. Some insights can be gained for instance by considering the case
. Indeed, one has
(16)
where we made use of [20, 6.592.12]. Since for , , one obtains a direct relation between the actual and the designed . In the general case , one needs to resort to numerical evaluations but, as will be shown shortly, the ratio
between and
is approximately constant over . As an illustration, Fig. 1 dis-plays the actual of under -distributed noise. Clearly, this detector is not at all robust and a threshold cannot be set which guarantees approximately the same in distributed noise or in Gaussian noise.
Let us turn now to what happens under . Let us address first the situation where noise is -distributed. In this case, since
TABLE I
DISTRIBUTION OF , AND UNDER FOR THETWODETECTIONFRAMEWORKS
Fig. 1. Probability of false alarm of in distributed noise. Varying and . in Gaussian noise.
(17)
where . Furthermore,
(18)
from which we infer that
(19) (20)
(21)
where and
. These distributions are recapitulated in Table I. The case of Gaussian noise is obtained by simply setting in the above equations. Note that any com-pound-Gaussian distribution can be handled by an appropriate choice of the distribution of , and hence these expressions are
not restricted to -distributed noise. These novel stochastic representations have a double interest. First, even though they do not provide analytical formulas for the probability of de-tection, they allow for fast evaluation of from well-known scalar distributions. Moreover, they provide insights onto the influence of . Indeed, for the scaled invariant detectors and , appears only in the non-cen-trality parameter of the corresponding distribution. Therefore, the smaller the larger this non-centrality parameter and hence the greater its influence. This explains why, for very heavy-tailed distributions (for very small ), for which might be very small, the latter has a strong influence on the detection performance. On the other hand, for , appears both in the non-centrality parameter (through ) but also in the “weighting” of the distribution through : hence, there is a sort of balance, which means that the snapshot with minimal is not necessarily the most influential. In fact, we might expect that snapshots with large values of will have a strong impact.
III. PERFORMANCE IN AMIXTURE OF DISTRIBUTED AND
GAUSSIANNOISE
We now evaluate the performance of the detectors when applied to a mixture of -distributed and Gaussian noise. We consider the case of pulses and a moving target with Doppler frequency so that . The power of the -dis-tributed clutter is assumed to be one and hence . The clutter covariance matrix is and the clutter to white noise ratio is defined as . Since the probability of false alarm of cannot be controlled, while a single threshold can be set for the scale invariant detectors , ,
to ensure the same under either distributed noise or Gaussian noise, we consider only the three latter detectors from now on. For each of them, the threshold is set to obtain a under distributed noise only or Gaussian noise only equal to . In Fig. 2, we display the actual of all detectors (obtained from simulations) as a function of .
This figure is worthy of some observations. First, it should be noted that the actual probability of false alarm in Gaussian noise is less than the specified designed under the assump-tion of distributed noise only or Gaussian noise only. It seems that the two extreme cases are the worst cases and constitute an upper bound. For and the probability of false alarm first decreases, then can be 10 times lower than the for only or Gaussian only noise, and then re-increases to meet the designed . For , the actual can
Fig. 2. Mixture of -distributed clutter and Gaussian white noise. Probability
of false alarm of , and versus
. Designed under distributed noise only or Gaussian noise only is .
go to zero, at least among the simulations, none of them exceeded the threshold.
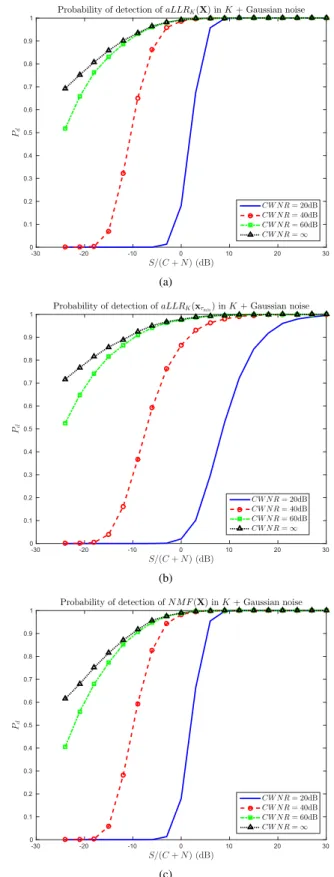
We now study the probability of detection in Fig. 3. sim-ulations were run to estimate . The fluctuating amplitude was generated from i.i.d. Gaussian variables with power and the signal to clutter and noise ratio is defined as
. As before, the thresholds of each detector are set to ensure a probability of false alarm under distributed noise only or Gaussian noise only equal to . Therefore, as illustrated in Fig. 2 the detectors do not operate at the same . However, the shown in Fig. 3 would be that obtained in practice where a threshold cannot be set based on the correct dis-tribution assumption. This figure shows that and perform nearly the same, with the former slightly better. The impact of including thermal noise is visible, espe-cially on : the latter departs from
when is about 20 to 40 dB. This indicates that when thermal noise is present, the snapshot with minimal does no longer prevail over all other snapshots.
IV. CONCLUSIONS
In this letter, we pursued further our analysis of the detectors derived in [15] under the assumption of distributed noise only. First, we analyzed their performance in distributed noise only or Gaussian noise only. New stochastic represen-tations for the test statistics under were obtained, which provided insights into the influence of the values of the textures . Then, we assessed the detectors under a mixture of and Gaussian noise. It was shown that the probability of false alarm obtained with the mixture was inferior to the probability of false alarm under only or Gaussian only noise. As for the probability of detection, it was shown that thermal noise has an impact even for moderate clutter to white noise ratio, and hence improvement of the detection schemes is worthy of further investigation. Furthermore, it was shown that, in the presence of thermal noise, the hypothetical detector that operates on the clairvoyantly selected snapshot with the minimal becomes inferior to the detector that uses all snapshots, after the number
Fig. 3. Probability of detection of , and
versus . , and designed under
distributed noise only or Gaussian noise only is .
of independent observations grows above a certain value specified by the CWNR. It is expected that in this case, in order to be as efficient as the detector which uses all snapshots, one could resort to a detector that would somehow select only samples with values below WGN power.
REFERENCES
[1] C. J. Baker, “Coherent K-distributed sea clutter,” Proc. Inst. Elect. Eng., Radar, Sonar Navig., vol. 138, no. 2, pp. 89–92, Apr. 1991. [2] J. B. Billingsley, A. Farina, F. Gini, M. V. Greco, and L. Verrazzani,
“Statistical analyses of measured radar ground clutter data,” IEEE Trans. Aerosp. Electron. Syst., vol. 35, no. 2, pp. 579–593, Apr. 1999. [3] E. Conte, A. De Maio, and C. Galdi, “Statistical analysis of real clutter at different range resolutions,” IEEE Trans. Aerosp. Electron. Syst., vol. 40, no. 3, pp. 903–918, Jul. 2004.
[4] E. Conte, A. De Maio, and A. Farina, “Statistical tests for higher order analysis of radar clutter - Their analysis to L-band measured data,” IEEE Trans. Aerosp. Electron. Syst., vol. 41, no. 1, pp. 205–218, Jan. 2005.
[5] K. D. Ward, R. J. A. Tough, and S. Watts, Sea Clutter: Scattering, the K Distribution and Radar Performance, ser. IET Radar, Sonar and Nav-igation Series 20. Stevenage, U.K.: IET, 2006.
[6] E. Conte and M. Longo, “Characterisation of radar clutter as a spheri-cally invariant process,” Proc. Inst. Elect. Eng., Radar, Sonar Navig., vol. 134, no. 2, pp. 191–197, Apr. 1987.
[7] M. Rangaswamy, “Spherically invariant random processes for mod-eling non-gaussian radar clutter,” in Proc. 27th Asilomar Conf., Pacific Grove, CA, USA, Nov. 1–3, 1993, pp. 1106–1110.
[8] E. Conte, M. Longo, M. Lops, and S. L. Ullo, “Radar detection of signals with unknwon parameters in K-distributed clutter,” Proc. Inst. Elect. Eng. F, vol. 138, no. 2, pp. 131–138, Apr. 1991.
[9] K. J. Sangston and K. R. Gerlach, “Coherent detection of radar targets in a non-gaussian background,” IEEE Trans. Aerosp. Electron. Syst., vol. 30, no. 2, pp. 330–340, Apr. 1994.
[10] E. Conte, M. Lops, and G. Ricci, “Asymptotically optimum radar de-tection in compound-gaussian clutter,” IEEE Trans. Aerosp. Electron. Syst., vol. 31, no. 2, pp. 617–625, Apr. 1995.
[11] K. Gerlach, “Spatially distributed target detection in non-gaussian clutter,” IEEE Trans. Aerosp. Electron. Syst., vol. 35, no. 3, pp. 926–934, Jul. 1999.
[12] K. J. Sangston, F. Gini, M. S. Greco, and A. Farina, “Structures for radar detection in compound-gaussian clutter,” IEEE Trans. Aerosp. Electron. Syst., vol. 35, no. 2, pp. 445–458, Apr. 1999.
[13] E. Conte, A. De Maio, and G. Ricci, “CFAR detection of distributed targets in non-gaussian disturbance,” IEEE Trans. Aerosp. Electron. Syst., vol. 38, no. 2, pp. 612–621, Apr. 2002.
[14] K. J. Sangston, F. Gini, and M. S. Greco, “Coherent radar target detec-tion in heavy-tailed compound-gaussian clutter,” IEEE Trans. Aerosp. Electron. Syst., vol. 48, no. 1, pp. 64–77, Jan. 2012.
[15] Y. Abramovich and O. Besson, “Fluctuating target detection in fluc-tuating -distributed clutter,” IEEE Signal Process. Lett., vol. 22, no. 10, pp. 1791–1795, Oct. 2015.
[16] E. Conte and G. Ricci, “Sensitivity study of GLRT detection in com-pound-gaussian clutter,” IEEE Trans. Aerosp. Electron. Syst., vol. 34, no. 1, pp. 308–316, Jan. 1998.
[17] A. De Maio, G. Foglia, E. Conte, and A. Farina, “CFAR behavior of adaptive detectors: An experimental analysis,” IEEE Trans. Aerosp. Electron. Syst., vol. 41, no. 1, pp. 233–251, Jan. 2005.
[18] A. M. Mathai, “Storage capacity of a dam with gamma type inputs,” Ann. Inst. Statist. Math., vol. 34, pp. 591–597, Dec. 1982.
[19] P. G. Moschopoulos, “The distribution of the sum of independent gamma random variables,” Ann. Inst. Statist. Math., vol. 37, pp. 541–544, Dec. 1985.
[20] I. S. Gradshteyn and I. M. Ryzhik, Table of Integrals, Series and Prod-ucts, A. Jeffrey, Ed., 5th ed. New York, NY, USA: Academic, 1994.