HAL Id: tel-00828116
https://tel.archives-ouvertes.fr/tel-00828116
Submitted on 30 May 2013HAL is a multi-disciplinary open access archive for the deposit and dissemination of sci-entific research documents, whether they are pub-lished or not. The documents may come from teaching and research institutions in France or abroad, or from public or private research centers.
L’archive ouverte pluridisciplinaire HAL, est destinée au dépôt et à la diffusion de documents scientifiques de niveau recherche, publiés ou non, émanant des établissements d’enseignement et de recherche français ou étrangers, des laboratoires publics ou privés.
Advances of full-field optical coherence tomography
(FFOCT) for clinical applications and developmental
biology
Adriano Burcheri-Curatolo
To cite this version:
Adriano Burcheri-Curatolo. Advances of full-field optical coherence tomography (FFOCT) for clinical applications and developmental biology. Optics [physics.optics]. Université Pierre et Marie Curie -Paris VI, 2012. English. �NNT : 2012PA066172�. �tel-00828116�
THÈSE
pour l'obtention du grade de
Docteur en Sciences
de l'Université Pierre et Marie Curie – Paris 6
Mention : Optique Biomédicale
présentée par
Adriano CURATOLO
Usage: BURCHERI-CURATOLO
AVANCÉES EN TOMOGRAPHIE OPTIQUE PLEIN CHAMP POUR APPLICATIONS CLINIQUES ET BIOLOGIE DU DÉVELOPPEMENT
École Doctorale : La Physique de la Particule à la Matière Condensée (ED389) Laboratoire d’accueil : Institut Langevin – ESPCI ParisTech
Soutenance prévue le 9 Juillet 2012 devant le jury composé de :
Mme BOURG-HECKLY, Geneviève Examinateur
Mme DEUMIÉ, Carole Rapporteur
Mme LAPLACE-BUILHÉ, Corinne Examinateur
M. BOCCARA, Claude Directeur de Thèse
M. FORGET, Benoît Examinateur
THÈSE
pour l'obtention du grade de
Docteur en Sciences
de l'Université Pierre et Marie Curie – Paris 6
Mention : Optique Biomédicale
présentée par
Adriano CURATOLO
Usage : BURCHERI-CURATOLO
ADVANCES OF FULL-FIELD OPTICAL COHERENCE TOMOGRAPHY (FFOCT) FOR CLINICAL APPLICATIONS AND DEVELOPMENTAL BIOLOGY
École Doctorale : La Physique de la Particule à la Matière Condensée (ED389) Laboratoire d’accueil : Institut Langevin – ESPCI ParisTech
Soutenance prévue le 9 Juillet 2012 devant le jury composé de :
Mme BOURG-HECKLY, Geneviève Examinateur
Mme DEUMIÉ, Carole Rapporteur
Mme LAPLACE-BUILHÉ, Corinne Examinateur
M. BOCCARA, Claude Directeur de Thèse
M. Forget, Benoît Examinateur
Acknowledgments
I would like to thank Pr. Claude Boccara, my thesis supervisor, for his patience and relentless energy as a researcher. It has been a great opportunity to work on this project and this thesis has greatly benefited from his continuous guidance and insight into full-field optical coherence tomography. I would also like to thank LLTech's director and founder, Bertrand De Poly, for his generosity and for making available resources during the clinical studies and collaborations of this work.
The contribution of several members of LLTech team must also be appropriately acknowledged. I am thankful to Sylvie Nadolny whose help and collaboration on the equipments made possible the imaging results of this work; to Charles Brossolet who has been instrumental in all the software related issues; and finally Eugénie Dalimier, Fabrice Harms and Franck Martins for their help and technical expertise, but also for their enthusiasm and sense of humour so much appreciated.
From ESPCI ParisTech, I would like to acknowledge the work of several people. In particular, Osnath Assayag, whose active collaboration in the clinical studies was critical; Anne Latrive, a PhD colleague, whose delicious cooking will be remembered; and Florian Poisson, a graduate student, who carried out performance measurements of the instrument.
Clinical work was performed with the precious help of two clinicians. Dr. Brigitte Sigal-Zafrani from Institut Curie and Dr. Martine Antoine from Tenon hospital in Paris who made possible the collection of specimens in the pathology laboratory and the diagnostic evaluation of both tomographic images and corresponding histology. Likewise, Dr. Vincent Servois, radiologist was instrumental in facilitating the needle biopsy study within the imaging unit at Institut Curie. In addition, I acknowledge the work of Eolia Flandre and Dr.Jeanine Quillard for histology slides scanning.
From the ESPCI Laboratory of Neurobiology, I wish to acknowledge the support of Serge Birman and the continuous efforts of Thomas Riemensperger for our collaboration on the challenging experiment with living fruit flies.
I was fortunate to work within the Institut Langevin, which has provided an enriching environment with outstanding scientists. I would like to thank Gianmarco Pinton for his help with phantoms and programming, Mathieu Pernot for his contacts in pathology laboratories; Corinne, Olivier, Rémy and many others for thoughtful discussions; and Julie Delahaye for the opportunity of teaching laboratory classes at Ecole Centrale, Paris.
Amongst the many others who contributed to the success of this thesis, I wish to particularly thank my parents for providing the grounds and support for my education.
Optical coherence tomography (OCT) is now an established technique for visualizing the internal morphology of the eye. In the last decade, the aim has been to achieve similar results in highly scattering tissues. One limitation of previous studies with OCT has been the low resolution compared to the gold standard of histology. Full-field optical coherence tomography (FFOCT), a variant of OCT also based on low-coherence interferometry, generates micron-scale images over a large field of view by simply using a camera as an array detector and a tungsten-halogen light source.
In this work, a compact FFOCT system has been tested under clinical conditions for imaging breast lesions up to 1 cm² as well as core-needle biopsies. A set of diagnostic criteria have been identified to differentiate benign from malignant tissues with encouraging preliminary results, nonetheless endogenous contrast enhancements are necessary. Attenuation maps were shown to be limited by the high heterogeneity of tissues within only a few micron depth. An alternative approach, based on the elastic properties of tissues, has been demonstrated to be feasible and could hold greater prospects. In addition, the penetration depth of the instrument has been improved by a minimum of a factor two with an InGaAs camera system operating in the infrared region and using silicone oil as immersion medium.
Finally, three-dimensional imaging in-vivo was demonstrated during the 4 days of metamorphosis of a Drosophila melanogaster. The FFOCT system was able to record each organ growth at a depth of 80 µm with an isotropic micron resolution. This marks progress toward potential applications in developmental biology.
Résumé
La tomographie optique cohérente (OCT) est maintenant une technique établie permettant de visualiser la morphologie interne de l’œil. Au cours de la dernière décennie, l'objectif a été d'atteindre des résultats similaires dans des tissus fortement diffusants. Une limite des études précédentes en OCT s'avère être la faible résolution en comparaison des techniques d'histologie traditionnelle. La tomographie optique cohérente plein-champ (FFOCT), une variante de l'OCT également basée sur l'interférométrie en lumière faiblement cohérente, produit des images à l'échelle du micron sur un large champ de vue en utilisant une simple camera et une lampe à incandescence halogène pour l'illumination.
Dans ce manuscrit, un système FFOCT compact a été testé en conditions cliniques afin d'examiner de larges lésions mammaires, jusqu'à 1 cm², ainsi que des microbiopsies. Un ensemble de critères diagnostics ont pu être identifiés pour différencier tissus bénins de malins, avec des premiers résultats encourageants; toutefois des méthodes d'améliorations du contraste endogène s'avèrent nécessaires. Une méthodologie basée sur les coefficients d'atténuation du flux lumineux s'est montré limitée du fait de la forte hétérogénéité des tissus sur une profondeur de quelques microns. La faisabilité d'une approche alternative, exploitant les propriétés élastiques des lésions cancéreuses, a été réalisée et offre de meilleures perspectives. En outre, la profondeur de pénétration de la technique a pu être améliorée au moyen d'un système utilisant une caméra InGaAs opérant dans l'infrarouge et d'une huile de silicone en tant que liquide d'immersion.
Finalement, l'imagerie tridimensionnelle in-vivo a été démontrée pendant les 4 jours de la métamorphose de Drosophila melanogaster. Le dispositif d'OCT plein champ a ainsi pu suivre la croissance de chaque organe à une profondeur de près de 80 µm avec une résolution isotrope à l'échelle du micron, ouvrant ainsi des perspectives d'applications en biologie du développement.
Mots-clés : FFOCT, Tomographie, Cancer du Sein, Atténuation, Élasticité, Biologie du
Acknowledgments... v
Abstract ... vi
Résumé ... vii
Introduction...1
Chapter I. Principles and context of OCT imaging in biological tissues...3
I.1 Conventional OCT and biomedical imaging context ...3
I.1.1 OCT versus other imaging modalities...3
I.1.2 Principles of traditional OCT ...5
Overview... 5
Time-domain OCT ...6
Fourier or Frequency-domain OCT ...7
Comparative advantages of OCT systems...8
I.1.3 Performances of conventional OCT ...8
I.1.4 Selected applications...9
I.1.5 Conclusion... 9
I.2 Optical properties of biological tissues ...10
I.2.1 Light – tissue interaction...10
Absorption, therapeutic window and wavelength dependence...10
Scattering mechanisms in tissues...11
Geometrical optics approximation: ...13
The Mie solution to Maxwell's equations: ...13
The Rayleigh solution to Maxwell's equations: ...14
I.2.2 Conclusion...15
References... 16
Chapter II. Full-Field OCT system: design principles and performance ...23
II.1 Full-field OCT: basic principles...24
II.1.1 Description of the FF-OCT setup...24
II.1.2 Temporal low-coherence and slice sectioning in FFOCT...25
II.1.3 Image acquisition method...26
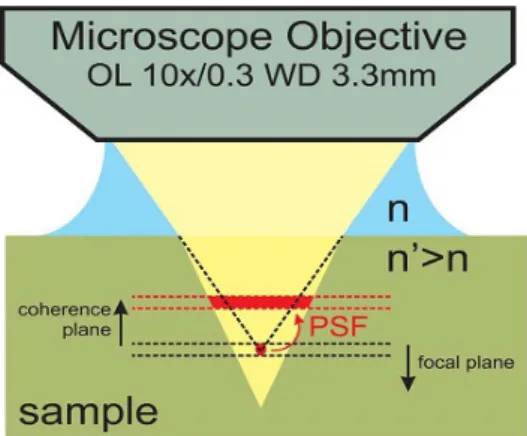
II.1.4 Tomography and coherence plane dynamic adjustment...28
II.2 System performance: spatial resolution...30
II.3 Compact clinical setup...31
II.4 Conclusion...33
References... 34
Chapter III. Breast ex-vivo imaging: from laboratory to clinical setting...37
III.1 Large field imaging of ex-vivo breast tissues...37
III.1.1 Background... 37
III.1.2 Material and method...39
Study design and imaging protocol...39
Specimen selection and preparation...39
Instrument ... 40
Data analysis... 40
III.1.3 Results ... 41
III.2 Core-needle biopsy study...48
III.2.1 Background... 48
III.2.2 Method and protocol...49
III.2.3 Results... 50
Other organ: kidney lesion...53
III.3 Discussion and Conclusion...55
References... 57
Chapter IV. Contrast enhancement strategies: assessment and validation....61
IV.1 Assessment of mapping optical attenuation coefficients in breast tissues...61
IV.1.1 Context and background ...61
IV.1.2 Material and methods ...63
Specimen selection and instrument...63
Scattering coefficient analysis...64
Image acquisition and processing...65
IV.1.3 Results... 65
IV.1.4 Discussion... 67
IV.2 Feasibility of an experimental setup to measure the static elastic properties of a breast tissue...68
IV.2.1 Background and context...68
IV.2.3 Results... 70
IV.2.4 Discussion... 71
IV.2.5 Conclusion...72
References... 73
Chapter V. Advances in biology: in-vivo imaging of Drosophila melanogaster ...77
V.1 Background...77
Drosophila melanogaster model...79
V.2 Material and method ...81
Instrument...81
Image acquisition...81
Pupa preparation...81
Major steps of the pupal phase...82
V.3 Results ...84
Adult fruit fly ...88
V.4 Discussion ...90
V.5 Conclusion...90
References... 91
Chapter VI. Infrared Full-Field OCT and penetration depth improvement...93
VI.1 InGaAs FFOCT setup...94
VI.1.1 Background and objectives...94
VI.1.2 Material and method ...94
Infrared system...95
Si camera system...96
VI.1.3 Performance comparison...96
VI.2 Penetration depth assessment in biological tissues...100
VI.2.1 Background... 100
VI.2.2 Material and method...101
FFOCT system...101
Specimen properties...101
VI.2.3 Results... 102
Images comparison...102
VI.2.4 Discussion ... 103
VI.3 Conclusion...104
References... 105
General Conclusion...107
Future perspectives...108
Annexe: Résumé en Français...111
Contexte et problématique...111
Principes et État de l'art en OCT dans les milieux biologiques...112
Dispositifs d'OCT « plein-champ »...113
Etudes cliniques sur lésions mammaires et biopsies...116
Pistes d'amélioration du contraste endogène...118
Avancées en biologie : imagerie in-vivo du cycle d'une métamorphose...120
Introduction
One of the core purpose of the art and science of medicine can be formulated in simple terms: “first, do not harm”. A whole new branch of medicine has been set up around the central idea of avoiding invasive surgical procedures. At first, with the broader use of X-rays, medical imaging has long been focused on obtaining a visual result and less concerned with its hazardous consequences over the long term1. Gradually, with the development of novel techniques such as magnetic resonance imaging (MRI) and miniaturized components, less invasive approaches were made possible.
In that context, light-based imaging appears as the natural continuity of this process; towards limited side effects and higher resolution. In the last three decades, it has led to an increasing number of optical methods in clinical medicine including, for example, fluorescence techniques, non-linear optical imaging (e.g. multiphoton microscopy,...) or ultra-high resolution techniques (4pi or structured illumination microscopy,...). Within the setting of this larger revolution in optical imaging, optical coherence tomography (OCT) has emerged since the early 90's as a versatile but powerful method. Several variants have been proposed, all based on the core principle of interferometric microscopy. FFOCT for Full-field Optical Coherence Tomography is one of these variants, with the difference of producing “en-face” images without the need for scanning a beam over the field of view by using a camera as an array detector and a simple tungsten-halogen light source.
The underlying idea is to emulate the time-tested gold standard methods of histopathology and to provide a valid diagnostic complement. Compared to other high-resolution microscopy techniques, FFOCT's main benefit is to be able to image subsurface biological specimen over a large area of up to 1 cm2 with an isotropic micron-scale resolution; and without the need for staining or external contrast agents. The instrument initially conceived and developed at the ESPCI2 laboratory has been further expanded by the laboratory spin-up LLTech in the past 3 years. This work has been performed in close collaboration with the engineering team of LLTech, researchers from Institut Langevin, ESPCI and clinicians.
1 It is more a demographic issue than an individual one – as far as adult patients are concerned [1]. 2 ESPCI stands for Ecole Supérieure de Physique et Chimie Industrielles de la ville de Paris.
Statement of work
The aims of this thesis were to fully explore the clinical and research applications of the technique and to demonstrate the validity or non-validity of its technological improvements under the constraint of a realistic implementation in clinic and to propose innovative approaches towards that direction.
The written thesis in composed of six individual chapters. Chapter 1 introduces the biomedical context of this work in relation to other imaging techniques, and in particular the parent technique of conventional OCT. The second part of the chapter frames the basic theoretical tools to understand the interaction of light with biological tissues. Chapter 2 presents the compact setup used in this work with a focus on the new fine adjustments implemented to obtain the most resolved and contrasted images for a potential use in clinical routine.
However, a medical image is only as good as its ability to be interpreted by a clinician. An important focus of this thesis has been to initiate the long process of novel images interpretation. In particular, breast lesions for the medical aspects of this work (Chapter 3), and in biology, the in-vivo organogenesis of Drosophila melanogaster (Chapter 5).
Novel contrast techniques have been examined in an attempt to quantitatively assess these novel images. Chapter 4 investigates a method based on attenuation maps and its major limitation; the second part demonstrates the feasibility of a new full-field optical elastography method and identifies several pitfalls for further investigation.
Finally, the last chapter compares and demonstrates the performance of a novel FFOCT instrument in the near-infrared region aimed at increasing the penetration depth achieved with a particular interest on the nature of photons in highly scattering biological tissues.
The general conclusion provides a brief summary of results and an overall discussion on the methodology as well as perspectives for future studies.
Chapter I. Principles and context of OCT imaging
in biological tissues.
This chapter briefly presents the basic principles of Optical Coherence Tomography (OCT) and compares the two major OCT techniques: Time-domain OCT (TD-OCT) and Fourier-Domain OCT (FD-OCT). A review of the current literature and perspectives in OCT are also discussed. In a second section, the theoretical tools used to analyse the interaction of light with biological tissues is detailed.
I.1 Conventional OCT and biomedical imaging
context
I.1.1 OCT versus other imaging modalities
There are several ways to differentiate optical imaging techniques. One is based on the source of contrast as the determining criteria. OCT and FFOCT or Full-field Optical Coherence Tomography can be qualified as an endogenous anatomical imaging method in contrast to exogenous approaches. By exogenous, one implies a method that requires the addition of molecular agents to characterize a particular tissue or a cellular mechanism (e.g. fluorescence microscopy or immunohistology techniques). In contrast, the endogenous approach solely relies on the optical properties of the tissue under investigation, such as differences in refractive indexes or scattering variations and, to a lower extent, differences in absorption.
Other non-invasive endogenous anatomical imaging techniques rely on radically different principles, such as magnetic resonance imaging (MRI) or computed tomography (CT). Their extensive use in clinical settings is essentially due to the penetration depth achieved when the need for a micron-scale resolution is not deemed necessary. In comparison, microscopic techniques
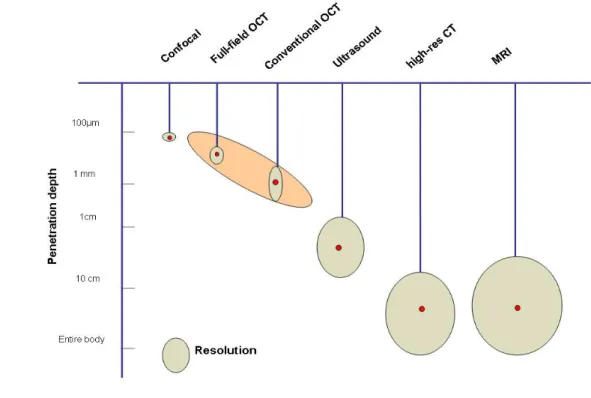
(FFOCT included) can achieve resolutions 10 to 100 times greater than these methods. Figure I.1 presents an overview of the most common biomedical imaging techniques with corresponding resolution and penetration depth.
As shown, optical coherence tomography (OCT and FFOCT) fills a gap in medical imaging techniques. Ultrasound can achieve a penetration depth of several centimetres with the restriction of low resolution (high frequency ultrasound still limited to a 50 µm resolution); and on the other end confocal microscopy with high resolution but shallow imaging depth (~100 µm). OCT and confocal microscopy are however different in many respects as detailed further in this chapter.
Confocal fluorescence microscopy is now a well-established method in research and is extensively used for ex-vivo cellular imaging, living cells, and even 3-D study of cell dynamics [3–6]. Its use in clinical settings has nonetheless been limited for several reasons. The need for intravenous and topically applied stains with potential toxicity have thus not yet been widely accepted. Other limitations include photo-bleaching of fluorescent probes and limited penetration depth. Image contrast is significantly reduced after 100 µm in depth. Since low numerical aperture objectives are commonly used, the limited field of view makes difficult to image large clinical samples (< 1 cm²). Photodamage remains a critical issue in most applications when fluorescent staining is required.
Alternative microscopic techniques address to some extent those limitations. Multiphoton microscopy has been shown to perform imaging on unstained tissues. Although to date most multiphoton microscopy has used with conventional fluorescent proteins or other fluorophores, a
Figure I.1: Schematic representation of the resolution and penetration depth in common imaging modalities.
Principles and context of OCT imaging in biological tissues. few studies have successfully tested intrinsic molecule contrast. For example NAD(P)H and flavins with two-photon excitation [7–9], or second-harmonic generation (SGH) of retina pigment epithelial cells (mostly collagen) or muscle fibres [10–12].
Reflectance confocal microscopy is another technique that can be performed without the need for molecular staining agents. It uses the endogenous contrast provided by tissue heterogeneity. This technique has been developed by Dr. Rajadhyaksha's group at Memorial Sloan-Kettering, NYC, with a particular focus on skin lesions. They performed nuclear and cellular morphology images in large areas of surgically excised tissues [13], [14]. Confocal reflectance microscopy has also been applied to ex-vivo breast lesions and small-animal models [15], [16]. Although contrast enhancers such as acetic acid or aluminium chloride (AlCl3) are routinely used, those results are promising to establish correlation tests with gold standard histology. This technique allows the imaging of large field of views with the implementation of rapid mosaicing or stitching of individual tiles. This approach can thus be performed in-vivo but remains limited to more accessible body areas (e.g. forearms or the abdomen).
I.1.2 Principles of traditional OCT
Overview
Optical Coherence Tomography can be compared to an optical analogue of B-mode ultrasound3. As for sound waves, light is echoed back with a time delay depending on the tissue structure being probed [17]. For ultrasound, the velocity of sound is well within the limits of electronic detectors, for light however, it requires a temporal resolution of the order of femtoseconds. Presently, no detector is able to directly measure such ultra-fast oscillations. In OCT, the echo delay is measured via an interferometric technique whereby the slight difference between the light coming from the specimen and light back-reflected from a reference mirror generates an interference at each pixel on the detector.
OCT principle is thus based on low-coherence interferometry and its most common configuration is a Michelson interferometer [18–20]. Typically, the incident light beam is split into two identical beams by a reference mirror. One beam is directed to the tissue sample and the other focused onto a reference arm. Each of these beams will travel an “approximately” similar distance within the coherence length before recombining at the beam splitter.
Therefore, interferences only occur when the distance travelled in both arms is lower than the coherence length of the light source. The aim is to use sources with spectrum as large as possible in order to obtain the shortest coherence length. Polychromatic light sources are particularly well suited and have a sectioning ability of a few microns. Typical broadband light sources used in OCT
are superluminescent diodes, superbright LEDs, or a simple white light source. Alternatively, laser with extremely short pulses can also achieve a broad bandwidth (e.g. femtosecond lasers). A particularity and advantage of OCT is the decoupling of axial and lateral resolution. The z-axis resolution is directly correlated to the coherence length of the light source and along the x-,y- axis it is imposed by the optics. In this work, any reference to traditional or conventional OCT imaging refers to the following imaging techniques.
Time-domain OCT
This is the method used in this work whereby the mechanism of OCT interferometry relies upon the displacement of the reference arm. This mechanical translation fulfils two purposes: to probe the sample in depth and to generate a Doppler shift. To obtain a 2-D or 3-D image (sum of A-scans), the sample is still raster-scanned laterally (x-,y- axis) to display series of cross sections over time as shown on figure I.2. This approach is now commonly referred to time domain OCT in the literature [19], [21–24].
This method of acquisition was first applied to retinal imaging by a group at MIT led by Pr. Fujimoto and published in the landmark paper of OCT in 1991[25]. However, the first biological application of time-domain low-coherence interferometry was demonstrated by Fercher et al. three years earlier in 1988 in a publication entitled "Eye-length measurement by interferometry with
Figure I.2: Schematic of conventional OCT – Time-Domain acquisition mode. A-scan or Axial-scan obtained is directly related to the tissue internal optical variations. Adapted from [82]
Principles and context of OCT imaging in biological tissues. partially coherent light”. Time-domain OCT has initially known a fast commercial development in ophthalmology before being replaced by a Fourier-domain approach.
Fourier or Frequency-domain OCT
It was then shown that solely extracting the individual frequency components could be sufficient. The initial image could be directly reconstructed by Fourier transform from the spectrum of the interference signal without any mechanical displacement. For a fixed reference arm, a specific frequency is generated in the interference spectrum. Put simply, the single interference signal is analysed by wavelength and results in a spectral interferogram as shown in the diagram of
figure I.3.
From the resulting frequency map, the position of each extracted intensity maxima informs about the depth of the different back-scattering structures and the amplitude about their respective coefficient of reflection.
Recent developments in Frequency or Fourier Domain OCT have demonstrated novel variants with spectrometer-based detections or wavelength-swept laser sources [26–29]. For the latter, a range of different wavelengths are emitted over time and a frequency difference will depend on the position of the structures and thus producing distinct modulation periods. While this process achieves gain in signal-to-noise ratio, nonlinearities in the wavelength and aliasing artefacts are still present as in Time-Domain OCT.
Figure I.3: Schematic of Fourier or Frequency Domain OCT image acquisition (FDOCT). BS: beam splitter. Specimen: human retina. Adapted from [81].
Comparative advantages of OCT systems
The major advantage of the frequency approach is the gain in time (or signal-to-noise ratio for a fixed time) since the acquisition of each layer is made simultaneously and no mechanical displacement is required (i.e. reference arm and mirror are fixed). The acquisition time gain is significant and of the order of 20–30 times faster than Time-Domain OCT (e.g 10,000 vs >200,000 depth scans/sec). In addition, FDOCT has also demonstrated larger sensitivity advantage of the order of 20–30 dB over TDOCT for a similar acquisition time [30], [31]
For those reasons, Fourier-Domain OCT has become the commercial method of choice for clinical applications. For example, Zeiss® Cirrus OCT for ophtalmology, Volcano® for cardiology or Michelsons Diagnostics® in dermatology. Nonetheless, time-domain commercial equipments claim some advantages in contrast to noise ratio in comparison to Fourier-domain and FDA-approved systems are now been used on patients (e.g. Lightlab Imaging/ St Jude Medical®).
I.1.3 Performances of conventional OCT
In contrast to other optical techniques (e.g. confocal microscopy), the axial resolution achieved is independent of the numerical aperture (NA). Resolution in depth is directly determined by the source coherence length which determines the full-width half maximum of the interferogram (i.e. signal envelope). Standard axial resolution achieved are now around 7-10 µm, and by using novel generation femtosecond lasers, ultra-high axial resolutions of 2-3 µm have been demonstrated [32], [33].
Penetration depth is, with axial resolution decorrelation, a major difference and advantage of OCT imaging in comparison to traditional microscopic or confocal techniques. Principal wavelength ranges used are centred around 800 nm and 1300 nm (see chapter on the
near-infrared setup and next section on light-tissue interaction for more details). Typical penetration
depth at 1300 nm wavelength with small numerical aperture is around 1–2 mm before loss of useful single backscattered signal. In practice, the valuable penetration depth is rather 0.5–1 mm due to a rapid increase of incoherent light collected (i.e. multi-scattered photons overshooting ballistic ones).
Transverse resolution, as with conventional microscopy, is mainly dictated by the objective numerical aperture. For deep cross-sectional imaging, a large depth of field is required and thus low numerical aperture objectives are used. This highly limits the transverse or lateral resolution to the order of 10 µm. Unless a dynamic focusing is applied, but slows down the acquisition process, the depth of field must be approximately equal to the axial depth scan (e.g. 15 µm lateral resolution corresponds to about 0.8 mm depth of field).
Principles and context of OCT imaging in biological tissues.
I.1.4 Selected applications
Optical coherence tomography is now an established medical imaging technique. Its initial and most extensive use is in ophthalmology, in particular to image the back of the eye or the retina. It allows for example, the assessment of axonal integrity in multiple sclerosis or to measure changes in retinal nerve fibre layer as indication of treatment outcomes [34–38].
Another major application is in-vivo endoscopic OCT, in particular for coronary arteries defects or lesions of the upper-aerodigestive tract. For vascular diseases, OCT has been investigated to detect vulnerable lipid-rich plaques since OCT can achieve high penetration depth underneath the epithelial layer [39–43]. Likewise, suspicious lesions of the oral cavity could be potentially detected early or follow-up progress more precisely monitored in conditions such as Barrett's oesophagus [44–50].
Cancer detection and tumour margin assessment are also a major focus of research, and techniques are now entering the stage of sensitivity and specificity measurements in comparison to the gold standard of histology. Organs mostly tested ex-vivo include skin, breast and breast lymph nodes [51–57].
The addition of new contrasts, endogenous or exogenous (e.g. nanoparticles, optical elastography), multi-modality combinations (e.g. OCT and multiphoton microscopy or fluorescence) and functional imaging are progressively appearing as the most active areas of research in OCT [58–63]. A variety of non-medical applications can be found in the literature. However, the most predominant fields of study are in art restoration and archaeology [64–72].
I.1.5 Conclusion
This brief overview of OCT, the parent technique of FFOCT highlights its potential forfilling in a gap between ultrasound and confocal microscopy in terms of resolution and penetration depth. The principles of the two main approaches have been described and it is important to note that FFOCT is based on a time-domain approach.
I.2 Optical properties of biological tissues
Improving light's penetration through turbid media with minimum loss of resolution is an essential goal in biomedical optics. Several limiting factors due to the nature of a biological tissue and its interaction with light are presented along with notations used.
I.2.1 Light – tissue interaction.
Tissue heterogeneity constitutes a major challenge in the tomographic imaging of a biological tissue. This heterogeneity also provides a characteristic information that can be optically extracted. Such properties are as much related to the specific absorption and scattering at a macroscopic level (tissue refractive index inhomogeneities) than the individual cell's constituents at a microscopic level. In addition, visible and near-infrared wavelengths regions provide the advantage of being non-ionizing and potentially extremely fast.
However, those properties and heterogeneities are also major limitations for achieving sufficiently resolved images at a given optical plane underneath the surface. The difficulty of several microscopic techniques is therefore to extract the signal from the optically sliced plane and filtering out unwanted information from surrounding layers. In this process, photons undergo several interactions that alter and attenuate the signal detection from a particular plane. When an incident light wave interacts with a single particle, part of its energy is absorbed and another part scattered.
Both phenomenon follow a similar mechanism, in that sense that energy is removed from a beam of light traversing a medium: here the beam is attenuated by the biological tissue. As commonly used, the attenuation µt is defined as the sum of scattering and absorption (µt = µs + µa ). Nonetheless, for biological tissues, scattering has been extensively shown to constitute the major limiting factor [73], [74].
Absorption, therapeutic window and wavelength dependence.
This work explores two different wavelength regions with significant differences in terms of light absorption and consequently penetration depth. The first FFOCT system is centred around 715 nm in the visible wavelength portion of the spectrum and a full width half maximum (FWHM) of approximately 125 nm. The second setup operates in the near infra-red with a central peak around 1225 nm and FWHM of 600 nm.
The absorption phenomenon is due to the fact that part of the incident energy emitted by a source of illumination is not scattered but transferred into an other form of energy such as thermal
Principles and context of OCT imaging in biological tissues. energy. An absorption coefficient, µa can be defined as the probability of incident light absorbed by tissue per unit length [cm-1 or mm-1 ]. This macroscopic coefficient is due to the vibration and
change of electron states in response to light. When a collimated plane wave propagates in a homogeneous medium with only absorption without any scattering, with a length, L, the intensity variation as function of the pathlength is given by the Beer-Lambert's law (valid in a homogeneous medium):
I
t=
I
0e
−µa. L (1)with I0 the incident light's intensity and I the signal intensity collected at the detector and µa the absorption factor.
In biological tissues, three main molecules are responsible for the absorption of light: haemoglobin, water and melanin. Their respective absorption spectra define a window of low absorption of light and it is known as the optical therapeutic window. As shown on figure I.4, this window extends from 0.6 µm to 1.3 µm. Below 0.6 µm, blood is the principal absorber and water from 1.3 µm onwards towards higher wavelengths.
Absorption only contributes to a fraction of photons loss at the detector but increases with higher wavelength. For deep red or near-infrared light, it only constitutes a negligible factor compared to scattering effects in a biological tissue. The other light attenuation phenomenon, scattering, being therefore predominant.
Scattering mechanisms in tissues.
For biological tissues, and breast tissues in particular, scattering accounts for 10 to 100 times more than absorption to the attenuation of incident light [73]. As for absorption, the scattering properties of a medium can be described by µs., the scattering coefficient. It can also be shown that
Figure I.4: Absorption spectra of the main constituent of tissues in the visible and near-infrared, namely oxy-haemoglobin (HbO2), deoxy-haemoglobin (Hb), and water (H2O). The spectra are obtained from compiled absorption data for water and haemoglobin.
the reciprocal of the scattering coefficient 1/µs or the mean free path which defines the mean distance between scattering events. This mean distance is of the order of 10 to 100 µm in biological tissues.
Light scattering is simply another description for the propagation of an electromagnetic wave in matter. When a wave is propagating in a medium, its electric field excite electron clouds
from its constituent atoms and molecules. In tissues, it can be postulated that when an electromagnetic wave interacts with tissue constituents (e.g. a cell's nuclei, mitochondria or haemoglobin molecules), particles induced dipoles or multipoles oscillate with the frequency of the incident light wave. Electromagnetic energy is therefore re-emitted and its resulting intensity is therefore the coherent superposition of each individual sources and therefore its angular distribution depends upon the size, shape and gradient index of those tiny scatterers. When a collimated plane wave propagates in a non-absorbing homogeneous medium of length, L and filled with scattering particles, the exponential decrease of the collimated light's intensity that is traversing the medium is also given by the Beer-Lambert law, such that:
I
τ=
I
0e
−µs. L (2)where µa is the scattering coefficient in [cm-1 or mm-1], where It is the incident light or non-scattererd component of light after traversing a non-absorbing medium of thickness L.
In a tissue, light interacts with structures with a large variety of size and shapes, therefore a macroscopic scattering coefficient is generally defined by:
µ
a=
∑
jN
jσ
α.j (3)where Nj is the number of particles j per unit volume and σa.j the corresponding scattering cross section4. Frequently, a dimensionless phase function f(p,q) is used instead of the cross section, σ as represented in figure I.5. It represents the fraction of incident energy from the direction p and scattered in the direction q.
4 Scattering cross section is defined as the probability that the incident beam will be scattered per unit time (normalized to one particle per unit time crossing a unit area perpendicular to the direction of incidence) [2]
Principles and context of OCT imaging in biological tissues.
The flux increase in the second direction is due to scattering between the two events. In a random and isotropic media, it is assumed that the phase function is only dependent upon the angle between the incident and scattered light and therefore independent of the orientation of the scatterer (i.e. independent of p). The phase function can therefore be expressed as a scalar product f(p,q) = f(p.q), which is equal to the cosine of the scattering angle cos (θ). The anisotropy factor g, is then defined as the amount of forward direction retained after a single scattering event or the mean cosine of the deflection angle θ. For a g factor of 1, the scatter is entirely in the forward direction, and for g = 0, scattering is isotropic.
Light scattering in most biological tissues is generally forward concentrated (i.e. anisotropic) with g factors usually found in the literature varying from about 0.69 to 0.99 [73]. It is more generally centred around an average scattering angle of 25° (i.e. a scattered photon deviates from its initial direction of flight by only 25° or a g factor of 0.9)[75]. The anisotropy factor is therefore dependent on the size, shape and the microscopic refractive index mismatch of the scattering particles. Several approximation models attempt to describe those interactions of biological tissues with light. Geometrical optics approximation:
Geometrical optics provide sufficient tools to describe the interaction of large particles with light and each particle can be envisioned as a thick lens. The light beam is therefore focused in a forward direction. However, geometrical optics concepts do not adequately describe the interaction of particles with light when the particle size is comparable to the wavelength of the light source. The Mie solution to Maxwell's equations:
In that case, Mie theory (developed in 1908 by Gustav Mie) provides rigorous solutions to Maxwell equations for light scattering by an isotropic sphere in a homogenous medium. Mie theory takes into consideration the phase difference between dipoles, which receive a different incident field at a given instant. The resulting scattering is therefore predominantly forward directed in the same direction as the incident beam of light.
Figure I.5: Phase function f(p.q) schematic representation.
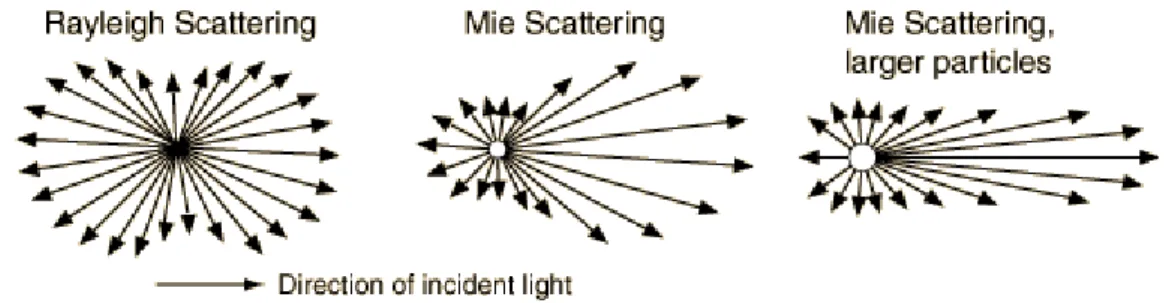
The Rayleigh solution to Maxwell's equations:
When the particle size is much smaller than the wavelength (typically the upper limit is taken to be about 1/10 the wavelength diameter), and then Mie theory turns into Rayleigh scattering theory. For a fixed, unpolarised incident wavelength, the intensity of the scattered wave is proportional to (1+cos² θ), as a function of the scattering angle θ, or more simply put, equally distributed in all directions (see figure I.6).
Wavelength dependence is another fundamental result of both Rayleigh and Mie theories and it has been shown that the intensity of the scattered wave is proportional to 1/ λk, where k
depends upon the size of the scatterers as shown on figure I.7.
For small particles (Rayleigh scattering regime), the intensity of the scattered wave is approximately proportional to 1/λ4. Therefore, when the wavelength of the illumination source
increases, scattering decreases faster than for Mie scattering. Isotropic scattering is mainly due to
Figure I.6: schematic representation of scattering possibilities as a function of particle's size.
Figure I.7: Scattering regime relative to the size of the particle in biological specimens.
Principles and context of OCT imaging in biological tissues. smaller organelles, such as mitochondria, while scattering at small angles are largely due to the cell membrane whereas nuclei have been found to be responsible for scattering at larger angles or Mie scattering regime [76–78].
I.2.2 Conclusion
Only inhomogeneities affect light scattering. If a light beam traverses a perfectly homogeneous medium it is not scattered. Both refraction at tissue interface and at a microscopic level are affecting light's propagation in tissues. Refraction effects are usually small in biological tissues, as tissue refractive indexes are generally similar. A common index range varies between, n=[1.35:1.45] in the visible wavelengths, 1.35 for high water content tissues and up to 1.45 for adipose tissues [79], [80]. At 633 nm wavelength, the typical decrease trend relative to the wavelength is 1% in average per 100 nm decrease in wavelength in the visible range.
However, divergence in refractive index measurements have been reported in the literature as cited by Bolin et al. [79]. In practice, light scattering models often omit the refractive index approximation. For this thesis, all measurements performed in biological samples have been adjusted with an average refractive index of 1.40 for defocus correction as a function of depth. For small animal imaging, specific refractive index have been applied (e.g n=1.55 for Drosophila melanogaster due to its high content in chitin).
In summary, spatially coherent optical imaging in biological tissues faces the exponential loss of useful photons due to scattering events taking place as light travels through a particular tissue. Absorption has only a limited effect compared to scattering. Since scattering events redirect photons randomly, the amount of useful light or ballistic photons collected by the camera is significantly reduced causing blurring and reduced contrast. In addition, an appropriate wavelength selection allows to manipulate two critical criteria which are penetration depth and resolution.
References
[1] M. S. Linet et al., “Cancer risks associated with external radiation from diagnostic imaging procedures.,” CA: a cancer journal for clinicians, Feb. 2012.
[2] Kiyosi Ito, Encyclopedic dictionary of mathematics. MIT Press, 1993. pp.1397
[3] J. Pawley, “Handbook of biological confocal microscopy,” Journal of Biomedical Optics, 2008. [4] H. Ra and W. Piyawattanametha, “Three-dimensional in vivo imaging by a handheld dual-axes
confocal microscope,” Optics …, 2008.
[5] A. French, S. Mills, and R. Swarup, “Colocalization of fluorescent markers in confocal microscope images of plant cells,” Nature protocols, 2008.
[6] M. Egeblad and A. Ewald, “Visualizing stromal cell dynamics in different tumor microenvironments by spinning disk confocal microscopy,” Disease models & …, 2008.
[7] B. D. Bennett, T. L. Jetton, G. Ying, M. A. Magnuson, and D. W. Piston, “Quantitative subcellular imaging of glucose metabolism within intact pancreatic islets.,” The Journal of biological
chemistry, vol. 271, no. 7, pp. 3647-51, Feb. 1996.
[8] S. Huang, A. A. Heikal, and W. W. Webb, “Two-photon fluorescence spectroscopy and microscopy of NAD(P)H and flavoprotein.,” Biophysical journal, vol. 82, no. 5, pp. 2811-25, May 2002.
[9] G. H. Patterson, S. M. Knobel, P. Arkhammar, O. Thastrup, and D. W. Piston, “Separation of the glucose-stimulated cytoplasmic and mitochondrial NAD(P)H responses in pancreatic islet beta cells.,” Proceedings of the National Academy of Sciences of the United States of
America, vol. 97, no. 10, pp. 5203-7, May 2000.
[10] M. Han, G. Giese, and J. Bille, “Second harmonic generation imaging of collagen fibrils in cornea and sclera.,” Optics express, vol. 13, no. 15, pp. 5791-7, Jul. 2005.
[11] K. König, K. Schenke-Layland, I. Riemann, and U. A. Stock, “Multiphoton autofluorescence imaging of intratissue elastic fibers.,” Biomaterials, vol. 26, no. 5, pp. 495-500, Feb. 2005. [12] S.-W. Teng et al., “Multiphoton autofluorescence and second-harmonic generation imaging of
the ex vivo porcine eye.,” Investigative ophthalmology & visual science, vol. 47, no. 3, pp. 1216-24, Mar. 2006.
[13] J. K. Karen, D. S. Gareau, S. W. Dusza, M. Tudisco, M. Rajadhyaksha, and K. S. Nehal, “Detection of basal cell carcinomas in Mohs excisions with fluorescence confocal mosaicing microscopy,” British Journal of Dermatology, vol. 160, no. 6, pp. 1242-1250, 2009.
Principles and context of OCT imaging in biological tissues. [14] K. S. Nehal, D. Gareau, and M. Rajadhyaksha, “Skin Imaging With Reflectance Confocal
Microscopy,” Seminars in Cutaneous Medicine and Surgery, vol. 27, no. 1, pp. 37-43, Mar. 2008.
[15] V. Campo-Ruiz, E. R. Ochoa, G. Y. Lauwers, and others, “Evaluation of hepatic histology by near-infrared confocal microscopy: A pilot study,” Human pathology, vol. 33, no. 10, pp. 975–982, 2002.
[16] A. Parrish, E. Halama, M. T. Tilli, M. Freedman, and P. A. Furth, “Reflectance confocal microscopy for characterization of mammary ductal structures and development of neoplasia in genetically engineered mouse models of breast cancer,” Journal of biomedical
optics, vol. 10, p. 051602, 2005.
[17] A. F. Fercher, W. Drexler, C. K. Hitzenberger, and T. Lasser, “OCT principles and applications,” Reports on Progress in Physics, vol. 66, no. 2, pp. 239-303, 2003.
[18] P. H. Tomlins and R. K. Wang, “Theory, developments and applications of optical coherence tomography,” Journal of Physics D: Applied Physics, vol. 38, no. 15, pp. 2519-2535, 2005. [19] R. Leitgeb, C. Hitzenberger, and A. Fercher, “Performance of fourier domain vs. time domain
optical coherence tomography,” Optics Express, vol. 11, no. 8, pp. 889-894, Apr. 2003. [20] A. M. Zysk, F. T. Nguyen, A. L. Oldenburg, D. L. Marks, and S. A. Boppart, “Optical coherence
tomography: A review of clinical development from bench to bedside,” Journal of Biomedical
Optics, vol. 12, no. 5, pp. 051403-21, 2007.
[21] B. Karamata, “Multiple Scattering in Wide-field Optical Coherence Tomography,” ÉCOLE POLYTECHNIQUE FÉDÉRALE DE LAUSANNE, 2004.
[22] B. Liu and M. E. Brezinski, “Theoretical and practical considerations on detection performance of time domain, Fourier domain, and swept source optical coherence tomography,” Journal
of Biomedical Optics, vol. 12, no. 4, pp. 044007-12, Jul. 2007.
[23] J. F. de Boer, B. Cense, B. H. Park, M. C. Pierce, G. J. Tearney, and B. E. Bouma, “Improved signal-to-noise ratio in spectral-domain compared with time-domain optical coherence tomography,” Optics Letters, vol. 28, no. 21, pp. 2067-2069, Nov. 2003.
[24] M. Szkulmowski, A. Szkulmowska, T. Bajraszewski, A. Kowalczyk, and M. Wojtkowski, “Flow velocity estimation using joint Spectral and Time domain Optical Coherence Tomography,”
Optics Express, vol. 16, no. 9, pp. 6008-6025, Apr. 2008.
[25] D. Huang et al., “Optical coherence tomography,” Science, vol. 254, no. 5035, pp. 1178-1181, Nov. 1991.
[26] C. M. Eigenwillig, T. Klein, W. Wieser, B. R. Biedermann, and R. Huber, “Wavelength swept amplified spontaneous emission source for high speed retinal optical coherence tomography at 1060 nm,” Journal of biophotonics, 2011.
[27] J. M. Schmitt, “Methods and Apparatus for Swept-Source Optical Coherence Tomography,” US
[28] M. V. Sarunic, M. A. Choma, C. Yang, and J. A. Izatt, “Instantaneous complex conjugate resolved spectral domain and swept-source OCT using 3x3 fiber couplers,” Optics Express, vol. 13, no. 3, p. 957, Feb. 2005.
[29] M. A. Choma, M. V. Sarunic, C. Yang, and J. A. Izatt, “Sensitivity advantage of swept source and Fourier domain optical coherence tomography,” Optics Express. 08-Sep-2003.
[30] R. Leitgeb, C. Hitzenberger, and A. Fercher, “Performance of fourier domain vs time domain optical coherence tomography,” Optics Express, vol. 11, no. 8, p. 889, Apr. 2003.
[31] M. Choma, M. Sarunic, C. Yang, and J. Izatt, “Sensitivity advantage of swept source and Fourier domain optical coherence tomography,” Optics Express, vol. 11, no. 18, p. 2183, Sep. 2003.
[32] B. Potsaid et al., “Ultrahigh speed spectral / Fourier domain OCT ophthalmic imaging at 70,000 to 312,500 axial scans per second,” Optics Express, vol. 16, no. 19, pp. 15149-15169, 2008. [33] R. A. Leitgeb et al., “Ultrahigh resolution Fourier domain optical coherence tomography,” Optics
Express, vol. 12, no. 10, pp. 2156-2165, 2004.
[34] E. A. Swanson et al., “In vivo retinal imaging by optical coherence tomography,” Optics Letters, vol. 18, no. 21, p. 1864, Nov. 1993.
[35] R. B. Rosen et al., “Multidimensional en-Face OCT imaging of the retina,” Optics Express, vol. 17, no. 5, pp. 4112-4133, Mar. 2009.
[36] N. Nassif et al., “In vivo high-resolution video-rate spectral-domain optical coherence tomography of the human retina and optic nerve,” Optics Express, vol. 12, no. 3, pp. 367-376, Feb. 2004.
[37] Y. Wang, A. Fawzi, O. Tan, J. Gil-Flamer, and D. Huang, “Retinal blood flow detection in diabetic patients by Doppler Fourier domain optical coherence tomography,” Optics Express, vol. 17, no. 5, pp. 4061-4073, Mar. 2009.
[38] B. Cense et al., “Volumetric retinal imaging with ultrahigh-resolution spectral-domain optical coherence tomography and adaptive optics using two broadband light sources,” Optics
Express, vol. 17, no. 5, pp. 4095-4111, Mar. 2009.
[39] T. P. M. Goderie et al., “Combined optical coherence tomography and intravascular ultrasound radio frequency data analysis for plaque characterization. Classification accuracy of human coronary plaques in vitro.,” The international journal of cardiovascular imaging, Apr. 2010. [40] I.-K. Jang et al., “In Vivo Characterization of Coronary Atherosclerotic Plaque by Use of Optical
Coherence Tomography,” Circulation, vol. 111, no. 12, pp. 1551-1555, Mar. 2005.
[41] D. Levitz et al., “Determination of optical scattering properties of highly-scattering media in optical coherence tomography images,” Optics Express, vol. 12, no. 2, p. 249, Jan. 2004. [42] A. S. Paranjape et al., “Depth resolved photothermal OCT detection of macrophages in tissue
Principles and context of OCT imaging in biological tissues. [43] I.-K. Jang et al., “Visualization of coronary atherosclerotic plaques in patients using optical
coherence tomography: comparison with intravascular ultrasound,” Journal of the American
College of Cardiology, vol. 39, no. 4, pp. 604-609, Feb. 2002.
[44] G. Isenberg et al., “Accuracy of endoscopic optical coherence tomography in the detection of dysplasia in Barrett’s esophagus: a prospective, double-blinded study,” Gastrointestinal
Endoscopy, vol. 62, no. 6, pp. 825-831, Dec. 2005.
[45] A. P. Weston, A. S. Badr, and R. S. Hassanein, “Prospective multivariate analysis of factors predictive of complete regression of Barrett’s esophagus,” The American Journal of
Gastroenterology, vol. 94, no. 12, pp. 3420-3426, Dec. 1999.
[46] X. D. Li et al., “Optical coherence tomography: Advanced technology for the endoscopic imaging of Barrett’s esophagus,” Endoscopy, vol. 32, no. 12, pp. 921-930, 2000.
[47] John A. Evans et al., “Optical Coherence Tomography to Identify Intramucosal Carcinoma and High-Grade Dysplasia in Barrett’s Esophagus,” Clinical gastroenterology and hepatology :
the official clinical practice journal of the American Gastroenterological Association, vol. 4,
no. 1, pp. 38-43, Jan. 2006.
[48] G. Zuccaro et al., “Optical coherence tomography of the esophagus and proximal stomach in health and disease,” Am J Gastroenterol, vol. 96, no. 9, pp. 2633-2639, 2001.
[49] J. M. Poneros and N. S. Nishioka, “Diagnosis of Barrett’s esophagus using optical coherence tomography,” Gastrointestinal Endoscopy Clinics of North America, vol. 13, no. 2, pp. 309-323, Apr. 2003.
[50] Y. Chen et al., “Ultrahigh resolution optical coherence tomography of Barrett’s esophagus: preliminary descriptive clinical study correlating images with histology.,” Endoscopy, vol. 39, no. 7, pp. 599-605, Jul. 2007.
[51] T. M. Bydlon et al., “Performance metrics of an optical spectral imaging system for intra-operative assessment of breast tumor margins,” Optics Express, vol. 18, no. 8, p. 8058, Apr. 2010.
[52] F. T. Nguyen et al., “Intraoperative Evaluation of Breast Tumor Margins with Optical Coherence Tomography,” Cancer Res, vol. 69, no. 22, pp. 8790-8796, Nov. 2009.
[53] A. M. Zysk and S. A. Boppart, “Computational methods for analysis of human breast tumor tissue in optical coherence tomography images.,” Journal of biomedical optics, vol. 11, no. 5, p. 054015.
[54] R. a McLaughlin, L. Scolaro, P. Robbins, S. Hamza, C. Saunders, and D. D. Sampson, “Imaging of human lymph nodes using optical coherence tomography: potential for staging cancer.,” Cancer research, vol. 70, no. 7, pp. 2579-84, Apr. 2010.
[55] N. V. Iftimia, M. Mujat, T. Ustun, R. D. Ferguson, V. Danthu, and D. X. Hammer, “Spectral-domain low coherence interferometry/optical coherence tomography system for fine needle breast biopsy guidance.,” The Review of scientific instruments, vol. 80, no. 2, p. 024302, Mar. 2009.
[56] W. Luo et al., “Optical biopsy of lymph node morphology using optical coherence tomography,”
Technology in Cancer Research & Treatment, vol. 4, no. 5, pp. 539-548, Oct. 2005.
[57] A. M. Zysk, E. J. Chaney, and S. A. Boppart, “Refractive index of carcinogen-induced rat mammary tumours,” Physics in Medicine and Biology, vol. 51, no. 9, pp. 2165-2177, 2006. [58] B. J. Vakoc et al., “Three-dimensional microscopy of the tumor microenvironment in vivo using
optical frequency domain imaging.,” Nature medicine, vol. 15, no. 10, pp. 1219-23, Oct. 2009.
[59] Y. Zhao et al., “Integrated multimodal optical microscopy for structural and functional imaging of engineered and natural skin.,” Journal of biophotonics, Feb. 2012.
[60] C. Li, G. Guan, X. Cheng, Z. Huang, and R. K. Wang, “Quantitative elastography provided by surface acoustic waves measured by phase-sensitive optical coherence tomography,”
Optics Letters, vol. 37, no. 4, p. 722, Feb. 2012.
[61] B. F. Kennedy et al., “In vivo three-dimensional optical coherence elastography,” Optics
Express, vol. 19, no. 7, p. 6623, Mar. 2011.
[62] E. Auksorius et al., “Dual-modality fluorescence and full-field optical coherence microscopy for biomedical imaging applications.,” Biomedical optics express, vol. 3, no. 3, pp. 661-6, Mar. 2012.
[63] M. Hagen-Eggert, D. Hillmann, P. Koch, and G. Hüttmann, “Diffusion-sensitive Fourier-domain optical coherence tomography,” in Proceedings of SPIE, 2011, vol. 7889, no. 1, p. 78892B-78892B-6.
[64] D. C. Adler et al., “Comparison of three-dimensional optical coherence tomography and high resolution photography for art conservation studies,” Optics Express, vol. 15, no. 24, p. 15972, Nov. 2007.
[65] T. Arecchi et al., “A new tool for painting diagnostics: Optical coherence tomography,” Optics
and Spectroscopy, vol. 101, no. 1, pp. 23-26, Jul. 2006.
[66] M. Hughes, M. Spring, and A. Podoleanu, “Speckle noise reduction in optical coherence tomography of paint layers,” Applied Optics, vol. 49, no. 1, pp. 99-107, Jan. 2010.
[67] G. Latour, J.-P. Echard, B. Soulier, I. Emond, S. Vaiedelich, and M. Elias, “Structural and optical properties of wood and wood finishes studied using optical coherence tomography: application to an 18th century Italian violin.,” Applied Optics, vol. 48, no. 33, pp. 6485-6491, 2009.
[68] H. Liang et al., “En-face optical coherence tomography : a novel application of non-invasive imaging to art conservation,” Optics Express, vol. 13, no. 16, pp. 6133-6144, 2005.
[69] H. Liang, B. Peric, M. Hughes, A. Podoleanu, M. Spring, and D. Saunders, Optical coherence
tomography for art conservation and archaeology, vol. 6618, no. 1. SPIE, 2007, pp.
Principles and context of OCT imaging in biological tissues. [70] J. Nimmrichter et al., Lasers in the Conservation of Artworks, vol. 116. Berlin, Heidelberg:
Springer Berlin Heidelberg, 2008, pp. 487-492-492.
[71] M. Targowski, P., Iwanicka, L. Tymińska-Widmer, M. Sylwestrzak, and E. A. Kwiatkowska, “Structural examination of easel paintings with optical coherence tomography.,” Accounts of
chemical research, vol. 43, no. 6, pp. 826-36, Jun. 2010.
[72] P. Targowski, B. Rouba, M. Góra, L. Tymińska-Widmer, J. Marczak, and A. Kowalczyk, “Optical coherence tomography in art diagnostics and restoration,” Applied Physics A, vol. 92, no. 1, pp. 1-9, Mar. 2008.
[73] W. F. Cheong, S. A. Prahl, and A. J. Welch, “A review of the optical properties of biological tissues,” IEEE Journal of Quantum Electronics, vol. 26, no. 12, pp. 2166-2185, 1990.
[74] V G Peters et al, “Optical properties of normal and diseased human breast tissues in the visible and near infrared,” Physics in Medicine and Biology, vol. 35, no. 9. p. 1317, 1990.
[75] F. Kiessling, Small Animal Imaging. Springer, 2010, p. 597.
[76] M. Bartlett, G. Huang, L. Larcom, and H. Jiang, “Measurement of Particle Size Distribution in Mammalian Cells In Vitro by Use of Polarized Light Spectroscopy,” Applied Optics, vol. 43, no. 6, p. 1296, Feb. 2004.
[77] J. R. Mourant et al., “Light scattering from cells: the contribution of the nucleus and the effects of proliferative status.,” Journal of biomedical optics, vol. 5, no. 2, pp. 131-7, Apr. 2000. [78] A. M. K. Nilsson, C. Sturesson, D. L. Liu, and S. Andersson-Engels, “Changes in Spectral
Shape of Tissue Optical Properties in Conjunction with Laser-Induced Thermotherapy,”
Applied Optics, vol. 37, no. 7, p. 1256, Mar. 1998.
[79] F. P. Bolin, L. E. Preuss, R. C. Taylor, and R. J. Ference, “Refractive index of some mammalian tissues using a fiber optic cladding method,” Applied Optics, vol. 28, no. 12, p. 2297, Jun. 1989.
[80] G. J. Tearney, M. E. Brezinski, J. F. Southern, B. E. Bouma, M. R. Hee, and J. G. Fujimoto, “Determination of the refractive index of highly scattering human tissue by optical coherence tomography,” Optics Letters, vol. 20, no. 21, p. 2258, Nov. 1995.
[81] N.Graf, “Optical Coherence Tomography,” Vanderbiilt University, 2010. [Online]. Available: http://research.vuse.vanderbilt.edu/skalalab/optical-coherence-tomography.html. [Accessed: 30-Dec-2011].
[82] D. et al. Sampson, “OBEL: Introduction to optical coherence tomography (OCT),” 2004. [Online]. Available: http://obel.ee.uwa.edu.au/research/oct/intro/. [Accessed: 01-Jan-2012].
Chapter II. Full-Field OCT system: design
principles and performance
As presented in the introductory chapter, previous work in OCT have been performed with beam scanning techniques over the volume of interest. Full-field OCT (FFOCT) is based on a Time-Domain approach and acquires an entire field of view by using a Linnik configuration coupled with an image detector such as a CCD camera. This parallel approach is usually referred to “en-face” OCT as opposed to a cross-sectional view in traditional OCT imaging. While conventional OCT is often compared to the optical analogue of B-mode ultrasound, FFOCT would be conceptually closer to a depth resolved microscopy technique. The transverse resolution achieved is indeed similar to a low or medium power microscope with the ability to image inside a biological sample without any staining or specimen fixation. Potential end-users would therefore be predominantly in histopathology and biology laboratories in comparison to traditional OCT which is more aimed at surgical settings or for screening purposes.
After a presentation of the principles of full-field OCT, its design and performance are described. Then the clinical setup developed by the laboratory spin-off (LLTech) will be briefly presented. Finally, the main advantages and drawbacks of the technique are discussed. Throughout the chapter technical considerations of the system and image acquisition methods are also analysed.
The contribution of several members of the laboratory and LLTech team must be appropriately acknowledged in advance. This presentation involves the previous work of Laurent Vabre, Gael Moneron and Arnaud Dubois under the direction of Claude Boccara at ESPCI laboratory; and the more recent contribution of Fabrice Harms, Eugénie Dalimier and Franck Martins from LLTech. Charles Brossolet has been instrumental in all the software related issues of this work. The basic principles of the technique have been previously detailed [1–2], while recent results and developments in relation to this chapter were reported in two publications [3–4].
II.1 Full-field OCT: basic principles
II.1.1 Description of the FF-OCT setup
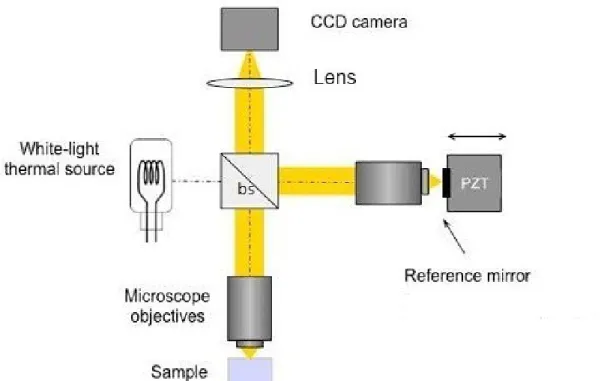
The full-field OCT experimental setup is based on a Michelson interferometer with identical water-immersion objectives in both arms. It is commonly referred to a Linnik configuration [5], [6] as shown on figure II.1.
FFOCT is based on low-coherence interferometry as conventional OCT. However, here a white-light halogen lamp is used as a spatially incoherent source and the entire field of view of each microscope objectives is illuminated after passing through a beam splitter. The tungsten filament lamp is incorporated in a classical Köhler configuration to achieve the most homogeneous illumination.
A broadband beam splitter separates the light beam onto a mirror (reference arm) and onto the specimen imaged (sample arm). A silicone-based wafer mirror is placed in the reference arm at the focus of the microscope objective. The initial silicon-based wafer used for the experimental setup and providing a reflectivity of 17.5% in silicone oil for the wavelength region of interest
(600-Figure II.1: Experimental set-up of the full-field OCT developed at ESPCI/Institut Langevin. Pair of microscope objectives (water or oil immersion – 10X, 0.3 NA, Olympus), bs: beam-splitter (broadband, non polarizing), Lens: achromatic doublet, Reference mirror: 1-10% reflectivity, PZT: oscillating piezoelectric stage actuator , CCD: charged coupled device camera or CMOS camera complementary metal-oxide semiconductor. Glass plates can be added within the path of both objectives for dispersion balance.
Full-Field OCT system: design principles and performance 800 nm) was later adjusted in the clinical setup developed by LLTech to match the reflectivity of biological tissues (around 2-3%). A YAG crystal rod (Yttrium Aluminium Garnet) can also be used due to its low reflectivity in the visible and in water immersion (reflectivity close to 2-3%). The major downside of a water-based medium (e.g. echographic gel) is its instability and low resistance to evaporation. Despite having both arms sealed, gel dehydration can still occur and cause irreversible blurring on the objectives. For the clinical setup, silicone oil was therefore determined more adapted as immersion liquid for both arms with similar optical properties if not improved (see chapter VI).
II.1.2 Temporal low-coherence and slice sectioning in FFOCT
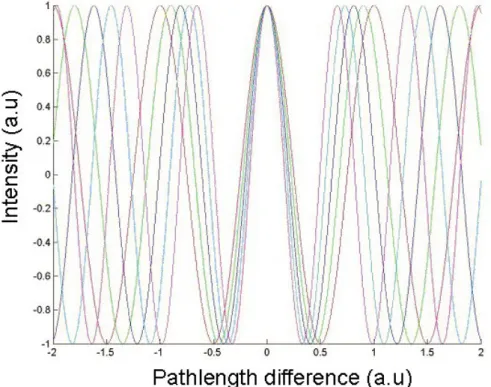
Axial scanning is performed via a motorized translation stage allowing sequential image acquisition with slices as thin as 1 micron. The setup sectioning ability is directly related to the low temporal coherence of the light source. Interferences occur only when the light from both arms has travelled a nearly identical “optical distance” as shown on figure II.2.
The low temporal coherence gate therefore allows only interferences within half of the coherence length. Consequently, only a slight difference in pathlength travelled causes the interferometric image to be blurred by background noise. When light reflected by the reference mirror interferes with the light reflected or backscattered by the sample, micro-structures contained within the volume are filtered out from the specimen. This virtual zone is a slice orthogonal to the objective axis, located at a depth inside the object defined by an optical path length difference of zero. If the
figure II.2: interferogram example of a low-coherence illumination source; hence its micron-scale sectioning ability .