September 2012, Issue 9
IN THIS ISSUE
PERFORMANCEOFPENSION FUNDS
INVESTMENT RATE OF RETURN PAGE 2
PENSION FUND WEALTH PAGE 3
INDUSTRY STRUCTURE PAGE 5
TRENDS IN PENSION FUND ASSETS PAGE 8
INVESTMENTS PAGE 12
BENEFITS AND CONTRIBUTIONS PAGE 15
PENSION FUNDS IN SELECTED NON-OECD COUNTRIES PAGE 18
TABLE OF PENSION FUNDS' TOTAL INVESTMENT BY COUNTRY, 2001-2011 PAGE 21 METHODOLOGICAL NOTES PAGE 22 INBRIEF – P.26 CALENDAROFEVENTS – P.28
Pension fund assets hit record
USD 20.1 trillion in 2011 but investment
performance weakens
The OECD weighted average asset-to-GDP ratio for pension funds increased from 67.3% of GDP in 2001 to 72.4% of GDP in 2011, with the Netherlands achieving the highest ratio at 138%. The ratio is however still low in several countries with less than half of OECD countries exhibiting ratios above 20%, leaving ample room for further pension market developments. Pension fund assets in the non-OECD countries covered are still small but they are growing faster than those of OECD countries.
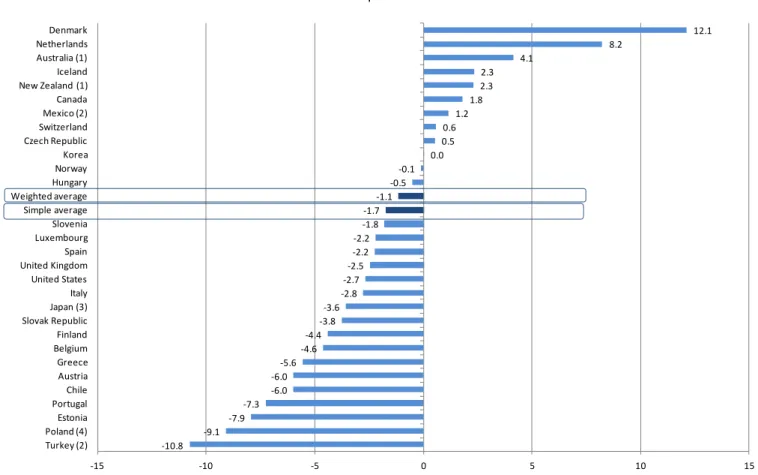
The annual, real rate of investment returns (in local currency and after investment management expenses) averaged -1.7% ranging widely from 12.1% for the highest performer (Denmark) to -10.8% for the lowest (Turkey). After Denmark, the highest returns in 2011 were in the Netherlands (8.2%), Australia (4.1%), Iceland (2.3%) and New Zealand (2.3%). On the other hand in countries like Italy, Japan, Spain, the United Kingdom and the United States, pension funds experienced average negative investment returns in the range of -2.2% to -3.6%. Nine other OECD countries saw pension fund returns of worse than -4% in real terms.
The pension funds allocation to public equities declined significantly compared to past years. Trends toward defined contribution plans accelerated, although defined benefit plans continue to represent a very important component of pension funds assets.
Despite this recent trend, the performance of pension funds measured over the long-term remains relatively attractive. Based on OECD calculations, a person who had saved for retirement for 40 years in a pension plan investing 60% in equities and 40% in long-term government bonds and retired at the end of 2010 would have experienced an annual investment performance of 2.8% in Japan, 4.2% in Germany, 4.4% in the United States and 5.8% in the United Kingdom.
By André Laboul, Head of the Financial Affairs Division Directorate for Financial and Enterprise Affairs
Pension Markets in Focus
This annual publication reviews trends in the financial performance of pension funds, including investment returns and asset allocation.
The underlying data for the tables
and graphs plus a statistical annex
can be found in Excel format at www.oecd.org/daf/pensions/pension markets
Continuing the trend started in 2009, pension funds experienced a moderate growth of USD 0.9 trillion in their accumulated assets during 2011, mainly due to asset accumulation and despite a weak rate of investment returns. However, this was good enough for pension funds in the OECD area to complete their recovery of the USD 3.4 trillion in market value that they lost in 2008, hitting a record USD 20.1 trillion in total assets by December 2011.
Pension fund assets by selected regions
0.5 1.3 1.7 13.6 15.6 0.7 1.8 2.0 17.5 20.1 0 5 10 15 20 25 Latin America Asia Euro area Total G20 Total OECD 2011 2008 USD tr.
PERFORMANCE OF PENSION FUNDS
INVESTMENT RATE OF RETURN
After a period of recovery over 2009-2010, OECD-area pension funds experienced negative rates of return in more than half of the OECD countries in 2011.
In 2009 and 2010 buoyant stock markets brought good returns for pension funds after the steep declines at the height of the global financial crisis. Renewed uncertainty in the world economy in 2011 reversed the positive trend in stock markets and impacted negatively on many pension funds, especially those most exposed to equities. Pension fund performance was also hampered by bond portfolios in pension funds most exposed to the European sovereign debt crisis. On the other hand, pension funds with high exposure to sovereign bond safe havens benefited from major revaluation gains.
As shown in Figure 2, the net investment rate of return varies considerably across national markets. On the basis of the simple average across OECD countries, for the countries for which information is available, pension funds experienced an annual, real rate of investment returns (in local currency and after investment management expenses) of -1.7%, ranging from 12.1% for the highest performer (Denmark) to -10.8% for the lowest (Turkey). The performance of Danish pension funds was driven to a large extent by gains on bond investments and interest hedging operations. After Denmark, the highest returns in 2011 were in the Netherlands (8.2%), Australia (4.1%), Iceland (2.3%) and New Zealand (2.3%). On the other hand in countries like Italy, Japan, Spain, the United Kingdom and the United States, pension funds experienced average investment returns in the range of -2.2 % to -3.6%. Nine other OECD countries saw pension fund returns of worse than -4% in real terms. As the real net investment return is the combination of the nominal performance of pension funds and inflation, a low figure can be accounted for by either low gains and income or inflation.
Comparison with the weighted average gives nearly the same picture. The annual, weighted average real rate of investment return was -1.1% in the OECD countries. Most of this negative average is skewed by the negative rate of investment returns, experienced in 2011 for pension funds in Japan, the United Kingdom and the United States. These account for around 70% of the total OECD–area pension fund assets and all experienced investment performance below -2%.
The performance of pension funds measured over the long-term remains significant.
Saving for retirement is for the long haul. Pension fund performance should therefore be assessed over longer periods (Figure 1) than the one year shown in Figure 2. As the typical accumulation period for a worker is
around 40-years, a high enough cumulative performance over such a period is necessary to achieve adequate pension benefits. As official data on the performance of pension funds spanning more than 10 years is not available, we calculated hypothetical returns on an investment portfolio split 60%/40% between equities and government debt for 40 years ending in 1990, 2000 and 2010. The calculations use actual data on returns on equities (including dividends), long-term government debt and inflation. The results are shown in Figure 1 for Germany, Japan, the United Kingdom and the United States.
Figure 1 shows that over the three 40-year periods, hypothetical average annual real returns on a 60/40 portfolio would have been relatively significant for the countries analysed. Based on our calculations, a person that had saved for retirement for 40 years in a pension plan investing 60% in equities and 40% in long-term government bonds and retired at the end of 2010 would have experienced a performance of 2.8% in Japan, 4.2% in Germany, 4.4% in the United States and 5.8% in the United Kingdom.
We further compared these hypothetical performance values with average real wage growth over the same periods to assess the extent to which – on average - pension funds were able to obtain achieve an income above the worker‟s own salary growth. On average during the 40 years ending in 2010, real wages grew annually by 0.6% in the United States, 0.7% in Germany, 1.2% in Japan and 2.1% in the United Kingdom. Hence, investment performance over the 40-year period has been sufficient to deliver a higher standard of living after retirement for each dollar saved.
Figure 1. Hypothetical real investment returns on a 60/40 portfolio in selected OECD countries
In per cent 0.0 1.0 2.0 3.0 4.0 5.0 6.0 7.0 8.0 9.0
Germany Japan United
Kingdom
United States
1950-1990 1960-2000 1970-2010
Source: OECD staff estimates using historical data on returns from equity indices (including dividends) and government bills, and inflation, Credit Suisse Global Investment Yearbook.
Figure 2. Pension funds' real, net investment rate of return in selected OECD countries, Dec 2010 - Dec 2011 In per cent -10.8 -9.1 -7.9 -7.3 -6.0 -6.0 -5.6 -4.6 -4.4 -3.8 -3.6 -2.8 -2.7 -2.5 -2.2 -2.2 -1.8 -1.7 -1.1 -0.5 -0.1 0.0 0.5 0.6 1.2 1.8 2.3 2.3 4.1 8.2 12.1 -15 -10 -5 0 5 10 15 Turkey (2) Poland (4) Estonia Portugal Chile Austria Greece Belgium Finland Slovak Republic Japan (3) Italy United States United Kingdom Spain Luxembourg Slovenia Simple average Weighted average Hungary Norway Korea Czech Republic Switzerland Mexico (2) Canada New Zealand (1) Iceland Australia (1) Netherlands Denmark
Note: See page 22 for a description of how OECD calculates the rate of investment returns. Source: OECD Global Pension Statistics.
PENSION FUND WEALTH
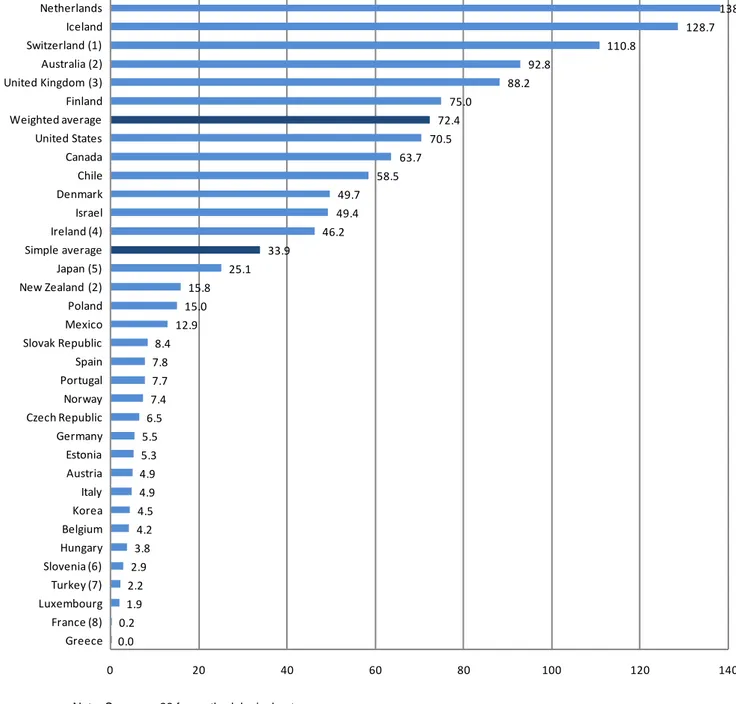
The OECD weighted average asset-to-GDP ratio for pension funds increased from 67.3% of GDP in 2001 to 72.4% of GDP in 2011, with the Netherlands achieving the largest ratio in 2011, at 138%.
The importance of private pension systems can also be gauged by looking at the market value of assets accumulated relative to the size of the economy. The larger the value of their investments, the greater will be their ability to provide high benefits to individuals.
As Figure 3 shows, in 2011, in relation to the national economy only three OECD countries achieved asset-to-GDP ratios higher than 100% – the Netherlands (138%), Iceland (129%) and Switzerland (111%). In addition to these countries, Australia, the United Kingdom and Finland exceeded the OECD weighted average asset-to-GDP ratio of 72.4% with respectively 92.8%, 88.2% and 75%. Pension fund assets were of varying importance relative to GDP in the other countries. Only thirteen out of thirty three countries, for which information was available, had assets-to-GDP ratios above 20%, which is considered the minimum for meeting the OECD‟s definition of a “mature” pension fund market.
Figure 3. Importance of pension funds relative to the size of the economy in OECD countries, 2011 As a percentage of GDP 138.2 128.7 110.8 92.8 88.2 75.0 72.4 70.5 63.7 58.5 49.7 49.4 46.2 33.9 25.1 15.8 15.0 12.9 8.4 7.8 7.7 7.4 6.5 5.5 5.3 4.9 4.9 4.5 4.2 3.8 2.9 2.2 1.9 0.2 0.0 0 20 40 60 80 100 120 140 Netherlands Iceland Switzerland (1) Australia (2) United Kingdom (3) Finland Weighted average United States Canada Chile Denmark Israel Ireland (4) Simple average Japan (5) New Zealand (2) Poland Mexico Slovak Republic Spain Portugal Norway Czech Republic Germany Estonia Austria Italy Korea Belgium Hungary Slovenia (6) Turkey (7) Luxembourg France (8) Greece
Note: See page 22 for methodological notes.
INDUSTRY STRUCTURE
Despite a moderate growth in pension
accumulated assets in 2011, pension fund assets hit record USD 20.1 trillion in 2011.
The United States‟ share of this total has shrunk by 14.1 percentage points since 2001 as a result of faster growth among pension funds in other OECD countries. In absolute terms, the United States had the largest pension fund market of any OECD member country in 2011 with assets worth USD 10.6 trillion. In relative terms, however, the United States‟ share of OECD pension
fund assets shrank from a level of 67.3% in 2001 to 53.2% in 2011 as shown in Figure 4. Other OECD countries with large pension fund systems include the United Kingdom with assets worth USD 2.1 trillion and a 10.7% share of the OECD pension fund market in 2011; Japan, USD 1.5 trillion and 7.4%; Australia, USD 1.3 trillion and 6.7%; the Netherlands, USD 1.2 trillion and 5.8%; Canada, USD 1.1 trillion and 5.6%; and Switzerland, USD 0.7 trillion and 3.5%. For the remaining 19 OECD countries for which both 2001 and 2011 data are available, total pension fund assets in 2011 were valued at approximately USD 1.4 trillion, which accounted for 7% of the OECD-area total.
Figure 4. Geographical distribution of pension fund assets in OECD countries, 2001-2011 As a percentage of total OECD
67.3 53.2 9.7 10.7 7.1 7.4 2.5 6.7 3.8 5.8 3.5 5.6 2.4 3.5 3.7 7.0 0 10 20 30 40 50 60 70 80 90 100 2001 2011 Other OECD Switzerland (1) Canada Netherlands Australia (2) Japan (3) United Kingdom (4) United States
Note: See page 23 for methodological notes.
Source: OECD Global Pension Statistics.
In 2011, all OECD private pension markets, including both occupational (workplace-related) and personal arrangements, were valued at an approximate total of USD 29.5 trillion. Of that amount, 68.4%, valued at USD 20.1 trillion, was held by pension funds; 18.4%, worth USD 5.4 trillion, was held in retirement products provided by banks or investment management companies; 12.4%, estimated at USD 3.7 trillion, was held in pension insurance contracts run by life or pension insurance companies; and 0.8%, or USD 0.2 trillion, were book reserves.
Occupational pensions are overwhelmingly funded through pension funds in most OECD countries, the main exception being countries such as Denmark, Norway and Sweden, where pension insurance
contracts play a larger role, and Germany where book reserves are the main type of financing vehicle for occupational pension plans. Personal pension plans are often funded through pension insurance contracts or financial products provided by banks and asset managers (e.g., mutual funds). The main exceptions to this general trend are the mandatory personal pension plans established in countries such as Mexico, Poland, and the Slovak Republic. These systems can be financed via pension funds only during the asset accumulation stage (before retirement), although state and pension companies may provide additional funding in special cases (like guarantee funds or minimum pension guarantees).
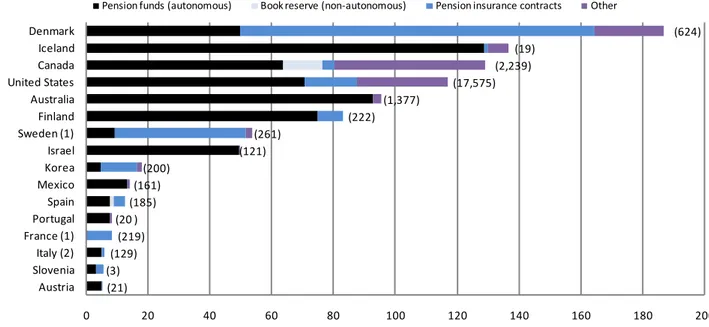
As shown in Figure 5, pension funds are the main financing vehicle for private pension plans in Israel and represent more than 90% of total assets in countries
Portugal. On the other hand, in Denmark, France, Korea and Sweden, pension insurance contracts account for the largest shares of aggregate private pension assets. Denmark's private pension system was the largest in relation to its economy at nearly 190% of
GDP, followed by those of Iceland (137%), Canada (129%) and the United States (117%). The remainder of this publication will focus exclusively on autonomous pension funds, unless specified otherwise.
Figure 5. Private pension assets by type of financing vehicle, 2011 As a percentage of GDP and in absolute terms (USD billion)
(624) (19) (2,239) (17,575) (1,377) (222) (261) (121) (200) (161) (185) (20 ) (219) (129) (3) (21) 0 20 40 60 80 100 120 140 160 180 200 Denmark Iceland Canada United States Australia Finland Sweden (1) Israel Korea Mexico Spain Portugal France (1) Italy (2) Slovenia Austria
Pension funds (autonomous) Book reserve (non-autonomous) Pension insurance contracts Other
Note: See page 23 for methodological notes.
Source: OECD Global Pension Statistics.
In most OECD countries for which data are available, DB plans account for a steadily falling share of total assets.
In the United States, DB assets shrank by 6.6 percentage points from 67.3% of total assets in 2001 to 60.6% in 2011. The same trend has been observed in Italy, New Zealand and Portugal. In Italy, for instance, the share of DB assets in total assets fell from 29.4% in 2001 to 8.6% in 2011. This trend is driven in Italy by closure of existing DB plans to new members.
Many have since been wound up or converted into DC plans. Despite the intensity of the shift towards DC plans, DB plans‟ share of total assets remains at very high levels in some OECD countries like Finland, Norway and Germany with 100% and Portugal with 91%.
Defined contribution (DC) pension funds continue to grow faster than defined benefit (DB) funds.
In recent years, occupational pension plan sponsors have in many countries shown a growing interest in defined contribution (DC) plans, as demonstrated by the number of employers that have closed defined benefit (DB) plans to new entrants and encouraged employees to join DC plans (and in some cases also frozen benefit accruals for existing employees). As shown by Figure 6, the DB/Hybrid-Mixed vs. DC split varies considerably across national markets. For example, in Chile, the Czech Republic, Hungary, Poland and the Slovak Republic, all pension funds are classified as DC, while DB dominates in Canada, Finland, Germany, Korea, and Norway. Other OECD countries have arrangements that combine DC and DB.
DB plans, however, still play an important role, largely due to their historical prominence as the favoured
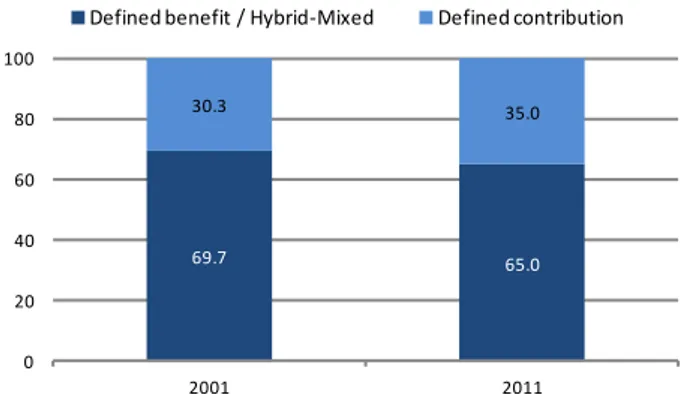
arrangement for workplace pensions in many countries. Figure 7 shows that in 2011 DB pension funds held 65% of the assets, across the 17 OECD countries for which information was available. This contrasts with
the situation in 2001, when DB pension funds held 69.7% of the total. Most of the increase in DC assets is attributable to the United States (Figure 8).
Figure 6. Relative shares of DB and DC pension fund assets in selected OECD countries, 2011 As a percentage of total assets
0% 10% 20% 30% 40% 50% 60% 70% 80% 90% 100% Chile Czech Republic Estonia Greece Hungary Poland Slovak Republic Denmark Italy Australia (1) Mexico New Zealand (1) Iceland United States (2) Israel Korea Portugal Canada (2) Germany (3) Finland Norway Switzerland
Defined contribution Defined benefit / Hybrid-Mixed
Note: See page 23 for methodological notes.
Source: OECD Global Pension Statistics.
Figure 7. Defined benefit (traditional and hybrid-mixed) vs. Defined contribution pension fund assets in total
selected OECD countries, 2001-2011 As a percentage of total assets
69.7 65.0 30.3 35.0 0 20 40 60 80 100 2001 2011
Defined benefit / Hybrid-Mixed Defined contribution
Note: See page 23 for methodological notes.
Source: OECD Global Pension Statistics.
Figure 8. Defined benefit (traditional and hybrid-mixed) pension fund assets for selected OECD countries,
2001-2011
As a percentage of total assets
0 10 20 30 40 50 60 70 80 90 100 2001 2011 n.d. n.d. n.d. n.d.
Note: See page 23 for methodological notes.
TRENDS IN PENSION FUND ASSETS
The OECD pension funds' asset-to-GDP ratio is however still low in several countries with only 40% of OECD countries with ratios above 20%, which pave the way for further pension market developments.
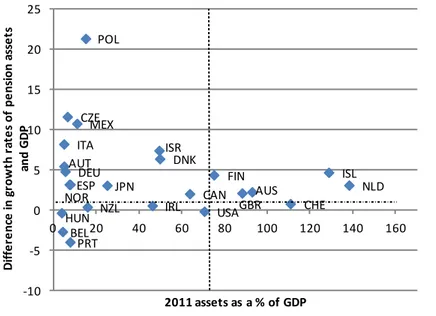
The difference between the average growth rate of pension fund assets in a country and its GDP is an indicator of the expansion of the pension fund system and its ability to offer higher benefits to a certain population or broaden its coverage to more people. The weighted average of this indicator across the OECD countries between 2001 and 2011 was approximately 1.3%. This average, however, masks substantial differences in growth rates between countries. Four main groups of countries can be identified, corresponding to the four main quadrants into which the chart in Figure 9 has been divided. Australia, Finland, Iceland, the Netherlands and the United Kingdom are “moving ahead”, as both their assets and the rate at which they are growing relative to the GDP growth rate are above the OECD average. In Iceland for instance, pension fund assets grew by an average of 4.7% per year relative to GDP during the period 2001-11, reaching 128.7% of GDP in 2011. In Switzerland, although pension fund assets are still an important part of the economy, accounting for 110.8% of GDP in total, they grew at a slower pace (0.8%) relative to GDP than the OECD average over the period 2001-11. Among other countries, Switzerland pension fund system may therefore be considered to be “losing momentum”.
Central and Eastern European countries like Poland and the Czech Republic, together with Mexico, recently introduced mandatory private pension systems. They therefore have low asset-to-GDP ratios, but are considered to be "catching up". They experienced one of the highest average growth rate differentials among OECD countries over the period 2001-11: Poland registered 21.4%, the Czech Republic 11.6%, and Mexico 10.8%. Italy‟s voluntary private pension system also achieved a high growth rate, 8.2%.
Finally, three main countries – Hungary, Belgium and Portugal – can be considered to be falling behind other OECD members in pension fund development,
as both their relative asset growth and asset-to-GDP ratios are low by OECD standards. Portugal‟s private pension market, which represents only 7.7% of GDP, experienced negative growth well below the OECD‟s 1.3% weighted average. This situation is explained by a decrease of about 33% in assets from 2010 to 2011, reflecting the transfer of bank pension funds (i.e. pension funds sponsored by banks, which have as beneficiaries the employees of their banks) to the Public Retirement System. In Hungary, as a result of pension reform the assets of mandatory pension funds decreased by 92% from year-end 2010 figures, while voluntary pension fund assets did not change significantly.
Pension fund asset growth between 2001 and 2011 was highest in countries that had started from a low base, such as Eastern European countries.
Total pension fund assets in the OECD area grew by 85% between 2001 and 2011, or about 6.4% annually. Growth was relatively stable over the years, apart from the drop in 2001-02, caused by negative equity performance, and the recent global financial crisis. The fastest average annual growth rate in assets was observed in Estonia (95.4%), followed by Poland (32.6%) and the Czech Republic (25.9%) (see Figure 10). These high growth rates are largely explained by the relative youth of their pension funds, and by mandatory enrolment (in Poland). The slowest average annual growth rate was that of Portuguese pension funds, at 3.3%.
The slow growth in pension fund assets in these and other countries (such as France and Portugal) is confirmed by the stability or decline in their asset-to-GDP ratios. This contrasts with the experience of countries such as Estonia, Italy, Mexico, Poland and Slovenia where pension fund to GDP ratios are increasing rapidly, albeit from a low base (see Figures 11 to 13).
Growth prospects in some of these countries are very positive because of the mandatory nature of private pension provision. However, the recent decision to reduce mandatory pension contributions in Poland will weigh down on asset growth in the future. In Hungary the elimination of the mandatory pension fund system led to a sharp contraction in pension fund assets.
Figure 9. Pension fund assets in 2011 compared to the difference in average growth rates of pension fund assets and GDP over the period 2001-11 in selected OECD countries
AUS AUT BEL CAN CZE DNK FIN DEU HUN ISL IRL ISR ITA JPN MEX NLD NZL NOR POL PRT ESP CHE GBR USA -10 -5 0 5 10 15 20 25 0 20 40 60 80 100 120 140 160 D if fe re nc e in gr ow th ra te s of pe ns ion a ss e ts and G D P 2011 assets as a % of GDP
Note: The vertical dashed line gives the OECD weighted average pension fund assets as a percentage of GDP, while the horizontal dashed line shows the OECD weighted average of the difference in growth rates of pension fund assets and GDP. Countries in the upper right quadrant are “moving ahead” because both their assets and the rate at which they are growing are above the OECD average. Countries in the bottom left quadrant are “falling behind” because they are below the OECD average on both counts.
Figure 10. Pension funds' average annual growth rate in total assets over 2001-2011 in selected OECD countries In per cent 3.3 3.9 6.1 6.4 6.9 7.4 8.2 9.8 10.5 10.9 11.4 11.6 11.6 12.4 12.4 12.7 13.7 14.3 14.4 15.4 15.6 16.8 17.5 25.9 32.6 95.4 0 20 40 60 80 100 Portugal United States Belgium Total OECD (7) Japan (6) United Kingdom (5) Ireland (4) Hungary Iceland Netherlands Canada Germany Switzerland (3) New Zealand (1) Finland Spain Austria Denmark Norway Israel Italy Mexico (2) Australia (1) Czech Republic Poland Estonia
Note: See page 23 for methodological notes.
Source: OECD Global Pension Statistics.
Figure 11. Trends in pension fund assets: OECD countries with mature markets, 2001-2011
As a percentage of GDP 0 20 40 60 80 100 120 140 2001 2002 2003 2004 2005 2006 2007 2008 2009 2010 2011 Netherlands Iceland Switzerland Australia (1) United Kingdom Finland United States Canada Chile Denmark Israel Ireland (2) Japan (3)
Note: See page 23 for methodological notes.
Figure 12. Trends in pension fund assets: OECD countries with growing markets, 2001-2011 As a percentage of GDP 0 2 4 6 8 10 12 14 16 2001 2002 2003 2004 2005 2006 2007 2008 2009 2010 2011 Poland Mexico (1) Slovak Republic (2) Spain Czech Republic Germany Estonia Italy Korea Slovenia Note: See page 23 for methodological notes.
Source: OECD Global Pension Statistics.
Figure 13. Trends in pension fund assets: OECD countries with sluggish markets, 2001-2011 As a percentage of GDP 0 2 4 6 8 10 12 14 16 18 2001 2002 2003 2004 2005 2006 2007 2008 2009 2010 2011 New Zealand (1) Portugal (2) Norway Austria Belgium Hungary (3) Turkey Luxembourg France (4) Greece
Note: See page 23 for methodological notes.
INVESTMENTS
Pension fund allocations to public equities are at historical lows. The highest allocation was
Australia's at slightly under 50%.
The allocation to shares fell in 2011 in most countries. No country had equity portfolios accounting for more than half of total pension fund assets, Australia being the highest at 49.7% (see Figure 14). Other countries where equities outweigh bonds in pension fund portfolios include the United States (26.0% in bonds vs. 48.1% in equities) and Finland (35.4% in bonds vs. 41.3% in equities). These asset allocations contrast with the situation in 2001, when three countries had equity allocations above 50% (Ireland, the United Kingdom and the United States).
Between 2001 and 2011, across the selected countries among the OECD area in Table 1, the share of assets invested in bonds remained stable on average while the share invested in equities declined by 3.5 percentage points to a simple average of 24.0% of total assets1. The decline in equities was offset by an
increase in allocations to alternative investments and monetary instruments. In some OECD countries like Denmark and the Netherlands, the reduction in equity allocations was largely offset by increasing bond allocations.
As Table 1 shows, the countries that saw the biggest reallocation of assets to bills and bonds relative to total portfolios over the period 2001-2011 were: Denmark, an increase of 14.3 percentage points from 52.3% in 2001 to 66.6% in 2011; Estonia, a 7.5 percentage point increase from 48.0% in 2001 to 55.6% in 2011; and the Netherlands, a 5.9 percentage point rise from 36.2% in 2001 to 42.1% in 2011. Conversely, pension funds reduced their equity allocations in Denmark, Estonia, Iceland, Japan, the Netherlands and Spain. Finland and Mexico experienced the biggest rebalancing towards equities, with respectively 13.3 and 17.6 percentage point increases.
During 2011, pension funds in many countries also shifted their geographical allocation to reduce exposure to countries deemed to be risky. This was the case for instance in Slovakia where pension fund exposure to debt from the European periphery fell by 3 percentage points, to 4.5%. The flight to safety also translated into a drop in foreign exposure among
1 The decline in the share of assets invested in equities among the selected OECD countries was bigger when considering the weighted average (decline from 49.7% in 2001 to 40.9% of total assets in 2011). This difference with the simple average stems from the United States which experienced a decrease of 6.5 percentage points in equities allocation to reach a share of 48.1% of total assets in 2011."
pension funds. This has been particularly marked in countries like Chile, Denmark, the Netherlands and the Slovak Republic, which experienced drops in assets invested abroad ranging from 8 to 10 percentage points between 2010 and 2011.
Foreign investment in entities located abroad (including investment in local currencies) tends to be greater in countries that belong to the euro area. As shown in Figure 15, of the OECD sample surveyed, Estonia, Luxembourg and Portugal have the most internationally diversified pension fund portfolios, with respectively 76.4%, 56.7% and 55.4% of total assets issued by entities located abroad, and the share of assets issued by entities located abroad has increased since 2001 in both Estonia and Portugal (see Table 1). Other countries with high investment in foreign-based entities include the Netherlands (42.9% of total investment), the Slovak Republic (41.6%), Slovenia (41.5%) and Switzerland (37.8%). On the other hand, five out of the eighteen countries for which such information was available invest relatively little in foreign assets or securities denominated in foreign currencies (less than 15% of total assets).
Figure 14. Pension fund asset allocation for selected investment categories in selected OECD countries, 2011
As a percentage of total investment
0% 10% 20% 30% 40% 50% 60% 70% 80% 90% 100% Australia (2) United States Finland Chile (3) Belgium Netherlands Canada (4) Poland Norway Switzerland Austria (5) Portugal Iceland Mexico (6) Italy (7) Luxembourg Denmark Turkey Spain Hungary Japan (8) Estonia Israel Germany (9) Slovenia Slovak Republic Greece Czech Republic Korea (10)
Shares Bills and bonds Cash and Deposits Other (1)
Note: See page 24 for methodological notes.
Source: OECD Global Pension Statistics.
Table 1. Variation in asset allocation for selected investment categories and in foreign investment in selected OECD countries, 2001- 2011
In percentage points
Country Shares Bills and bonds
Assets issued by entities located abroad Denmark -31.3 14.3 -12.6 Japan (1) -18.5 -3.4 -3.7 Netherlands -14.3 5.9 .. Iceland -10.8 2.1 .. Spain -10.6 1.4 .. Estonia -10.5 7.5 48.0 Canada -9.1 2.7 7.5 Czech Republic -6.9 2.8 9.4 United States -6.5 4.7 .. Belgium -4.6 11.5 .. Switzerland -2.2 4.1 33.3 Portugal 1.6 -4.3 8.1 Poland 2.3 -5.6 .. Norway 3.1 5.5 .. Israel 3.7 -12.1 11.0 Australia 7.8 -2.5 .. Austria 9.6 -26.1 .. Finland 13.3 -16.2 .. Mexico 17.6 -18.3 .. Simple average -3.5 -1.4 12.6
Note: See page 24 for methodological notes.
Figure 15. Foreign investment of pension funds in selected OECD countries, 2011 As a percentage of total assets
76.4 56.7 55.4 42.9 41.6 41.5 37.8 36.5 29.6 26.8 26.8 24.9 19.8 13.9 11.0 8.4 0.8 0.5 0 20 40 60 80 100 Estonia Luxembourg Portugal Netherlands Slovak Republic Slovenia Switzerland Chile Canada Norway Denmark Iceland Japan (1) Czech Republic Israel Mexico Turkey (2) Poland
Note: See page 24 for methodological notes.
Source: OECD Global Pension Statistics.
A departure from traditional investment products towards alternative assets1.
Drawing on the data collected in connection with the OECD Large Pension Funds 2011 Survey2, the
evidence suggests that, although in most cases, pension funds have so far preferred to take a cautious, incremental approach to alternative
investments, some investors have allocated
considerable resources to alternative assets, reflecting pension fund‟s growing appetite for diversification. This seems prudent, given pension fund fiduciaries‟ concerns over the lack of transparency in some investments and the scarcity of long-term, robust, performance data. The crisis is also prompting pension funds to reconsider their alternative investments (hedge funds, private equity, commodities, etc.) and strengthen their governance and risk controls.
1 While there is no official definition of alternative assets, the term is usually applied to instruments other than listed equities, bonds, and cash. For the purposes of this survey, “alternative” investments comprise the following types of investments: hedge funds, private equity, real estate, infrastructure, commodities and “other” (“other” includes: timber and currency/interest rate overlays).
2
For further details see: Large Pension Funds 2011 Survey.
Altogether, for the 2011 survey, data has been received from 52 institutional investors3 from more
than 20 countries around the world including some non OECD countries such as Brazil, Colombia, Peru and South Africa, accounting for over USD 7 trillion of assets under management related to infrastructure investment. Based on the information provided by 28 pension funds, total investment in infrastructure at the end of 2010, considered as direct exposure, was USD 41.8 billion, which represents 2.9 % of total assets surveyed (USD 1.4 trillion). Of the total allocation, the largest portion, representing USD 37.9 billion or 2.6%, relates to unlisted equity (i.e. infrastructure funds or direct investment), while USD 3.9 billion or 0.3% relates to fixed income (i.e. infrastructure project bonds or loans). If we consider total assets under management for the complete survey (i.e. 52 funds in total with USD 7.7 trillion assets under management) infrastructure investment of USD 41.8 billion represents 0.5% of the total.
3The survey is part of the recently launched OECD project “Institutional Investors and Long Term Investment”. Going forward, the survey would be extended to more funds and countries as well as to other institutional investors (e.g. Insurers and Sovereign Wealth Funds), providing insights and detailed investment information which complement the administrative data gathered at the national level. See also,
Policies to further develop private pension systems are needed in some OECD countries.
Figure 16 below compares the importance of pension fund assets in the economy with the benefits that the public pension system is expected to pay to a worker entering the labour force in 2008 and earning the average wage. It shows a group of countries, such as Australia, Canada, Chile, Denmark, Iceland, Israel, Ireland, the Netherlands, Switzerland, the United Kingdom and the United States, with large pension fund asset pools that have correspondingly low public pension replacement rates (bottom right-hand quadrant). Most countries are, however, on the left-hand side of the graph, with small pools of assets, and either low (e.g., Estonia, Mexico, Poland, the Slovak Republic) or high (e.g., Austria, Greece, Spain, Turkey) replacement rates.
Some countries – those in the lower left-hand quadrant such as Mexico, New Zealand, Poland and the Slovak Republic – have recently reformed their pension systems, introducing mandatory private plans, and will therefore experience relatively faster growth in pension fund assets in the years to come. However, in another group of countries, including Belgium, Germany and Japan, pension funds are voluntary. The combination of low public pension replacement rates and low ratios of pension fund assets to GDP could be a sign of retirement income inadequacy. However, a more precise picture can be obtained only by factoring in the level of ageing, the labour force coverage of the private pension system and access to other means of retirement savings.
BENEFITS AND CONTRIBUTIONS
Benefit payments have been increasing slowly and steadily over the last few years.
As Figure 17 shows, in 2011 pension fund benefit payments in relation to GDP were highest in Finland (10.4%), followed by Switzerland (5%), Iceland (4.8%), Australia (4.5%), the Netherlands (4.2%) and Canada (2.8%). These are also countries where private pensions are mandatory or quasi-mandatory, which explains the large size of pension fund expenditure in relation to the size of the economy. In other countries where private pensions are mandatory (e.g., Mexico, Poland and the Slovak Republic), benefit payments are also expected to grow rapidly in future years as the generations contributing to the new system start retiring.
In most OECD countries, benefit payments have increased slowly but steadily over the last few years as a result of the growing size of the retiree population. As a percentage of GDP, benefit growth has also been relatively stable, with major increases observed only in countries like Finland (from 8.5% in 2001 to 10.4% in 2011) and Iceland (from 2.9% in 2001 to 4.8% in 2011). Benefits should increase at a faster rate over the next few years as the baby boom generation starts to retire in large numbers.
Figure 16. Pension fund assets compared with the public pension system's gross replacement rate, 2011
AUS AUT BEL CAN CHL CZE DNK EST FIN FRA DEU GRC HUN ISL IRL ISR ITA JPN KOR LUX MEX NLD NZL NOR POL PRT SVK SVN ESP CHE TUR GBR USA 0 10 20 30 40 50 60 70 80 90 100 0 20 40 60 80 100 120 140 G ros s re pl ac e m e nt r at e f rom t he publ ic s ys te m (% )
Pension fund assets as a % of GDP
Source: OECD Global Pension Statistics and OECD Pensions at a Glance 2011.
Note: Public pension system refers to pay-as-you-go financed (PAYG) pension plans. These results do not take into account the recent reforms in many OECD countries, in particular the reform in Greece, where gross replacement rates will be considerably reduced. Updated figures will be available in Pensions at a Glance 2013. The vertical dashed line gives the OECD simple average of assets as a percentage of GDP, while the horizontal dashed line gives the OECD simple average of public gross replacement rates.
Figure 17. Pension fund benefits for selected OECD countries, 2001-2011 As a percentage of GDP 0 2 4 6 8 10 12 2001 2011
Note: See page 24 for methodological notes.
In many OECD countries, private pension arrangements already provide a major supplement to benefits from public pension systems for current retirees.
Pension systems vary across countries, and no single model fits all. Generally there is a mix of public and private provision. Public pensions are statutory, most often financed on a pay-as-you-go (PAYG) basis and managed by public institutions. Private pensions are in some cases mandatory but more usually voluntary, funded, employment-based (occupational) pension plans or individual retirement savings plans (personal pensions). As shown in Figure 18, private pension benefits paid (i.e. benefits paid by any types of private pension arrangements, not only autonomous pension funds) in 2011 in Canada, Denmark, Korea and the Netherlands were below, but close to, the total benefits paid by the public pension system in 2007. In Australia and Iceland, private pension benefits dominate retirement income provision. Public spending on old-age benefits averaged 7.0% of GDP in 2007, compared with private pension benefits of averaging 2.2% of GDP in 2011 (in the countries for which data are available). Public spending on old-age pensions is highest – greater than 10% of GDP – in Germany, Greece, Italy, Poland and Portugal. Private expenditure on old-age benefits is highest in Australia, Belgium, Canada, Denmark,
Iceland, the Netherlands and Switzerland, where it exceeds 2.8% of GDP. However, private benefit spending is so far negligible in around a third of the OECD countries.
Pension fund contributions grew substantially between 2001 and 2011 in the Netherlands and Canada.
Like benefits, ratios of pension fund contributions-to-GDP exhibited wide disparities across countries. As shown in Figure 19, there was a clear divide between the four countries with ratios above 6% and the eleven whose ratios were below 2%, with only four countries in the middle: New Zealand (2.3%), Israel (2.4%), Canada (2.9%) and the Netherlands (4.9%). Countries that experienced substantial increases in contributions included those with large defined benefit systems (e.g., Canada, the Netherlands). In Canada pension fund contributions as a percentage of GDP grew from 1.5% in 2001 to 2.9 % in 2011. In the Netherlands, they grew from 2.8% to 4.9% over the same period. Contributions have risen over the last decade in these and other countries with large DB systems as a result of efforts to improve the funding situation of pension plans. The establishment of new defined contribution pension plans also accounts for the rapid growth in contributions in Canada as well as other countries such as Israel and New Zealand. Figure 18. Public and private expenditure on pensions in selected OECD countries, 2011 (or latest year available)
As a percentage of GDP 0 2 4 6 8 10 12 14 16 Private Public
Note: See page 24 for methodological notes.
Figure 19. Pension fund contributions for selected OECD countries, 2001-2011 As a percentage of GDP 0 2 4 6 8 10 12 2001 2011
Note: See page 24 for methodological notes.
Source: OECD Global Pension Statistics.
PENSION FUNDS IN SELECTED NON-OECD
COUNTRIES
Non-OECD pension fund markets (see Table, page 21), although small in comparison to those of the OECD area (USD 0.9 trillion vs. USD 19.2 trillion in 2010), have grown rapidly in recent years (see Figure 20). Pension markets in non-OECD economies nevertheless remain underdeveloped in comparison to OECD markets, as indicated in Figure 21 by their generally low assets-to- GDP ratios in 2011. Hong Kong‟s high assets-to-GDP ratio of 32.5% reflects the fact it has the most mature pension system. Pension markets in all the other non-OECD economies, for which we received data, are smaller relative to their economies. Three countries had ratios between 10% and 20% - Colombia at 17.0%; Peru at 16.9%; and Brazil at 13.8%. In the remaining 12 non-OECD countries, for which we received data, ratios were less than 10%.
However, pension assets in non-OECD economies grew much faster than those in OECD countries. For example, the average growth rate between 2006 and 2011 was 2.1% in the G20 countries and 6.4% in the Euro area, while this ratio was much higher in the Latin American countries (7.5%) and BRICS (10.6% over 2006-2010).
As in the OECD countries, bonds and equities are the main asset classes in which pension funds in non-OECD economies invest, with bonds traditionally playing a bigger role. In most countries, bonds and bank deposits accounted for more than one-half of total assets in 2011 (see Figure 22). Two countries had pension fund equity portfolios accounting for more
than 40% of total assets, Hong Kong being the highest at 55% followed by Peru at 43.9%.
Figure 20. Top pension funds assets by regions, 2006-2011 In billions of USD 0 5000 10000 15000 20000 25000 Total OECD Total selected non-OECD (1) Total G20 (2)
Euro area BRICS (1) Latin America
Asia
2006 2011
Note: See page 25 for methodological notes.
Figure 21. Importance of pension funds relative to the size of the economy in selected non-OECD countries, 2011
As a percentage of GDP 32.5 17.0 16.9 15.1 13.8 8.7 7.0 6.1 5.9 3.6 3.2 1.8 1.2 0.8 0.2 0.1 0.0 0.0 0 10 20 30 40
Hong Kong (China) Colombia Peru Weighted average Brazil Costa Rica Simple average Bulgaria Thailand Former Yug. Rep. of Macedonia Russian Federation (1) Indonesia Romania Latvia India (2) Ukraine Pakistan Albania
Note: See page 25 for methodological notes.
Source: OECD Global Pension Statistics.
Figure 22. Pension fund asset allocation for selected investment categories in selected non-OECD countries, 2011
0% 10% 20% 30% 40% 50% 60% 70% 80% 90% 100%
Hong Kong (China) Peru (2) Malta Colombia Brazil Pakistan Kenya (3) Former Yug. Rep. of Macedonia Ukraine Indonesia Jamaica Nigeria Bulgaria (4) Romania Thailand Serbia Latvia Costa Rica Albania India (5) Namibia (6)
Shares Bills and bonds Cash and Deposits Other (1)
Note: See page 25 for methodological notes.
Pension funds experienced an annual average real rate of investment returns (in local currency and after investment management expenses) of -3.4% ranging widely from 5.6% for the highest performer (Ukraine) to -24.2% for the lowest (Kenya) (see Figure 23). In Kenya, the sharp decline in industry assets was driven by short term volatility including the steep drop in the Nairobi Securities Exchange during the period as well as the
sharp rise in interest rates on Government Securities which resulted in a drop in the value of the lower yielding securities already held by the industry.
Distortion caused by inflation explained the poor performance in many of the selected non-OECD countries, as shown by the 5-percentage point difference between the real and nominal rates of investment returns.
Figure 23. Calculated average real net investment return of pension funds in selected non-OECD countries, 2011
In per cent -24.2 -16.1 -8.1 -6.6 -6.3 -3.7 -3.4 -3.0 -2.6 -2.3 -1.3 -1.2 -0.9 -0.7 -0.3 0.1 2.0 4.1 5.6 -30 -20 -10 0 10 Kenya
Hong Kong (China) (1) Weighted average Latvia Nigeria Colombia Simple average Bulgaria India Malta Serbia Pakistan Former Yug. Rep. of Macedonia Thailand Romania Namibia Indonesia Costa Rica Ukraine -3.1 2.2 Real Dec 2010 - Dec 2011 Nominal Dec 2010 - Dec 2011
Note: See page 25 for methodological notes.
TABLE OF PENSION FUNDS' TOTAL INVESTMENT BY COUNTRY, 2001-2011
2001 2002 2003 2004 2005 2006 2007 2008 2009 2010 2011 Australia (1) 268.2 281.4 348.9 443.4 548.9 658.9 964.4 916.8 811.7 1,066.2 1,340.0 Austria 5.7 7.9 10.6 12.9 14.6 16.0 18.0 18.3 19.5 20.2 20.5 Belgium 12.8 12.4 12.2 14.4 16.5 16.8 20.3 16.7 19.2 17.6 21.7 Canada 375.6 354.6 447.0 534.9 659.9 807.8 888.6 772.4 806.4 1,017.7 1,106.1 Chile .. 37.0 42.7 55.6 68.4 89.0 105.6 89.5 106.6 136.3 145.5 Czech Republic 1.4 2.1 2.9 3.9 5.2 6.5 8.2 11.2 11.3 12.2 14.0 Denmark 43.6 45.3 60.6 75.3 87.0 89.6 100.9 161.6 134.0 154.4 165.7 Estonia 0.0 0.0 0.1 0.2 0.4 0.6 1.0 1.1 1.3 1.4 1.6 Finland 62.0 66.7 88.8 117.0 134.1 149.5 174.0 164.8 184.8 196.1 199.8 France (2) .. .. .. .. 0.4 1.0 1.9 2.7 4.2 5.3 6.7 Germany 65.1 70.5 88.9 104.1 112.5 122.8 154.5 172.4 175.5 178.6 195.4 Greece .. .. .. .. .. .. 0.0 0.0 0.1 0.1 0.1 Hungary (3) 2.1 3.0 4.4 7.0 9.3 11.0 15.1 14.9 16.9 19.1 5.3 Iceland 6.6 7.5 10.8 14.1 19.5 21.7 26.7 19.0 14.4 15.6 18.1 Ireland (4) 45.8 42.2 62.7 77.4 96.8 110.1 118.6 92.9 100.3 100.0 100.6 Israel 28.6 28.3 30.5 33.0 42.0 45.1 54.4 85.4 90.7 106.4 120.1 Italy 25.1 28.2 36.8 44.2 49.5 56.0 68.7 78.5 86.8 93.8 106.9 Japan (5) 756.0 999.8 1,208.3 1,187.3 1,262.7 1,151.4 1,124.0 1,124.3 1,342.0 1,385.3 1,470.3 Korea .. 8.4 9.9 11.5 14.7 26.6 29.8 27.8 29.6 40.1 49.7 Luxembourg (6) .. .. .. 0.1 0.4 0.4 0.5 0.6 1.2 1.1 1.2 Mexico (7) 26.6 33.6 37.2 42.7 76.4 96.5 103.0 110.2 104.3 131.8 149.0 Netherlands 411.3 374.9 545.3 659.7 769.6 843.0 1,058.2 979.9 944.2 1,006.8 1,157.3 New Zealand (1) 7.7 7.9 9.1 11.2 12.4 13.1 14.5 13.6 13.8 19.6 24.7 Norway 9.4 10.6 14.6 16.9 20.3 22.9 27.4 27.2 27.9 32.1 36.0 Poland 4.6 7.6 11.6 17.1 26.5 38.0 51.1 57.9 58.1 74.0 77.4 Portugal (8) 13.3 14.7 18.4 18.9 23.6 26.6 30.6 29.7 30.4 26.1 18.4 Slovak Republic (9) 0.0 0.0 0.0 .. 0.3 1.7 3.1 4.6 5.5 6.5 8.1 Slovenia (10) .. .. 0.1 0.3 0.5 0.6 0.9 1.0 1.3 1.4 1.7 Spain 35.1 39.1 54.8 69.1 81.5 92.5 118.5 114.2 118.2 111.2 116.1 Sweden 18.3 18.5 23.5 26.4 33.2 36.4 39.5 35.3 33.4 43.9 .. Switzerland (11) 261.4 267.6 334.8 389.5 434.7 465.4 504.6 497.0 551.4 595.8 703.9 Turkey (12) .. .. .. 1.5 3.2 4.0 7.9 10.9 14.0 17.2 17.0 United Kingdom (13) 1,040.5 930.8 1,175.3 1,467.1 1,763.8 2,002.1 2,186.5 1,698.8 1,753.0 1,990.9 2,129.5 United States 7,205.8 6,584.7 7,915.7 8,607.6 9,262.7 10,418.1 10,940.0 8,223.9 9,591.5 10,585.9 10,584.2Selected non-OECD countries
Albania (14) .. .. .. .. .. .. 0.0 0.0 0.0 0.0 0.0 Argentina (15) .. 12.6 16.2 18.5 23.4 29.3 30.4 0.0 0.0 0.0 0.0 Bolivia (16) .. 1.2 1.5 1.7 2.1 2.3 2.8 3.9 4.6 .. .. Brazil .. .. .. .. .. 194.8 224.2 224.9 242.9 306.5 308.2 Bulgaria 0.1 0.2 0.3 0.5 0.7 1.0 1.6 1.7 2.3 2.7 3.0 China .. .. .. 6.0 8.3 11.4 20.0 .. 37.1 41.5 .. Colombia 4.9 6.3 7.1 10.1 16.7 18.4 31.2 35.1 30.9 46.3 54.0 Costa Rica 0.5 0.8 1.1 0.9 1.2 1.5 1.6 2.1 2.3 2.8 3.5 Croatia .. 0.3 0.8 1.5 2.0 .. .. .. .. .. .. Dominican Republic (16) .. .. 0.0 0.1 0.4 0.6 1.0 1.4 1.9 2.4 .. Egypt .. .. .. .. .. .. .. 4.0 .. .. .. El Salvador (16) .. 9.3 13.8 18.8 25.3 29.3 34.6 4.5 5.0 5.5 .. Hong Kong (China) 24.3 27.5 29.1 38.2 44.1 52.7 64.4 60.0 67.4 78.1 79.5 India (17) .. .. .. .. .. .. .. .. .. 3.3 2.8 Indonesia (18) .. 4.3 5.5 6.2 6.3 8.2 9.6 .. .. 11.5 15.1 Jamaica .. .. .. 1.6 .. 2.0 2.5 2.7 2.5 3.0 3.3 Kenya 1.1 1.3 1.6 1.8 2.4 3.2 .. 3.9 4.0 5.3 5.1 Latvia 0.0 0.0 0.1 0.1 0.2 0.3 .. .. 0.2 0.2 0.2 Lesotho .. .. .. .. .. .. .. .. .. .. 0.3 Liechtenstein .. .. .. .. .. .. 1.9 2.1 2.5 .. .. Former Yug. Rep. of Macedonia .. .. .. .. .. .. 0.1 0.1 0.2 0.3 0.3 Malta .. .. .. .. .. .. .. .. .. .. 0.0 Mauritius 1.9 2.1 2.7 3.1 3.3 .. .. .. .. .. .. Namibia .. .. .. .. .. .. .. .. .. 9.6 8.5 Nigeria .. .. .. .. .. .. 1.8 2.5 9.3 13.5 15.4 Pakistan .. .. .. .. .. .. 0.0 0.0 0.0 0.0 0.0 Panama (16) .. .. .. .. .. .. .. .. 85.8 .. .. Peru 3.6 4.5 6.4 7.6 9.9 14.1 19.6 17.4 23.3 31.1 30.5 Romania .. .. .. .. .. .. 0.0 0.4 0.8 1.5 2.1 Russian Federation (19) .. .. .. .. .. 8.9 12.5 12.1 17.9 28.5 54.7 Serbia .. .. .. .. .. 0.0 0.1 .. 0.1 0.1 0.2 South Africa 97.1 82.3 120.2 169.0 201.9 239.4 275.2 238.7 221.2 300.3 .. Suriname .. 0.2 0.1 0.2 0.2 0.3 .. .. .. .. .. Thailand 5.0 5.7 6.9 7.6 8.6 10.3 12.8 14.0 15.1 18.2 19.5 Trinidad and Tobago .. .. .. .. .. 3.4 3.7 .. .. .. .. Ukraine .. .. .. .. .. .. .. 0.1 .. 0.1 0.2 Uruguay (16) .. 1.1 1.3 1.5 2.1 2.6 3.1 2.9 5.1 6.7 .. Zambia 0.1 0.2 0.3 0.2 0.3 .. .. .. .. .. .. Regional indicators Total OECD 10,732.3 10,285.4 12,606.3 14,064.5 15,651.7 17,441.3 18,960.9 15,575.2 17,203.5 19,210.6 20,112.7 Total G20 (20) 9,859.9 9,391.4 11,409.9 12,644.1 13,994.7 15,836.9 17,041.2 13,614.5 15,238.1 17,204.4 17,535.7 Euro area 676.1 656.6 918.6 1,118.4 1,300.7 1,437.5 1,768.7 1,677.5 1,692.5 1,766.2 1,956.0 Latin America 35.6 106.7 127.3 159.4 226.3 484.0 563.5 494.5 615.4 672.3 694.1 Asia 813.9 1,074.1 1,290.3 1,291.3 1,389.8 1,318.7 1,335.5 1,334.5 1,613.8 1,730.2 1,828.8 Total World 10,870.8 10,445.2 12,821.1 14,359.9 16,011.1 18,075.3 19,715.7 16,209.7 17,985.9 20,129.6 20,719.3 USD billions OECD countries
METHODOLOGICAL NOTES
NOTES TO BE TAKEN INTO CONSIDERATION WHEN INTERPRETING THE DATAThe primary source of this report is provided by national pension authorities through the OECD Global Pension Statistics’ project. Within this project, the original data are official administrative data collected and revised on an on-going basis to reflect the most recent figures for every past year.
Data includes pension funds as per the OECD classification (Private Pensions: OECD Classification and Glossary, available
at www.oecd.org/daf/pensions). All types of plans are included (occupational and personal, mandatory and voluntary) covering
both public and private sector workers.
General notes
The statistical data for Israel are supplied by and under the responsibility of the relevant Israeli authorities. The use of such data by the OECD is without prejudice to the status of the Golan Heights, East Jerusalem and Israeli settlements in the West Bank under the terms of international law.
Data for Germany refer only to Pensionskassen and Pensionsfonds.
Conventional signs: "n.d.", "..": not available.
Figure 2:
Data have been calculated using a common formula for the average nominal net investment return (ratio between the net investment income at the end of the year and the average level of assets during the year). Average real net investment returns have been calculated using the nominal interest rate (as described above) and the variation of the end-of-period consumer price index between 2010 and 2011 for all countries, except for Austria, Estonia, Korea and the United States, for which values have been provided by the countries. The 2010-Q2 and 2011-Q2 consumer price index have been used for Australia and New Zealand.
1. The average rates of return are calculated over the period June 2010-June 2011. 2. The average rates of return are calculated for personal pension plans only. 3. Source: Bank of Japan.
4. The financial result (i.e. the sum of result on investment and the realized and unrealized profits/losses on investment/valuation of investment and the income from the coverage of the deficit) is used as a proxy for net investment income.
OECD-calculated average rate of investment returns Calculation methods for the average investment returns (IRR) of pension funds
vary greatly from country to country, hindering the international comparability of these statistics. With a view to increasing data comparability across countries, the OECD therefore decided that it would be worth applying the same calculation method for IRR across countries, which would be calculated by the OECD, using variables already collected in conjunction with the framework of the Global Pension Statistics exercise. In order to reach a consensus on the most appropriate formula for the IRR calculation, an electronic discussion group has been created, composed of selected country experts (representing Australia, Germany, the Netherlands, Portugal, and Spain).
Drawing on preliminary consultations, five formulas have been proposed by the OECD Secretariat to the electronic discussion group for comments. A consensus has been reached within the group and subsequently endorsed within the OECD Task Force on Pension Statistics on the following formula for the average IRR, in each year N:
100 )/2 Investment Total Investment (Total Income Investment Net IRR average Calculated N 1 N N N
Net investment income comprises income from investments, value re-adjustments on investments and income from realised and unrealised capital gains and losses. It includes rents receivable, interest income, dividends and realised and unrealised capital gains, before tax and after investment expenses.
This formula has been used to produce Figure 2 and Figure 23. Because countries may use a different calculation method for the average IRR, it should be noted that there might be discrepancies between the OECD-calculated average IRRs and the ones published by these countries.
Figure 3:
1. Data refer to the first trend calculations for the year 2011. 2. Data refer to the end of June 2011.
3. The figure for total assets at the end of 2011 is an early estimate based on the 2010 level of assets and the flow of transactions in 2011. It does not take into account value changes. A 2011 final estimate will be available in January 2013. 4. Source: IAPF Pension Investment Survey.
5. Source: Bank of Japan.
6. Data refer only to pension funds supervised by the Securities Market Agency of Slovenia. 7. Data for occupational pension plans refer to 2010.
Calculations are performed on countries for which data are available in 2001 and 2011. 1. Data refer to the first trend calculations for the year 2011.
2. Data refer to the end of June of each year. 3. Source: Bank of Japan.
4. The figure for total assets at the end of 2011 used in the formula is an early estimate based on the 2010 level of assets and the flow of transactions in 2011. It does not take into account value changes. A 2011 final estimate will be available in January 2013.
Figure 5:
Countries where private pension plans are financed exclusively by autonomous pension funds include Chile, the Czech Republic, Japan and the Slovak Republic.
1. Data refer to 2010.
2. Technical provisions were considered as a proxy for the total assets of book reserve schemes.
Figure 6:
1. Data refer to June.
2. Data refer to occupational plans only.
3. Pension plans in Germany can actually be traditional DB plans or hybrid DB plans, but the split between the two categories is not available.
Figure 7:
Data include the countries for which the split of assets between DB and DC plans is available in both 2001 and 2011 ( Canada, the Czech Republic, Denmark, Estonia, Finland, Germany, Hungary, Israel, Italy, Mexico, New Zealand, Norway, Poland, Portugal, the Slovak Republic, Switzerland and the United States).
Figure 8:
1. Data refer to occupational plans only. 2. Data refer to June of each year.
Figure 9:
The three characters refer to ISO country codes. The list of ISO country codes is given on the United Nation Statistics Division internet page, „Countries and areas, codes and abbreviations‟ at the following address:
http://unstats.un.org/unsd/methods/m49/m49alpha.htm .
Figure 10:
Data refer to the period 2001-2011. Due to a break in series, the average annual growth rate reached 351.9% for Slovak Republic. Therefore, this country was not presented in the figure and was not included in Total OECD.
1. Data refer to the end of June.
2. Data only refer to personal pension plans.
3. Data refer to the first trend calculations for the year 2011. 4. Source: IAPF Pension Investment Survey.
5. The figure for total assets at the end of 2011 is an early estimate based on the 2010 level of assets and the flow of transactions in 2011. It does not take into account value changes. A 2011 final estimate will be available in January 2013. 6. Source: Bank of Japan.
7. Total OECD is the average growth rate in total assets (expressed in millions of USD) over 2001-2011 in OECD countries selected for this chart.
Figure 11:
1. Data refer to the end of June of each year. 2. Source: IAPF Pension Investment Survey. 3. Source: Bank of Japan.
2. In 2011, pension fund activity under ISP supervision decreased by about 33%, considering aggregate assets under management, reflecting the transfer of bank pension funds (i.e. pension funds sponsored by banks, which have as beneficiaries the employees of their banks) to the Public Retirement System.
3. As a result of pension reform, the assets of mandatory pension funds decreased in 2011, while voluntary pension fund assets did not change significantly.
4. Data refer to PERCO plans. Data for 2011 refer to June (source: AFG).
Figure 14:
The GPS database provides information about investments in Collective Investment Schemes and the look-through Collective Investment Schemes in cash and deposits, bills and bonds, shares and other. When the look-through was not provided by the countries, estimates were made assuming that mutual funds' investment allocations between cash and deposits, bills and bonds, shares and other was the same as pension funds' direct investments in these categories. Therefore, asset allocation data in this Figure include both direct investment in shares, bills and bonds and indirect investment through Collective Investment Schemes.
1. The "Other” category includes loans, land and buildings, unallocated insurance contracts, hedge funds, private equity funds, structured products, other mutual funds (i.e. not invested in cash, bills and bonds, shares or land and buildings) and other investments.
2. Source: Australian Bureau of Statistics. The high value for the "Other" category is driven mainly by net equity of pension life office reserves (15% of total investment).
3. Other investments include market or fair value of derivatives held.
4. The high value for the "Other" category is driven mainly by other mutual funds (14% of total investment). 5. Other investments include derivatives at market value and outstanding accounts against plan sponsors. 6. Other investments include foreign assets issued by entities located abroad.
7. The high value for the "Other" category is driven mainly by unallocated insurance contracts (22% of total investment). 8. Source: Bank of Japan. The high value for the "Other" category is driven mainly by accounts payable and receivable (25%
of total investment) and outward investments in securities (20% of total investment).
9. The high value for the "Other" category is driven mainly by other mutual funds (18% of total investment).
10. The high value for the "Other" category is driven mainly by unallocated insurance contracts (31% of total investment).
Table 1:
The GPS database provides information about investments in Collective Investment Schemes and the look-through Collective Investment Schemes in cash and deposits, bills and bonds, shares and other. When the look-through was not provided by the countries, estimates were made assuming that mutual funds' investment allocation in cash and deposits, bills and bonds, shares and other was the same as pension funds' direct investments in these categories. Therefore, the variation in asset allocation in this table includes both direct investment in shares, bills and bonds and indirect investment through Collective Investment Schemes.
1. For Japan, between 2001 and 2011, unlike equities and bills and bonds, the share of assets invested in payable and receivable accounts increased by 24.6%.
Figure 15:
1. Source: Bank of Japan.
2. Data refer only to personal pension plans.
Figure 16:
The three characters refer to ISO country codes. The list of ISO country codes is given on the United Nation Statistics Division internet page, „Countries and areas, codes and abbreviations‟ at the following address:
http://unstats.un.org/unsd/methods/m49/m49alpha.htm .
Figure 17:
Only countries for which data for both 2001 and 2011 are available are shown in the Figure.
1. There is a break in series in data collection in 2006 due to the inclusion of occupational pension plans registered by CONSAR since 2005, not included in previous years.
2. Data refer to the end of June of each year.
Figure 18:
For the purposes of this chart, all types of private pension plans are displayed.
Figure 19:
Only countries for which data for both 2001 and 2011 are available are shown in the Figure.
1. There is a break in series in data collection in 2006 is due to the inclusion of occupational pension plans registered by CONSAR since 2005, not included in previous years. Total contributions include mandatory contributions for retirement from employees, employers, and government, and voluntary contributions and transfers from the previous pension system (valid until 1997).
1. Data refer to 2010 instead of 2011. 2. Excluding Saudi Arabia.
Figure 21:
1. Source: Ministry of Finance. Data refer only to the mandatory part of the Russian system.
2. In 2011, data refer to PFRDA regulated funds only. Data do not include EPFO regulated funds (i.e. the Employee Provident Fund, Employee Pension Fund, and Deposit Linked Insurance Fund).
Figure 22:
The GPS database provides information about investments in Collective Investment Schemes and the look-through Collective Investment Schemes in cash and deposits, bills and bonds, shares and other. When the look-through was not provided by the countries, estimates were made assuming that mutual funds' investment allocation in cash and deposits, bills and bonds, shares and other was the same as pension funds' direct investments in these categories. Therefore, asset allocation data in this Figure include both direct investment in shares, bills and bonds and indirect investment through Collective Investment Schemes.
1. The "Other" category includes loans, land and buildings, unallocated insurance contracts, hedge funds, private equity funds, structured products, other mutual funds (i.e. not invested in cash, bills and bonds, shares or land and buildings) and other investments.
2. Other investments include private investment funds.
3. The high value for the "Other" category is driven mainly by land and buildings (20% of total investment) and unallocated insurance contracts (11% of total investment).
4. Other investments comprise short-term receivables.
5. Other investments are the aggregate of Government Securities, State Development Loans and Current Assets. 6. The high value for the "Other" category is driven mainly by structured products (45% of total investment).
Figure 23:
Data have been calculated using a common formula for the average nominal net investment return (ratio between net investment income at the end of the year and the average level of assets during the year). Average real net investment returns have been calculated using the nominal interest rate (as described above) and the variation of the end-of-period consumer price index between 2010 and 2011 for all countries, except for Hong Kong, India, Kenya and Malta for which values have been provided by the countries.
1. Data refer to the MPF System only.
Table of pension funds' total investment by country, 2001-2011:
1. Data refer to the end of June of each year.
2. Data refer to PERCO plans. Data for 2011 refer to June (source: AFG).
3. As a result of pension reform, the assets of mandatory pension funds decreased in 2011, while voluntary pension fund assets did not change significantly. The combination of these two factors led to a remarkable shift of asset ratios between institutions.
4. Source: IAPF Pension Investment Survey. 5. Source: Bank of Japan.
6. The break in series in 2005 is due to the inclusion of pension funds supervised by the CSSF, not included in previous years. 7. The break in series in 2005 is due to the inclusion of occupational pension plans registered by the National Commission for
the Retirement Savings System (CONSAR) since 2005, not included in previous years.
8. In 2011, pension fund activity under ISP supervision decreased by about 33%, considering aggregate assets under management, reflecting the transfer of bank pension funds (i.e. pension funds sponsored by banks, which have as beneficiaries the employees of their banks) to the Public Retirement System.
9. The break in series in 2006 is due to the inclusion of voluntary pension plans, not included in previous years. 10. Pension fund data refer only to the Securities Market Agency of Slovenia.
11. Data refer to the first trend calculations for the year 2011. 12. Data for 2011 refer to 2010 for occupational pension plans.
13. The figure for total assets at the end of 2011 is an early estimate based on the 2010 level of assets and the flow of transactions in 2011. It does not take into account value changes. A 2011 final estimate will be available in January 2013. 14. The drop in total investment in 2011 is due to three factors: change in legislation, withdrawals and the unavailability of data
from one of the three funds, which has been operating under the old framework.
15. Source: AIOS. The drop in 2008 is due to a pension reform transferring pension funds' assets to the National Social Security Administration.
16. Source: AIOS.