Policy implications
Whereas public discussion to date has been virtually exclusively focused on demographic relationships, economic dependency ratios – the ratio of those actually in work to those drawing retirement and unemployment benefits – are much more important and should be brought to the fore in the pensions sustainability debate. Raising the effective employment rate, in quality jobs, is the most effective strategy with which countries can alleviate the financial burden of ageing. This requires a broad range of policies to, in particular, reduce unemployment, improve health protection and training, and increase the participation rates of older workers and women.
Public debate on the long-term financing viability of pension systems tends to be based substantially on demographic arguments, so that future shifts in the age structure of the population are frequently (mis)interpreted in terms of changes in the relationship between pensioners and the working population.
Thus, for example, a special report on pensions in The Economist of 9.4.2011 shows, with the aid of a number of figures, the extent to which the “dependency ratio” will alter over the coming decades. This point is made by showing the number of persons aged over 65 alongside the number of persons of working age. In the text of the Special Report, however, the point made is rather different! There it is suggested that the figures serve to illustrate the relationship between pensioners and persons in work. The fact that a large proportion (more than a third in the EU in 2009) of the working-age population in the EU are currently not actually working is ignored! It is unsurprising if, given this fundamentally misleading presentation, which appeared under the sensationalistic front-page headline “70 or bust! Why the retirement age must go up”, the principal solution to demographic change taken into consideration in the article is a raising of the statutory retirement age.
The Austrian Chamber of Labour has devised a “dependency ratio calculator”1 for the purpose of better refuting such misleading statements in the future. This Policy Brief describes the calculator with reference to the data for the EU as a whole and draws attention to the major significance of the labour market for the development of economic dependency rates.
Demographic change
One of the major challenges of the coming years and decades is the ageing of the population.
During the period 2010 to 2050, according to current population projections (see, for example, EU Commission, Ageing Report
2009), the number of persons aged 65 and over in the EU
areas will rise from a current figure of 87 million to 148 million, which means a 70 per cent increase. In parallel, the demographic projections forecast a 12 per cent drop in the number of persons of working age (15 to 64), from the current figure of 335 million to 294 million in 2050.2
The Figure 1 shows the projected development of the population in the EU area broken down into the age groups 0 to 14 years, 15 to 64 years and 65 years and over.
. . . .
ETUI Policy Brief
Issue 4/2011
European Economic and Employment Policy
Dependency ratios and demographic change
The labour market as a key element
Josef Wöss and Erik Türk
–
Josef Wöss is head
of the social-policy
unit, and Erik Türk
is researcher at the
Austrian Chamber
of Labour, Vienna.
1 For more information on the dependency ratio calculator please contact the authors, [email protected], [email protected].
ETUI Policy Brief
Dependency ratios and demographic change — Issue 4/2011
The development in individual EU countries diverges in some cases considerably from the EU average as shown by the country examples for Austria, Germany, Poland and Great Britain (Figure 2). The most striking feature in this respect is the highly differing development of the working-age population aged 15 to 64. In some countries the projections indicate a considerable increase (as is here the case for the UK), and in others a relatively unchanging development (Austria). In other countries (such as Poland and Germany) a huge drop in the numbers of people in this age category is expected. The differences are attributable, above all, to the varying assumptions relating to fertility and migration.
Demographic dependency ratio
The demographic dependency ratio (age ratio) describes the numbers of old people in relation to the numbers of people of working age.3
Generally the demographic dependency ratio is expressed in terms of the difference between the number of people aged 65 and over and the number of people of working age (between 15 and 64). The population projections indicate the expectation that in the coming decades this demographic dependency ratio will, in the EU area, just about double, from its current level of 26 per cent, to 50 per cent in 2050 (Figure 3). In other words, for every 100 persons aged 15-64 there will be 50 (as against 26 currently) persons aged 65 and over.
Just like the differing development of the population as a whole, the development of the demographic dependency ratio in individual EU countries shows wide variation (Table 1). In the countries examined here, the strongest increase is expected in Poland, from a current figure of 19 per cent to 56 per cent in 2050. The figure projected for Germany is also 56 per cent, but starting out from a much higher level. The least change is expected in the UK.
The demographic dependency ratio can – for any given age structure – be influenced by one factor alone, namely, a shift in the position of the boundary separating working age and “retirement age”!
2 The main population projections used here are those of Eurostat (europop 08), as given in the statistical annex to the Ageing Report. The introduction to the
Ageing Report contains an important reference to the reliability of demographic
projections: “Demographic factors are subject to less variation than economic factors over the short run, however, they have exhibited much less stability over the medium term of say, 25 years” (p. 19). In spite of this warning against any excessive trust in in long-term population projects, these are very often the central basis for argument about long-term financing prospects of the welfare system and they are also used – for the purposes of our discussion – in this text. Certain trends of long-term population development (in particular, a huge increase in the proportion of old persons) can be predicted with considerable certainty. 3 In another variation of the demographic dependency ratio, children and young
persons are also counted as belonging to the ‘dependent’ population.
0 50 100 150 200 250 300 350 400 0 - 15 15 - 64 65+ Mio 2010 2020 2030 2040 2050 77 79 75 73 73 335 332322 308 294 87 103 123139 148 Figure 1: Population developments 2010-2050 (EU-27)
Source: EU Commission, Ageing Report 2009; own calculations
Economic dependency ratio
Unlike the demographic dependency ratio, the economic dependency ratio describes the relationship in terms not of the numbers of persons belonging to different age groups but of the number of those who are economically dependent (i.e. in receipt of transfer benefits) and those who are economically active. Differing variations upon this ratio are found in the literature. The most common is the retirement ratio, consisting of the number of pensioners as a ratio of the number of persons paying contributions/economically active persons4. In this text the economic dependency ratio is conceived of somewhat more broadly (pensioners + unemployed / economically active persons _ see following section).
4 Another variation is to be found, for example, in the statistical annex to the
Ageing Report (Table A 51). There a “total economic dependency ratio” is
calculated in which the non-economically active population (including children) is set against the economically active. In the EU area this ratio is currently 122:100 and, according to the projection contained in the Ageing Report, it will be 151:100 in 2050.
Table 1: Development of demographic dependency ratio 2010-2050 (DE, AT, UK, PL)
2010 2020 2030 2040 2050
Germany 31 % 35 % 46 % 55 % 56 %
Austria 26 % 29 % 38 % 46 % 48 %
UK 25 % 29 % 33 % 37 % 38 %
Poland 19 % 27 % 36 % 41 % 56 %
ETUI Policy Brief
Dependency ratios and demographic change — Issue 4/2011
Other than with the demographic dependency ratio, the economic position of individuals is a crucial factor with the economic dependency ratio reference. This makes a tremendous difference, in particular in relation to the working-age population, for it is very far from the case that all persons in this group are economically active.
According to labour market statistics issued by Eurostat, in the EU at the present time 214 million persons are recorded as being in employment, giving an employment rate of 64.9 per cent.5 Alongside these are 120 million people of working age who are not working, including a good 22 million officially regarded by the official statistics as unemployed and many more millions who are indeed without employment but not officially recorded as unemployed or who have already ended their working lives and are in receipt of a pension.
On the basis of these figures it already becomes apparent how little the number of people in a given age group says about the economic aspects of the situation. At the same time, these figures
indicate the major potential for raising the employment rate and thus also stemming the increase in the economic dependency ratio over the coming decades.
2010 2020 2030 2040 2050
0 bis unter 15 15 bis unter 65 ab 65 0,00 1,00 2,00 3,00 4,00 5,00 6,00 7,00 1,25 1,24 1,27 1,24 1,23 5,67 5,77 5,60 5,39 5,31 1,481,69 2,132,48 2,57 In Mio
Population developments in Austria
0,00 10,00 20,00 30,00 40,00 50,00 60,00 2010 2020 2030 2040 2050 11,0 10,3 10,2 9,5 9,0 54,2 52,6 47,9 44,141,9 16,918,6 22,124,2 23,6
0 bis unter 15 15 bis unter 65 ab 65 In Mio
Population developments in Germany
0,00 5,00 10,00 15,00 20,00 25,00 30,00 2010 2020 2030 2040 2050 5,7 5,6 4,8 4,0 3,9 27,2 25,5 23,6 22,1 18,9 5,2 6,9 8,5 9,1 10,5
0 bis unter 15 15 bis unter 65 ab 65 In Mio
Population developments in Poland
Source: EU Commission, Ageing Report 2009; own calculations
0,00 5,00 25,00 35,00 30,00 20,00 15,00 10,00 40,00 45,00 50,00 2010 2020 2030 2040 2050 10,7 11,612,2 12,1 12,4 41,1 42,042,8 43,8 45,1 10,212,0 14,216,1 17,1
0 bis unter 15 15 bis unter 65 ab 65 In Mio
Population developments in the UK Figure 2: Population developments in selected countries
5 Eurostat, Statistics in Focus 8/2011
Figure 3: Development of the demographic dependency ratio 2010-2050 (EU-27)
Source: EU Commission, Ageing Report 2009 0 50 250 350 300 200 150 100 400 335 87 103 123 139 148 Mio. 26 % 65+ 332 31 % 65+ 322 38 % 65+ 308 45 % 65+ 294 50 % 65+
ETUI Policy Brief
Dependency ratios and demographic change — Issue 4/2011
In the European Commission’s Demography report 2008 this point is made extremely clearly: “The active population is in fact much smaller than the age group 15-64. … This leaves considerable scope for increased employment in most Member States and, consequently, an opportunity for achieving a much more favourable balance between the population in employment and retired older people. … This illustrates the importance of raising employment levels in the EU. It is arguably the most effective strategy with which countries can prepare for population ageing.“ (pp. 143/144).
The development of the economic dependency ratio is determined to a major extent by the employment rate and the numbers of unemployed. In comparison with the demographic dependency ratio, which can be altered only by age boundaries, there is here a much greater number of variables: a drop in unemployment, the rapid occupational integration of young people on completion of training, stronger labour market participation of women, avoidance of early retirement on health grounds by means of better health protection, better labour
market integration of older male and female workers in order to raise the age at which workers actually enter retirement, etc.
Dependency ratio calculator
The “dependency ratio calculator” allows diagrammatic representation of both demographic change and the economic dependency ratio. In particular, it enables the effect of different labour market scenarios on future development of the economic dependency ratio to be ascertained and graphically represented.
Definition of the economic dependency ratio used in the calculator:
number of pensioners and unemployed persons as a ratio of the number of those in employment.
This definition of the economic dependency ratio has been drawn up, above all, in the context of the discussion about the long-term viability of the retirement systems. As such, the major group set against those in work are retired persons, in their capacity as benefit recipients, but also included in the count are those persons
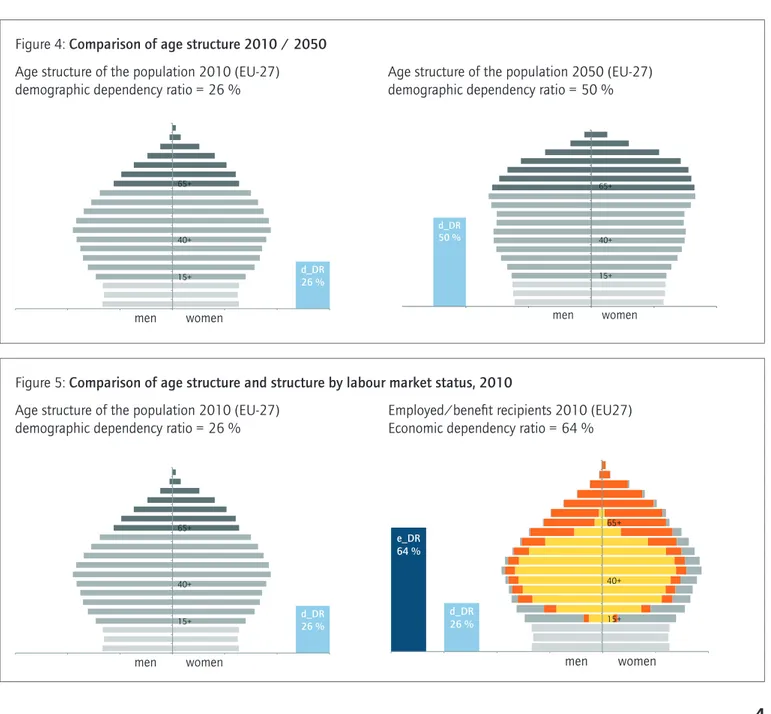
Figure 4: Comparison of age structure 2010 / 2050 Age structure of the population 2010 (EU-27) demographic dependency ratio = 26 %
Age structure of the population 2050 (EU-27) demographic dependency ratio = 50 %
Figure 5: Comparison of age structure and structure by labour market status, 2010 Age structure of the population 2010 (EU-27)
demographic dependency ratio = 26 %
Employed/benefit recipients 2010 (EU27) Economic dependency ratio = 64 %
men women d_DR 26 % 65+ 40+ 15+ men women 65+ 40+ 15+ d_DR 50 % men women d_DR 26 % 65+ 40+ 15+ men women e_DR 64 % d_DR 26 % 65+ 40+ 15+
ETUI Policy Brief
Dependency ratios and demographic change — Issue 4/2011
who, on grounds of unemployment, are also in need of public support in the form of benefit payments. This method of reckoning enables account to be taken of the fact that persons who, because of unemployment, have no income of their own are also dependent on transfers. What is more, it makes little economic difference from the standpoint of public budgets whether a person who is a few years away from the official retirement age is in receipt of a (possibly temporary) pension or of unemployment benefit. People employed in mini-jobs (i.e. working just a few hours) should in actual fact be excluded from the employed population since they make no significant contribution to the public budgets and are indeed often themselves dependent on some forms of transfer. However, the Labour Force Survey data do not allow this refinement (see below).
First step – Illustrating the demographic development / establishing the demographic dependency ratio
Using the dependency ratio calculator the projected age structure of the population can be shown for each EU country (grouped into 5-year cohorts).6 The most familiar representation is the one used in the media, namely, the “population tree”.
For each age composition of the population the demographic dependency ratio is established in parallel (dark blue column). Children and adolescents aged under 15 are not counted.
Figure 4 shows the population structure in the EU area in 2010 and the population projections for 2050. In each case the corresponding dependency ratio is given.
As we have seen, the demographic dependency ratio will, according to current population projections, virtually double over the next four decades, from a current level of 26% to 50% by 2050. In other words, the ratio between persons aged 15 to 64 and the more elderly population is currently 4:1 in the EU area, whereas by 2050 it will be 2:1.
Second step: Taking into account the economic position of persons aged 15 and over: establishing the economic dependency ratio
As a next step the dependency ratio calculator offers the possibility of a breakdown into three groups, according to economic status, of the population structured by gender and age group:
– Actively employed (yellow areas)
– In receipt of benefits – pensioners and unemployed (red area)
– Neutral – young persons in training, housewives/-husbands, etc. (dark grey area)
In Figure 5 the current population structure in the EU area is once again shown on the left side, and on the right side is shown the breakdown into the three abovementioned economic categories7.
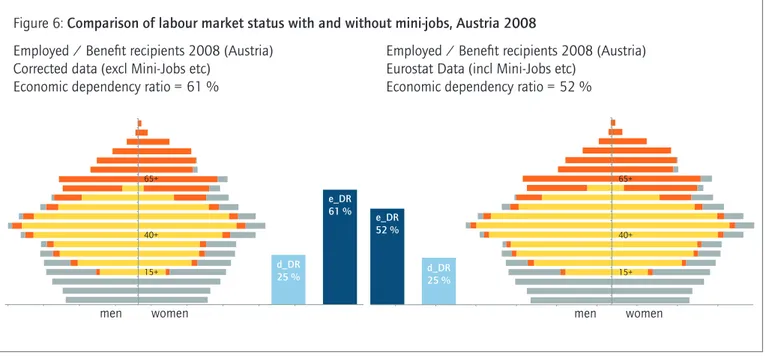
Figure 6: Comparison of labour market status with and without mini-jobs, Austria 2008 Employed / Benefit recipients 2008 (Austria)
Corrected data (excl Mini-Jobs etc) Economic dependency ratio = 61 %
Employed / Benefit recipients 2008 (Austria) Eurostat Data (incl Mini-Jobs etc)
Economic dependency ratio = 52 %
6 Data used are taken from the Eurostat demographic projections (europop 08).
7 Economic status is given on the basis of the Eurostat Labour Force Survey (employed/unemployed 2010; Non-economically active persons by cause 2009 – for lack of more recent figures) and data supplied in the Annex to the
Ageing Report, EC 2009 (estimate of the number of pensioners).
men women d_DR 25 % e_DR 61 % 65+ 40+ 15+ men women e_DR 52 % d_DR 25 % 65+ 40+ 15+
ETUI Policy Brief
Dependency ratios and demographic change — Issue 4/2011
The Figures show the tremendous difference between demographic and economic reality. With a demographic dependency ratio of 26 per cent, the economic dependency ratio is 64 per cent (d_DR the light blue column). For every 100 persons in employment there are currently 64 benefit recipients (pensioners, unemployed persons). The purely demographic consideration of the 15-64 and 65+ age groups results, by contrast, in a ratio of 100:26. It is to be noted that in the Eurostat data used for these calculations (employment rate for 2010: 64.1%) the several millions of persons employed in mini-jobs are also counted as active, while, at the same time, unemployment is incompletely covered.
The juxtaposition (figure 6) shows, using the example of Austria, what a great difference is made by correction of the data concerning mini-jobs and unemployed. The unemployment figures have also been corrected because in Austria the number of people in receipt of unemployment benefits is much higher than the unemployment figure given in the Eurostat statistics.8 As shown, the data from the Labour Force Survey offer a much more positive picture than the national data corrected for mini-jobs and counting all unemployed as such. On the basis of the Eurostat data the economic dependency for Austria is 52%, but after correction this ratio is 61%.
Third step: Illustration and calculation of the effects of different labour market scenarios on the development of the economic dependency ratio
As well as illustrating the difference between demographic and economic dependency ratios, the calculator offers, above all, the possibility of ascertaining the effect of different labour market
scenarios on the development of the economic dependency ratio and of representing this effect in an easily understandable form. The same demographic projections are set against the different labour market scenarios.
In Figure 7, on the basis of the population developments projected for the EU-27 for the year 2050, two labour market scenarios are represented and their effect on the economic dependency ratio shown:
– “Standard Scenario”: this Scenario is based on the long-term projections of the development of employment and unemployment rates in the EU 27 according to the Ageing
Report 2009 (the activity rate among 15-64-year-olds rises to
70 per cent by 2050)
– “EU 2020 plus Scenario”: here it is assumed that the employment goals of the EU 2020 Strategy will be achieved (an employment rate of 75% in the 20-64 age group) and that, subsequently, in the 2020-2050 period a further, albeit much slower, growth of the employment rate in this age group will take place – an increase, between 2020 and 2050, by an amount similar to that between 2010 and 2020 (the employment rate of 15-64 year olds rises to 76.1% in 2050).
The scenario calculations give rise to considerable differences in the corresponding economic dependency ratios. If the relatively unambitious “standard scenario” comes into being, then, given the Eurostat population development projections for 2050, the economic dependency ratio would be 87 per cent. If, however, in the coming 40 years the EU-2020 plus scenario could be achieved, this ratio would rise to only 78 per cent.
Compared with the current economic dependency ratio in the EU area of 64 per cent (see above), this would mean, by the year 2050, on the basis of achievement of the “standard scenario”,
8 Data for correction taken from Hauptverband der österreichischen Sozialversicherungsträger, WIFO, BMASK, AMS, STATAT.
Figure 7: Two scenarios: structure by labour market status, 2050 Employed/ benefit recipients 2050 (EU-27)
Standard Scenario
economic dependency ratio: 87 %
Employed / benefit recipients 2050 (EU-27) EU 2020 plus Scenario
economic dependency ratio: 78 %
men women d_DR 50 % e_DR 87 % 65+ 40+ 15+ e_DR 78 % d_DR 50 % men women 65+ 40+ 15+
ETUI Policy Brief
Dependency ratios and demographic change — Issue 4/2011
an increase of 36 per cent and, on the basis of achievement of the “EU 2020 plus scenario”, an increase of 22 per cent. The fact that, in each case, a population development entailing an almost 100 per cent increase of the demographic dependency ratio is the basis for these values shows just how important it is to keep the demographic and economic factors separate from one another. The “EU 2020 plus scenario” differs from the “standard scenario” principally in that the employment rate among the 15-64 age group in 2050 is a good 6 percentage points higher. The increase in employment under this scenario is associated with significantly lower unemployment, substantially reduced gender-specific differences in employment behaviour and with considerably higher activity rates in the 55 to 64 age group.
It can be clearly demonstrated, using scenario-based calculations of this kind, that the extent of the use of the employment potential among the 15 to 64 age group and the reduction of the high level of unemployment are of crucial significance for the future development of the economic dependency ratio. A raising of the effective labour-market-exit age and a significantly higher activity rate of both men and women in the 55 to 64 age group (together with reducing unemployment and increasing women participation rates) are undoubtedly important means to achieving this end. By contrast, the focus on raising the statutory retirement age, so frequently in the foreground of current discussion, bypasses the real problems, at the same time causing highly significant policy areas and issues to be overlooked.
A subsequent step, not discussed in this paper, would be to consider the extent to which changes in the economic dependency ratio might be reflected in transfer payments. Here, productivity growth and the evolution of earnings and benefits replacement levels are the relevant key determinants. The “dependency ratio calculator” also permits such calculations.
Conclusion: summary and main points
– It is important to observe a clear distinction between demographic and economic dependency ratios, something that has too often not been the case in the past.
– Economic activity ratios are significantly more eloquent than demographic ones and should be brought to the fore in the long-term projections, whereas public discussion to date has been virtually exclusively focused on demographic change.
– The use of available employment potential and a raising of the employment rate constitute crucial responses to demographic change, but in many publications on the long-term financial viability of pension systems this potential has not been dealt with or has been referred to only marginally.
– Raising employment rates, with quality jobs, could help to considerably reduce the future increase in the economic dependency ratio, thereby alleviating the financial burden of ageing. Moreover, such a strategy would help to solve key problems of our societies (poor labour market opportunities for young people, poor labour market integration of older workers, unemployment, invalidity, lack of opportunities to combine working and family life, etc.).
Use of the available employment potential in the coming decades requires above all:
– Ensuring/creating a high standard of education and training – Creation of the conditions required for better combination of
work and family life
– Improvement in health protection
– Better labour market integration of elderly workers (jobs adapted to older workers’ needs, etc.)
– Reduction in unemployment
– Conversion of involuntary mini-jobs and precarious and informal forms of employment into regular forms of employment – Balanced distribution of employment
– Fair distribution of welfare gains
The views expressed in ETUI Policy Briefs are those of the respective author(s) and do not necessarily reflect the views of the ETUI.
For more information about the ETUI Policy Brief – European Economic and Employment Policy, please contact the editor, Andrew Watt ([email protected]). For previous issues, please visit www.etui.org/publications. You may find further information on the ETUI at www.etui.org.
© ETUI aisbl, Brussels, July 2011 All rights reserved. ISSN 2031-8782