HAL Id: tel-01262155
https://tel.archives-ouvertes.fr/tel-01262155
Submitted on 26 Jan 2016HAL is a multi-disciplinary open access archive for the deposit and dissemination of sci-entific research documents, whether they are pub-lished or not. The documents may come from teaching and research institutions in France or abroad, or from public or private research centers.
L’archive ouverte pluridisciplinaire HAL, est destinée au dépôt et à la diffusion de documents scientifiques de niveau recherche, publiés ou non, émanant des établissements d’enseignement et de recherche français ou étrangers, des laboratoires publics ou privés.
Physiological involvement of presynaptic L-type voltage
dependent calcium channels in GABA release of
cerebellar molecular layer interneurons
Stéphanie Rey
To cite this version:
Stéphanie Rey. Physiological involvement of presynaptic L-type voltage dependent calcium chan-nels in GABA release of cerebellar molecular layer interneurons. Neurons and Cognition [q-bio.NC]. Université René Descartes - Paris V, 2013. English. �NNT : 2013PA05T096�. �tel-01262155�
THESE DE DOCTORAT DE L’UNIVERSITE PARIS
DESCARTES
Ecole Doctorale Cerveau-Comportement-Cognition
Spécialité
NEUROSCIENCES
Présentée par :
Stéphanie Rey
Pour obtenir le grade de :
DOCTEUR DE
L’UNIVERSITE PARIS DESCARTES
Sujet de thèse :
Physiological involvement of presynaptic L-type voltage
dependent calcium channels in GABA
release of cerebellar molecular layer interneurons
Soutenue le 13 Décembre 2013
Devant le jury composé de :
Régis Lambert, président du jury
Oussama El-Far, rapporteur
Philippe Lory, rapporteur
Rossella Conti, invitée
Anne Feltz, invitée
Claire Legay, invitée
3
Remerciements
Je tiens tout d’abord à remercier Alain Marty de m’avoir permis de réaliser ma thèse au sein de son laboratoire et pour son soutien durant ces trois années de thèse.
J’adresse de chaleureux remerciements à mon directeur de thèse Thibault, merci de m’avoir encadré durant ma thèse, de m’avoir guidé, conseillé et de votre aide lors de la rédaction de ce manuscrit. Je garderai toujours un bon souvenir de vos dégustations de Kusmi tea (surtout le detox).
Je tiens à remercier Philipe Lory et Oussama El-Far d’avoir accepté d’être rapporteur de ma thèse.
Merci à Régis Lambert, Claire Legay, Rossella Conti et Anne Feltz d’avoir accepté de faire partie de mon jury de thèse.
Merci à Isabel de m’avoir encouragé et soutenu pendant ces trois années et pour mes recherches de postdoc. Merci encore de m’avoir permis d’aller au Brésil.
Merci à Ali pour m’avoir initié à immunohistochimie et à la microscopie confocale. Merci encore de m’avoir soutenu et conseillé dans ma découverte de la microscopie électronique et dans la vie de tous les jours.
Merci à Alain Schimtt pour m’aidé et conseillé lors de mon apprentissage de la microscopie électronique. J’espère que nous collaborerons ……
Merci à Philippe de m’avoir prêté de nombreux articles sur la pharmacologie des canaux calciques. Ils sont été très utiles.
Merci aussi à Jacsue pour tes mots réconfortants et tes petits gâteaux qui étaient très bienvenue surtout les weekends d’écriture de la thèse.
Merci à Jonathan pour m’avoir signalé et envoyé des articles venant d’être publiés sur les canaux calciques et d’avoir corrigé ma lettre de motivation qui m’a permis d’aller au cours EMBO.
Merci à Brandon pour m’avoir aidé dans ma recherche de postdoc, pour ses corrections et ses suggestions pour mes lettres de motivation.
Je remercie Luc de m’avoir aidé avec mes problèmes d’ordinateur et surtout pour la connection à distance sur Lilith. Je reconnais qu’il n’est pas impossible qu’une partie du problème se situe entre la chaise et l’ordinateur…
Merci à tous ceux qui ont quitté le laboratoire et qui me manquent beaucoup: Gilliane, Gaelle et Pancho.
Merci à Guadalupe, Camila, Javier, Jin, Elric et Pepe pour votre bonne humeur et vos petits mots réconfortant pendant l’écriture de ma thèse.
4 Un grand merci à tous ceux qui ont partagé ma vie au laboratoire de physiologie cérébrale et tous ceux que je connais au St Pères : David Ogden, Céline, Sandrine, Fede, Catherine, Félicité, David Dubayle, Christophe, Visou, Paloma, David Orduz, Brice, Patrick, Patrice……
Mes remerciements les plus tendres sont pour ma mère. Merci de tout mon cœur pour ton écoute et ton soutien depuis ma plus tendre enfance.
Merci Alexis, mon amour pour ton écoute et tout ton amour.
Durant la rédaction de mes remerciements, j’ai réalisé que je viens de passer 8 ans à étudier au St Pères. Je me revois en L1 assistant au cours de Claire Legay et me rappelle de mon premier stage en laboratoire comme si c’etait hier. Le temps passe si vite…
5 A ma grand-mère, Thérèse
7
Résumé :
La libération de neurotransmetteur est provoquée par la dépolarisation de la terminaison présynaptique et l’entrée de calcium à travers les canaux calciques voltage-dépendants (VDCCs). Les VDCCs à haut seuil de type-P/Q et de type-N sont classiquement impliqués dans la libération de neurotransmetteurs et sont localisés dans la terminaison axonale près de la zone active. Deux membres de la famille des VDCCs de type-L, Cav1.2 et
Cav1.3 sont connus pour être exprimés dans le système nerveux central. Dans le cortex
cérébelleux, les propriétés pharmacologiques des VDCCs présynaptiques ont été examinées aux synapses GABAergiques entre les interneurones de la couche moléculaire (MLIs) et entre les MLIs et les cellules de Purkinje. Bien qu’il n’y ait aucun doute que les VDCCs de type-P/Q et de type-N sont les principaux acteurs de l’entrée de calcium présynaptique et de la libération de GABA par les MLIs, l’absence d’effet des dihydropyrines antagonistes a exclut le potentiel rôle des VDCCs de type-L (Forti et al., 2000; Stephens et al., 2001). Il est intéressant de noter que les dihydropyrines antagonistes sont très peu efficaces sur les courants calciques de type-L activés par un potentiel d’action (Helton et al., 2005), ce qui suggère que l’implication des VDCCs de type-L dans la libération de neurotransmetteur a été largement négligée.
Dans cette étude, nous avons montré que le BayK8644 (une dihydropyridine agoniste) augmente fortement la fréquence des mIPSCs enregistrés dans les MLIs et dans les cellules de Purkinje suggérant que les VDCCs de type-L peuvent être présents dans les terminaisons axonales des MLIs. Ce résultat a été confirmé par des expériences d’immunohistochimie utilisant la microscopie confocale et électronique ainsi que par des expériences d’imagerie calcique. Nos résultats démontrent que les VDCCs de type-L, souvent négligés dans les terminaisons axonales, ont un rôle crucial dans la libération de GABA par les MLIs.
9
Table of contents
List of abbreviations ... 11 List of illustrations ... 12 Chapter 1 ... 14 Introduction ... 14 1.1 Cerebellum: ... 141.1.1 Anatomy and connections with other part of the brain. ... 14
1.1.2 Cerebellar functions. ... 16
1.1.3 Cerebellar cortex organization: cellular and ultrastucture description. ... 17
1.1.3.1 Cellular organization of the cerebellar cortex. ... 17
1.1.3.2 Light and electron microscopy cell descriptions. ... 18
Purkinje cells ... 20
Climbing fibers ... 23
Mossy fibers ... 24
Granule cells ... 24
Molecular layer interneurons ... 24
Golgi cells ... 30
Lugaro cells ... 30
Unipolar-brush cells ... 30
Glial cells ... 30
1.1.3.3 Neuromodulative innervations. ... 33
1.1.4 Cerebellar cortex post-natal development. ... 33
1.1.5 Characterization of synaptic current recorded in MLIs and Purkinje cells in young rats. ... 37
1.1.6 Characterization of axonal calcium transients in MLIs axons in young rats. ... 38
1.1.7 Modulation of synaptic currents and axonal calcium transients in MLIs. ... 40
1.2 Voltage dependent calcium channels. ... 42
1.2.1 The main subunits: α1 subunits or Cav. ... 42
1.2.1.1 Structure. ... 43
1.2.1.2 Biophysical and pharmacological properties. ... 45
HVA VDCCs ... 45
LVA VDCCs: T-type VDCCs ... 51
1.2.2 Auxilliary subunits. ... 52
1.2.3 Localization and role of VDCCs. ... 54
1.2.4 Interaction with other proteins. ... 56
1.2.4.1Physical coupling with RyR. ... 56
1.2.4.2 Interaction with synaptic proteins. ... 56
1.2.5 Regulation of VDCCs by G proteins. ... 57
1.2.5.1 PKA. ... 57
1.2.5.2 PKC. ... 58
1.2.5.3 G βγ dimer. ... 58
1.3 VDCCs and neurotransmitter release. ... 59
1.3.1 Ca2+ dependence of neurotransmitter release. ... 60
1.3.1.1 Tight coupling between VDCCs and exocytotic machinery. ... 60
1.3.1.2 Miniature currents. ... 62
1.3.1.3 Analog signaling. ... 62
1.3.2 P/Q and N-type VDCCs: the main actors of neurotransmission in the CNS. ... 63
1.3.3 Other VDCCs. ... 64
10
1.3.3.2 L-type VDCCs. ... 65
Presynaptic plasticity at different synapses in hippocampus ... 66
Presynaptic L-type VDCCs and fear conditioning ... 67
Regulation of presynaptic L-type VDCCs ... 68
Miniature synaptic currents and L-type VDCCs ... 68
1.3.3.3 T-type VDCCs. ... 69
Chapter 2 ... 70
Materials and methods ... 70
2.1 Electrophysiological experiments. ... 70
2.1.1 Liquid junction potential. ... 70
2.1.2 Bayk concentration – response on mIPSC frequency. ... 71
2.1.3 Preparation of acute brain slices for older rats. ... 71
2.1.4 L-type current recordings. ... 71
2.1.5 Others drugs for supplementary data... 72
2.2 Immunochemistry experiments. ... 72
2.2.1 Specificity of anti-Cav1 antibodies. ... 72
2.2.2 Others antibodies for supplementary data. ... 72
Chapter 3 ... 76 Results ... 76 3.1 Article in preparation. ... 76 3.1.1 Introduction. ... 76 3.1.2 Article ... 78 3.2 Supplementary results: ... 111
3.2.1 Dose response relationship of BayK 8644 on mIPSC frequency recorded in MLIs. ... 111
3.2.2 BayK effect on mIPSC frequency in older rats. ... 111
3.2.3 Physiological modulation of L-VDCCs by Noradrenaline. ... 112
3.2.4 Different RyR isoforms are expressed in MLIs axon. ... 114
3.2.5 P/Q-type and L-type VDCCs display similar localization in MLI termini. ... 116
3.2.6 L-type VDCCs are expressed in parallel fiber termini. ... 116
Chapter 4 ... 118
Discussion ... 118
11
List of abbreviations
cAMP cyclic adenosine monophosphate
CNS Central nervous system
DHP Dihydropyridines
ER Endoplasmic reticulum
EPSC Excitatory synaptic current
HVA High Voltage Activated
IP3R inositol 1,4,5,-triphosphate receptor
IPSC Inhibitory synaptic current
IV Current-voltage
KO knockout
LTP Long term potentiation
LVA Low Voltage Activated
MLI Molecular layer interneuron
mIPSC/mEPSC miniature IPSC/ miniature EPSC
P Postnatal days old
PPR Paired pulse ratio
PSD Postsynaptic density
PTP Posttetanic potentiation
RyR Ryanodine receptor
SCaTs Spontaneous calcium transients
TTX Tetrodotoxine
12
List of illustrations
Introduction
Fig 1: Dorsal view of adult rat CNS including cerebellum
Fig 2: Parasagittal section of adult rat cerebellum
Fig 3: Cerebellar cortex organization
Fig 4: First Purkinje cell illustration
Fig 5: Purkinje cell drawing
Fig 6: Electron micrograph of Purkinje cell dendrites and synapses
Fig 7: Electron micrograph showing climbing fiber synapses on Purkinje cell thorns
Fig 8: MLIs from rabbit cerebellum
Fig 9: Micrograph of synapses on basket cell dendrite
Fig 10: Micrograph showing basket cell axon around Purkinje cell somata
Fig 11: Micrograph representing stellate cell and basket cell axons in molecular layer
Fig 12: Electron micrograph showing Bergman cells and oligodendrocyte close to Purkinje
cell somata
Fig 13: Rat cerebellar postnatal development
Fig 14: Micrographs of basket cell termini on Purkinje cell somata at P12 and P15 rats
Fig 15: Spontaneous synaptic current traces recorded in Purkinje cells or in stellate cells
Fig 16: Axonal Ca2+ transients in basket cell in response to a depolarization
Fig 17: VDCC heteromeric complex
Fig 18: Biophysiological description of VDCC currents activated by step depolarization in tsA201 cells
Fig 19: Localization and role of VDCCs in central and sensory neurons
Table 1: Localization, antagonists and cellular functions of VDCCs
13 Table 3: Biophysical properties of Cav2.1 and Cav2.2 subunits
Table 4: Biophysical properties of Cav2.3 subunits
Table 5: Biophysical properties of Cav3.1, Cav3.2 and Cav3.3 subunits
Materiels and Methods
Fig 20: Alomone anti-Cav1.3 antibody tested on Cav1.3-/- KO mice
Fig 21: Anti-Cav2.1 antibody from Synaptic System tested on Cacna1a purky (-/-) mice
Results
Fig 22: Effect of BayK8644 concentration on mIPSC frequency
Fig 23: Noradrenaline fails to increase the mIPSCs frequency in presence of Cd2+ but forskolin prevents the L-type VDCCs current run-down.
Fig 24: Expression of RyR1 and RyR2 in MLI axons
Fig 25: Presynaptic expression of Cav1.2 and Cav1.3 in parallel fiber termini
14
Chapter 1
Introduction
1.1 Cerebellum:
Studying the cerebellum is of primary importance in the field of neuroscience. It bears
a unique crystalline structure and is traditionally acknowledged to be involved in motor
control although recent studies have postulated its role in several cognitive processes
(Glickstein et al., 2009, 2011). Historically, the first neuron ever was observed in the cerebellum by J.E Purkinje (1837) and is referred to as “Purkinje cell” since. Moreover, the typical cerebellar circuitry inspired the “neuronal theory” to Ramόn y Cajal (1894).
1.1.1 Anatomy and connections with other part of the brain.
In all vertebrates, the cerebellum is a distinct subdivision of the central nervous system
(CNS) localized in the rostral roof of the fourth ventricle (Fig1). The cerebellum consists of
the cerebellar cortex and cerebellar deep nuclei (fastigial, dentate and interpositus nuclei)
enclosed within the white matter. The cerebellum is divided into two hemispheres connected
by a central region, the vermis. Ten lobes are easily distinguished in parasagittal section and
grouped in three major classes: anterior lobe (lobes I to V), posterior lobe (lobes VI to IX) and
15 Fig 1: Dorsal view of adult rat CNS including cerebellum.
Note the vermis (v), one of the two hemispheres (h) an the paraflocculus (p). (From Palay & Chan-Palay, 1974).
Fig 2: Parasagittal section of adult rat cerebellum.
Lobes are numbered from I to X. Note that the lobule I is cut. The three layers of the cerebellum can be easily recognized: the molecular layer (light-gray), the granular layer (dark-grey) and the white matter (black). Cerebellum is stained using toluidine blue epoxy.
16 The efferent projections of the cerebellar cortex are formed by Purkinje cell axons, the
greatest number of which connects to the deep cerebellar nuclei. The cerebellum is connected
to the rest of CNS by the three pairs of cerebellar peduncles (superior, middle and inferior
peduncle) resulting from bundles of afferent and efferent fibers. The major output pathway of
the cerebellum leaves through the superior peduncle and is composed of fibers originating
from the deep nuclei. The efferent fibers of the superior peduncle contact the reticular
formation, the red nucleus and the thalamus (ventrolateral and ventroanterior nuclei). The
inferior peduncle carries efferent fibers coming from the fastigial nuclei and direct projections
of Purkinje cells of the flocculonodular lobe to the vestibular nuclei. The afferents of the
cerebellum can be divided into four groups: vestibular, ascending spinal, descending pontine
nucleus (which receives input from the cerebellar cortex), olivary and reticular. The vestibular
afferents reach the cerebellar cortex though the inferior peduncle; it distribute to the fastigial
nucleus and to the flocculonodular lobe. Moreover, afferents from spinal cord also enter
though inferior peduncle and distribute in the anterior lobe and part of the posterior vermis.
Moreover, the afferents from the inferior olive and the reticular formation enter the
cerebellum though the inferior peduncle. Finally, the middle peduncle only contains afferent
fibers emerging from the pontine nuclei; it distributes to all the cerebellar cortex.
1.1.2 Cerebellar functions.
The first experimental approaches aiming to tackle cerebellar functions were based on
animal cerebellar lesions or ablations and started in the beginning of the 19th century. Luigi
Rolando observed the first motor symptoms following a cerebellar lesion in 1809 and he
concluded that the cerebellum was involved in instating movement (Rolando, 1809).
Thereafter, Pierre Flourens (1824) noted that a cerebellum ablation did not prevent the
17 classified the various symptoms caused by cerebellar lesions as atonia, ataxia and loss of
continuity of movement (Luciani, 1891). The involvement of the cerebellum in motor
coordination was further confirmed by clinical studies over the 20th century (Sammet, 2007;
Glickstein, 2009 and 2011 for review).
In recent years, it has been proposed that the cerebellum plays a role in cognitive
processes. First of all, the cerebellum has been shown to be anatomically connected to
prefrontal cortex (Middleton & Strick, 2001) and clinical studies have demonstrated an
involvement of the cerebellum in language (Riva & Giorgi, 2000) and dyslexia (Nicolson &
Fawcett, 2005). Furthermore, cerebellum seems to be involved in the pathology of autism. In
fact, postmortem studies showed histoanatomic abnormalities in autistic individuals as a
decrease in the number of Purkinje cells and abnormalities in deep cerebellar nuclei (Fatemi
et al., 2012 for review).
1.1.3 Cerebellar cortex organization: cellular and ultrastucture description.
References used for the morphological description and organization of the cerebellar cortex are: Ramόn y Cajal (1911), Chan-Palay & Palay (1972), Palay & Chan-Palay (1974), and Sotelo (2010) unless otherwise stated.
1.1.3.1 Cellular organization of the cerebellar cortex.
The cerebellar cortex bears a simple and uniform organization in three layers:
molecular layer, granular layer and white matter (Fig 2). Between the molecular layer and the
granular layer, the Purkinje cell layer is composed by a single row of Purkinje cell somata.
Within granular and molecular layer, several types of neurons have been identified: granule
18 cells and unipolar brush cells. Granule cells and unipolar-brush cells are excitatory
glutamatergic neurons whereas Purkinje cells, MLIs, Golgi and Lugaro cells are inhibitory
GABAergic neurons (Fig 3). Besides, astrocytes, oligodendrocytes, Bergman cells, microglia
and NG2(+) cells are glial cell types commonly found in the cerebellum.
At the connectivity level, the cerebellar cortex receives two excitatory glutamatergic inputs:
climbing fiber and mossy fiber, which respectively arise from the inferior olive and
brainstem/spinal cord. Climbing fibers directly contact Purkinje cell somata and dendrites.
Note that one Purkinje cell is contacted by only one climbing fibers but makes around 200
synapses. Mossy fibers form the major input to the cerebellum and they establish contacts
with the granule cells and Golgi cell in a typical structure called glomerulus and hence make
indirect contact with Purkinje cells. The cerebellum unique ouput is formed by the axons of
Purkinje cells (Fig 3). These latter project through the granular cell layer into the white mater
and terminate on deep cerebellar nuclei and on some brainsterm nuclei. Sometimes, Purkinje
cell axons project in the molecular layer (Ramόn y Cajal, 1911; Orduz & Llano, 2007).
1.1.3.2 Light and electron microscopy cell descriptions.
A czech physiologist Jan Evangelista Purkinje described the first neuron in 1837: it
was a rather large neuron of the human cerebellar cortex (Fig 4). In 1873, Camillo Golgi
developed selective silver staining of neurons which allowed the observation of the neurons
and their processes in black in a clear background. He was the first to report the Purkinje cell
dendritic tree and the axon description. In the beginning of 20th century, Ramόn y Cajal
proposed a definitive picture of the cellular organization and connectivity of the cerebellar
cortex arises through the use a refined Golgi’s method. In addition, two types of interneurons
were introduced after the Cajal period namely Lugaro cells and unipolar brush cells. The
19 description of cerebellar cells and synapses beautifully summarized in the work of Palay and
Chan-Palay (1974). A B
Fig 3: Cerebellar cortex organization.
A) Drawing from Palay & Chan-Palay (1974) represents the cellular and synaptic organization of the cerebellar cortex in parasagittal and transverse plan.
B) Drawing from Sotelo (2011), includes the two new types of interneurons, Lugaro cells and the unipolar brush cells and also neurotransmitters for each neuron.
Legends for Palay & Chan-Palay: pia (pial surface), mol (molecular layer), PC (Purkinje cell), gr (granular layer), wm (white matter), S (stellate cell), B (basket cell), GC (granule cell), CF (climbing fiber, red), MF (mossy fiber, red).
Legends for Sotelo 2011: S (stellate cell), PF (parallel fiber), B (basket cell), LC (lugaro cell), UBC (unipolar-brush cell), GC (granule cell), GO (golgi cell), GLU (glutamatergic cell), GABA (GABAergic cell), GLY (glycinergic cell), Ach (cholinergic), NA (noradrenalin), 5-HT (serotonin), MA (monoaminergic neurons).
20 Purkinje cells
The cell body of Purkinje cell appears globular or ovoid and is on average 21 µm in
diameter and 25 µm in length. The dendritic tree of the Purkinje cells projects in the
molecular layer in the parasagital plan and originates from one of four primary dendrites (Fig
3A, 4 and 5). Each primary dendrite is divided in secondary dendrites and tertiary dendrites
that split into three to five branches themselves holding abundant thorns (around 7500 per
Purkinje cell). The dimensions of these thorns (1.5 to 2 µm long and a head around 0.45 µm
in diameter) make them easily observed in electron microscopy. Note that they are free of
mitochondria and characterized by cisternaes of agranular endoplasmic reticulum (Fig 6).
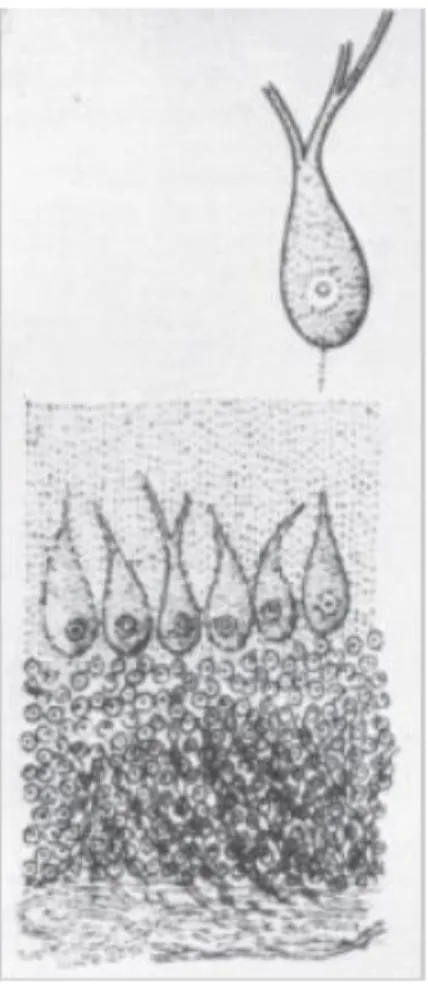
Fig 4: First Purkinje cell illustration.
First representation of Pukinje cell presented to the Congress of Physician and Scientist in Prague in 1838. He described «a great number of similar corpuscles, which surround the yellow substance [...] its two prologations get lost in the grey substance near the outer periphery, where this is covered by the meninges». yellow substance: granular layer, grey substance: molecular layer.
21
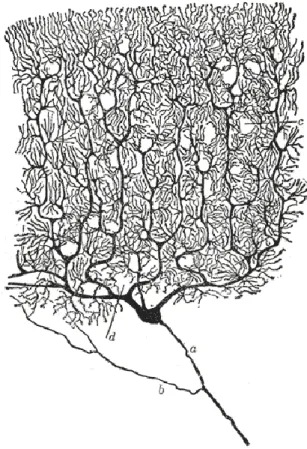
Fig 5: Purkinje cell drawing.
Human Purkinje cell drawing. a: axon, b: collateral, c: blood vessel holes, d: basket cell hole. (From Ramόn y Cajal, 1911).
22
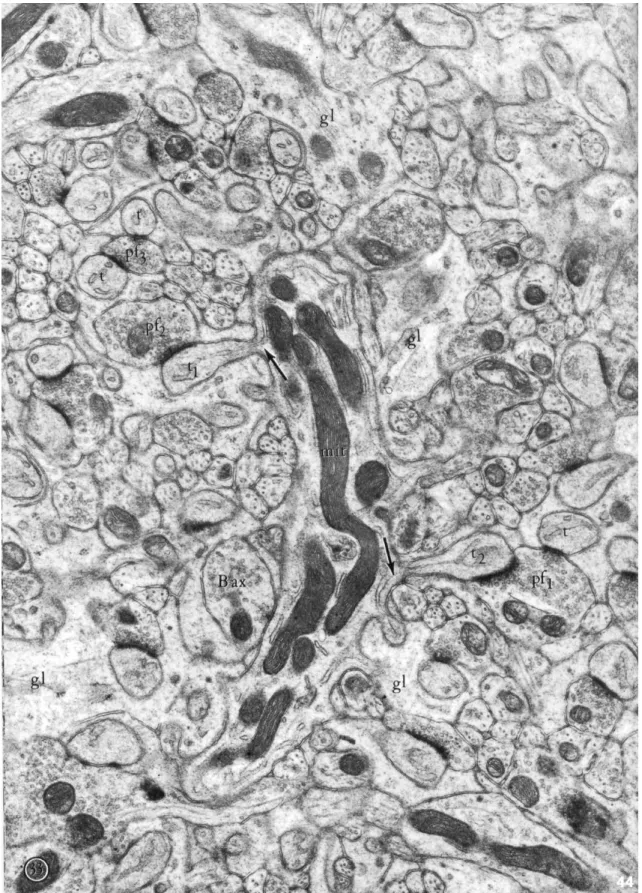
Fig 6: Electron micrograph of Purkinje cell dendrites and synapses.
Purkinje cell dendrites and its torns (t1 and t2) make synapses with two parallel fibers (pf1and pf2).
Neuroglias (gl) cover Purkinje cell dendrite. A basket cell axon (B ax) synapses directly the Purkinje cell dendrite. Several mitochondria (mit) are found in the Purkinje cell dendrite but not in thorns. Two parallel fibers (pf1 and pf3) connect two Purkinje cell thorns (t and t2). Note that cisterna of agranular
endoplasmic reticulum from the dendrite goes through the thorns (arrows). Magnification: X19000.
23 Climbing fibers
Climbing fibers originate from the inferior olive, across the granular layer and enter
obliquely or vertically in the molecular layer (Fig 3A). They are small myelinated fibers of
1-2 µm in diameter which divide in thin branches of 0.1 µm diameter in the molecular layer.
The climbing fiber axonal varicosities are fully filled with spherical synaptic vesicles of 40 to
100 nm in diameter and eventually contain mitochondria (Fig 7). They form synapses with
Purkinje cell somata and thorns (Fig 3A and 7).
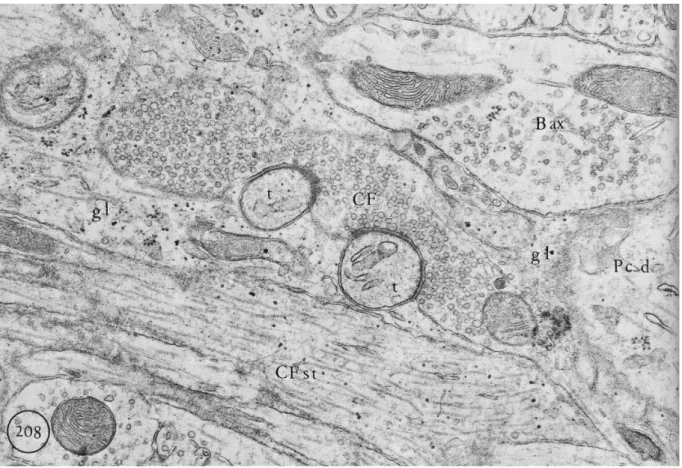
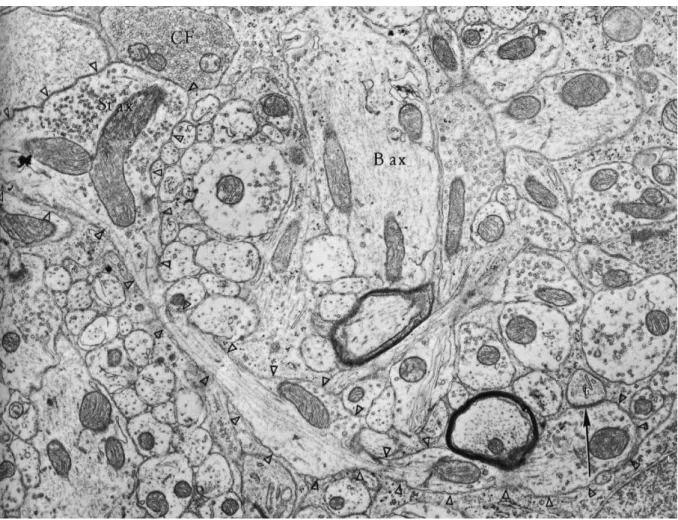
Fig 7: Electron micrograph showing climbing fiber synapses on Purkinje cell thorns.
Climbing fiber stem (CF st) is recognized by its small diameter. Climbing fiber termini (CF) fully filled with round synaptic vesicles makes synapse with two Purkinje cell thorns (t). Moreover a basket cell axon (B ax) can be distinguished as well as neuroglia (gl) and Purkinje cell dendrite (Pc d). Magnification: X39000.
24 Mossy fibers
Mossy fibers are thick (0.4 – 1.5 µm) and myelinated axons which enter in the
granular layer from the white matter. They divide in 20 to 30 collaterals in the granular layer.
Granule cells
Cerebellar granule cells have a globular cell body of 5-6 µm, they are amongst the
smallest neurons in the brain. They are also very numerous and their juxtaposition in one
layer results in the granular aspect of the so-called granular layer (Fig 3). Granule cells
usually emit three or four short dendrites. Their unmyelinated axon projects in the molecular
layer where it bifurcates giving rise to a T-shape in the coronal plan (Fig 3A). The ensemble
of these axons builds a parallel network named “parallel fibers” after Ramόn y Cajal. Before
the bifurcation, granule cell axon is 0.1-0.3 µm whereas the parallel fibers are 0.1-0.2 µm in
diameter. Parallel fibers cross over Purkinje cell dendritic tree and make synapses on Purkinje
cell thorns (Fig 6). They also contact MLIs (Fig 9) and Golgi cells. Parallel fiber termini
(usually containing one or two mitochondria) are filled with round vesicles of 26 – 44 nm that
are often aggregated at one side of the fiber opposite to a thorn or a dendrite (Fig 6 and 9).
Therefore, these synapses are characterized by their asymmetric nature. The parallel fibers
endings are concave and the synaptic cleft is widened (30 nm). On the postsynaptic side, a
postsynaptic density is found (PSD, Fig 6 and 9).
Molecular layer interneurons
Two types of MLIs are classically distinguished according to their localization in the
molecular layer and their connectivity to the Purkinje cell. At first glance, basket cell somata
25 cells sit in the outer two third of the molecular layer (Fig 3). Nevertheless, MLIs can be
considered as a varying single class of cells (Fig 8; Ramόn y Cajal, 1911; Rakic, 1972; Sultan
et Bower, 1998) for many types of studies including the ones I am describing hereby. For
anatomical reasons, I chose to develop the formal description of Palay & Chan-Palay (1974)
which served as a reference for my electron microscopy experiments. Basket cell body is
roughly triangular or ovoid (10 µm) and their dendritic tree extends in the parasagittal plane
(Fig 3A). Their straight dendrites display an irregular contour and their mitochondria become
elongated from 6 to 7 µm with increasing distance from the soma. Synapses between parallel
fibers and basket cell dendrites are asymmetric: parallel fibers endings show round vesicles
aggregated close to the active zone and a PSD is usually observed (Fig 9). In addition, axons
of other basket cells or stellate cells can make synapse with basket cell dendrites. These
synapses are characterized by a symmetrical profile as well as by the elliptical and dispersed
nature of the vesicles (Fig 9). The unmyelined axon of basket cells runs horizontally in the
parasagittal plane among the lower dendrites of Purkinje cells (Fig 3) and projects descending,
ascending and transverse collaterals. Around the Purkinje cell body, basket cell axons
elaborate a characteristic terminal plexus initially referred to as basket, hence the name of “basket cell”. This plexus continues until the initial segment of the Purkinje cell axon resulting in an axo-axonic synapse named “pinceau”. Basket cells axoplasm is easy to
recognize because it is rather poor in organelles including a few mitochondria of 0.3-1 µm in
diameter. Basket cell axons (the largest axons of the molecular layer with a diameter from 1 to
3 µm) make en passant synapses with dendrites and somata (Fig 10, example for Purkinje cell
somata). The synapses between basket cells and Purkinje cell somata or dendrites are
symmetrical. More or less elliptical vesicles of 40-60 nm in diameter appear dispersed and
loosely aggregated at basket cell termini. At the actual “basket”, axons are around 0.5 to 3 µm
26
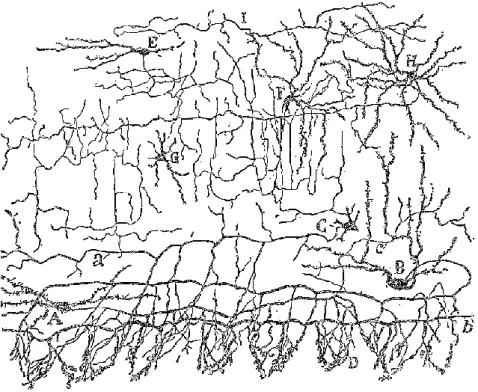
Fig 8: MLIs from rabbit cerebellum.
Drawing shows many different MLIs morphology. A,B: basket cells, E: stellate cells, F-G: intermedi-ate morphology, a: axon, b: basket.
(From Ramόn y Cajal, 1911).
Fig 9: Micrograph of synapses on basket cell dendrite.
A dendrite (Bc d) emerges from basket cell somata (BC). Six synapses formed by parallel fibers (*) and two by a basket cell axons (B ax) were detected.
Magnification: X 25500
27 Palay & Chan-Palay (1974) described two classes of stellate cell namely superficial
short axon cells and deeper long axon cells. Superficial short axon cells are the only neurons
located in the upper part of the molecular layer. Their ovoid somata exhibit a diameter of 5-9
µm, their short dendrites as well as their short and branched axons (40 µm) project under the
pial surface. Similarly to basket cells, their dendrites and axon are comprized in the sagittal
plan. Deeper long axon cells stand in the middle third of molecular layer bear somata of
around 12 µm in diameter. They have very long axons (450 µm), which run in the parasagittal
plan and go through Purkinje cell dendritic trees. They can establish synapses with Purkinje
cell somata and contribute to the pericellular basket. Their dendrites are contacted by parallel
fibers and other MLIs. Interestingly, parallel fiber synapses are eventually found on stellate
cell somata. Their axonal varicosities (about 0.1 µm in diameter) contain small elliptic
vesicles make synapses with Purkinje cell thorns and somata, Golgi cells and other stellate
and basket cells. The structure of the synapse is always symmetrical with unaggregated
vesicles (Fig 11). In comparison to basket cell, deeper long axon cells exhibit contorted
28
Fig 10: Micrograph showing basket cell axon around Purkinje cell somata.
Basket cell axon (B ax, arrowheads) in contact with Purkinje cell somata (PC) make en passant synapses. GABAergic synapses are symmetrical and have dispersed elliptical vesicles (arrows). Axons can be separated from the Purkinje cell somata by neuroglia (*).
Magnification: X 17000
29
Fig 11: Micrograph representing stellate cell and basket cell axons in molecular layer.
Stellate cell axon (St ax, Δ) can be recognized in comparison to climbing fiber (CF) and basket cell axon (B ax). Here the stellate cell axon makes a synapse with a Purkinje cell thorn (t, arrows). Magnification: X 14500
30 Golgi cells
Golgi cells are situated in the granular layer just below the row of Purkinje cell somata.
Their somata is roughly 15 µm in diameter and gives rise to two to four thick dendrites which
extending in the molecular layer. The highly arborized axons of Golgi cells mostly run in the
granular layer but also in the molecular layer (Simat et al., 2007).
Lugaro cells
The lugaro cell fusiform somata of 7 or 8 μm in diameter sits at the top of the granular
layer and their dendrites extend horizontally below the Purkinje cell layer with a bipolar
arborization. Their partially myelined (in the lower part of molecular layer) and highly
branched axons project in the molecular layer in the parasagittal plan as well as in the transverse plan parallel to the parallel fibers. These axons are thicker that parallel fibers (1 μm in diameter) sometimes descend in the granular layer and go through the white matter. They
bear elongated mitochondria and their termini are filled with numerous ellipsoidal and
spherical vesicles. Lugaro cell axons make symmetric synapses with MLIs somata and
dendrites as well as with Golgi cells (Lainé & Axelrad, 1998; Dieudonné & Dumoulin, 2000).
Unipolar-brush cells
Unipolar-brush cells are confined in the granular layer and are characterized by
spherical somata smaller than golgi cells but bigger than granule cells. Their dendritic
brush-like tree receives glutamatergic input from mossy fiber and their axons project on granule
cells.
Glial cells
As mentioned before, five different types of glial cells are present in the cerebellar
31 Bergman cells also named “Golgi epithelial cell” by Palay & Chan-Palay, have their irregular spheroidal cell body in the Purkinje cell layer between two Purkinje cells. They have
ascending and irregular branches projecting horizontally in the molecular layer and they
sheath Purkinje cell dendritic tree, somata and axon initial segment. Only synaptic sites are
not sheathed by Bergman cell process. Their cytoplasm is pale and homogenous with dense
spherical granule of about 25 nm in diameter (Fig 12).
Two different types of astrocytes are present in the cerebellar cortex: velate
protoplasmic and smooth protoplasmic astrocytes. The first type is located in granular layer
and has branches which encircle glomeruli and partially granule cell somata. The second type
is localized in molecular layer and granular layer and they have smooth, long and radiating
processes.
Oligodendrocytes are mostly found in the lower part of the molecular layer as well as
in the Purkinje cell layer close to Purkinje cell somata. They have small and round cell body
(5-6 μm) and they are easily recognized due to their dark cytoplasm (Fig 12). The myelinated
Purkinje cell axons are directly in contact with the oligodendrocyte cell bodies.
NG2(+) cells share a common shape with stellate cells showing a small ovoid cell
body (53 ± 18 µm2); they are frequently found in the molecular layer. Their thick processes
radiate from the cell soma (Levine & Card., 1987).
32
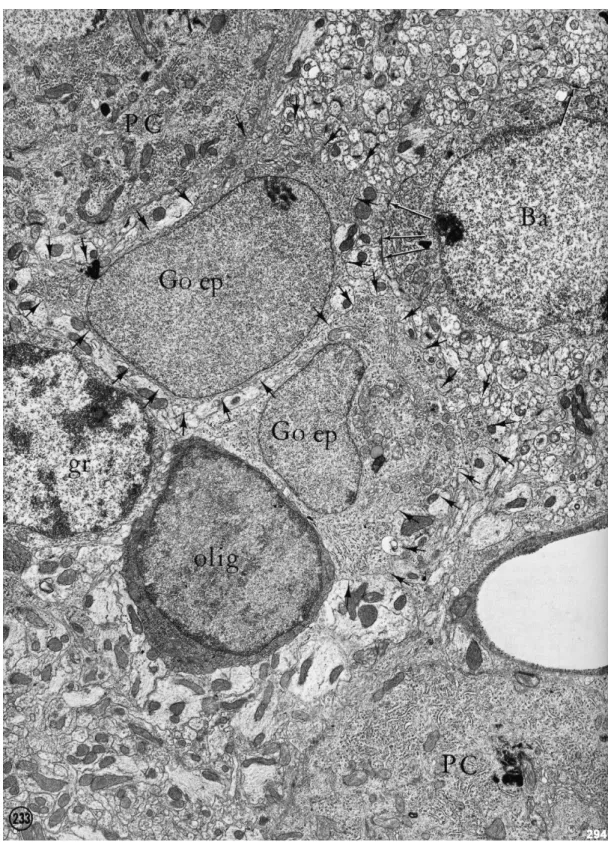
Fig 12: Electron micrograph showing Bergman cells and oligodendrocyte close to Purkinje cell somata.
Bergman cells (Go ep, arrowheads) can be recognizable by their thin nucleoplasmm. Their cytoplasm has neuropil (arrowheads). One oligodendrocyte with dark nucleoplasm and cytoplasm is in the field. Granule cell somata (gr) can be recognized by their localization and their dispersed chromatin. Two Purkinje cell somata (PC) and basket cell somata (Ba) are also present. Note synapses on basket cell somata (arrows).
Magnification: X 11000.
33 1.1.3.3 Neuromodulative innervations.
Five different neuromodulative innervations enter the cerebellar cortex. During my
PhD, I only focused on the noradrenergic innervation. Noradrenergic innervations have been
discovered with radioautoradiographic and fluorescence microscopy studies these latter being
performed after microinjection of a tracer in the locus coeruleus. Noradernergic axons enter
the cerebellar cortex via the superior peduncle and project in the molecular layer and around
Purkinje cells (Olson & Fuxe, 1971; Pickel 1974a,b) where they make asymmetric synapses
on MLIs. They have been visualized in electron microscopy on adult rats using an antibody
against dopamine-beta-hydrolxylase (noradrenaline synthesizing enzyme; Olschowka et al.,
1981). Noradrenergic axons are unmyelined and have two different profiles: thin axon of 0.45
µm in diameter without vesicles and thicker axon of around 1 µm in diameter with two types
of vesicles, large granular vesicles (85-105 nm diameters) and agranular vesicles (35-55 nm
diameters).
Briefly, other neurotransmitters involved in cerebellar modulations are: serotonin,
acetylcholine, dopamine and histamine. Their inputs arise from reticular formation, raphe,
basal ganglia, ventral tegmental area and tuberomammillary nucleus (Schweighofer et al.,
2004) respectively.
1.1.4 Cerebellar cortex post-natal development.
The experiments enclosed in this PhD thesis were performed on young rats (P11-P16)
and older rats (P17-26) for reasons of convenience and homogeneity with previous studies of
the laboratory such as Forti et al. (2000).
Cell localization and synapses set up progressively in the postnatal cerebellum. MLIs
34 Golgi cells. Purkinje cells are present at birth, they move to create the single row of Purkinje
cells until P4 and their dendritic tree grows from P7 up to P30 (Altman, 1972b). Immature
MLIs migrate through the white matter and granular layer to the molecular layer until P20
(Zhang & Goldman, 1996). Basket cells are the first to reach their final position in the
molecular layer and to contact Purkinje cells. Furthermore, granule cell precursor located in
the thick external granular layer progressively exit the cell cycle and then migrate from the
external granular layer through the molecular layer to generate the granular layer from P0
until P21 (Altman, 1972a).
GABAergic synapses are detected at P12 between basket and Purkinje cells and at P15
between stellate and Purkinje cell. Vesicular GABAergic transporter (VGAT) expressing
synapses appear in the molecular layer and on Purkinje cell at P5 and they massively increase
during the second and the third postnatal week (Takayama & Inoue, 2004). Glutamatergic
synapses between climbing fibers and Purkinje cell somata are detected at P7. Moreover,
glutamatergic synapses made by parallel fiber on Purkinje cell dendritic tree are found at P12
(Altman, 1972b). Interestingly, different subtypes of vesicular glutamatergic transporters
(VGLUT1 and VGLUT2) were identified in the cerebellar cortex (Fremeau et al., 2001;
Ichikawa et al., 2002). During the postnatal development, expression of VGLUT1 is replaced
by VGLUT2 after P10 in parallel fiber termini (Miyazaki et al., 2003). Contrary to parallel
fibers, VGLUT2 expression in climbing fiber termini is unchanged during the postnatal
development.
Fig.13, adapted from Altman 1972b, summarizes the main steps of postnatal cerebellar
35 Not so many studies have described the morphology and ultrastructure of MLIs axon
during post-natal development. Palay & Chan-Palay (1974) exclusively studied the adult rat.
Of interest, Altman (1972b) described some basket cell termini on Purkinje cell somata at P12
and P15 (Fig 14). Moreover, Nusser and co-workers described MLIs terminals in young rat
P13-P26 using GABAA receptor immunoreactivity and concluded that the presence of
GABAergic synapses on MLIs is 10-fold less than that glutamatergic synapses (Nusser et al.,
1997). Filling MLIs with biocytin or Lucifer yellow during whole cell recording permitted to
indicate that MLIs axons have a uniform diameter and few varicosities in young rat (P11-15)
versus older rat (P16-P21; Pouzat & Hestin, 1997)
Fig 13: Rat cerebellar postnatal development.
Major events of postnatal development are represented. The width of the molecular layer (left abscissa) increases as a function of rat’s age (columns, d: postnatal days). Parallel fiber time of origin (right abscissa) correspond to their age of their localization in the molecular layer. The external granular layer (here named external germinal layer) is composed of precursors of granule cells and pre-migratory granule cells.
36
Fig 14: Micrographs of basket cell termini on Purkinje cell somata at P12 (upper panel) and P15 rats (lower panel).
Scale bars: 25 µm. (From Altman, 1972b).
37
1.1.5 Characterization of synaptic current recorded in MLIs and Purkinje cells in young rats.
As it is noticed before, Purkinje cells receive inhibitory inputs from MLIs and two
types of excitatory imputs namely from climbing fibers and parallel fibers. The spontaneous
excitatory synaptic currents (EPSCs) are smaller than their inhibitory counterpart (IPSCs)
while recorded in Purkinje cells, the former being mediated by AMPA receptors but not by
NMDA receptors (Konnerth et al., 1990; see Fig. 15A).
Moreover, mean amplitude of miniature IPSCs (mIPSC) recorded in Purkinje cells in
the presence of tetrodotoxine (TTX) to block action potentials is 152 ± 9 pA with high
internal Cl- soltution and their average frequency is 4.3 Hz (Llano et al., 2000).
The major excitatory input of MLIs results from parallel fibers and they receive
inhibitory inputs as a result of GABA release from other MLIs. The first intracellular
recordings of MLIs were performed in a study by Llano & Gerschenfeld (1993a) in which
they show that IPSCs are mediated by GABAA receptors and EPSCs by AMPA receptors.
These authors also documented that the IPSC decay time can be fitted by a double exponential
function with time constants around 10 and 40 ms for the slow and the fast component
respectively. By contrast, the EPSC decay time was fitted by a single exponential function
with a time constant usually around 15 ms. Note that the average IPSC amplitude is roughly
similar to what was reported for Purkinje cell recordings with high internal Cl- solution (Fig
15B).
38 A
B
Fig 15: Spontaneous synaptic current traces recorded in Purkinje cells (A) or in stellate cells (B).
(From Konnerth et al., 1990 and Llano & Gerschenfeld, 1993a).
1.1.6 Characterization of axonal calcium transients in MLIs axons in young rats.
Axonal Ca2+ transients induced by propagated action potentials were first described in
basket cell axons of young rats (Llano et al., 1997; Tan & Llano, 1999). They mainly consist
of large Ca2+ increases appearing in a discrete manner along the axons. These structures were
named axonal “hot spots” and are supposed to correspond to the varicosities commonly
observed in morphological studies. These latter were proposed to materialize en passant
synapses on the Purkinje cell somata and/or branching points of the axon (Fig 16). Such a
balkanization of the Ca2+ signaling was attributed to the high parvalbumin immunoreactivity
39 data suggested that axons need an important endogenous Ca2+ buffering capacity associated
with a high density of Ca2+ channels. Later, Forti et al., (2000) proposed that axonal Ca2+
transients in hot spots are mediated by opening of voltage dependent calcium channels
(VDCCs) predominantly P/Q- and N-type VDCCs in developing MLI termini.
Fig 16: Axonal Ca2+ transients in a basket cell in response to a depolarization.
A) Change of fluorescence is measured in basket cell filled with Ca2+ indicator after a depolarization. Large Ca2+ transients are detected in hot spots (+, x, , ).
B-C) show responses to the depolarization (arrows) in various hot spots at synaptic terminal and in axonal varicosities as a function of time (seconds).
Scale bar in A: 10 µm
(Modified from Llano et al., 1997). Pc
40
1.1.7 Modulation of synaptic currents and axonal calcium transients in MLIs.
The endoplasmic reticulum (ER) of neuron is a dynamic calcium stores which can be
recruited by electrical or chemical signals (Berridge, 1999). Calcium release from ER can be
either mediated through ryanodine receptors (RyR) or inositol 1,4,5-trisphosphate receptor
(IP3R). Of interest, RyR are abundantly expressed in basket cell axon and action potential
induced axonal calcium transients were found to be sensitive to ryanodine (Llano et al., 2000).
Moreover, IPSCs evoked from MLIs in basket/Purkinje cells paired-recording, display an
amplitude and a paired pulse ratio (PPR) that is clearly decreased by ryanodine superfusion (Galante & Marty, 2003). Finally, ‘spontaneous calcium transients’ (SCaTs: spontaneous variation of Ca2+ in axons recorded in presence of TTX) recorded in basket cells axon termini
onto Purkinje cell somata are also sensitive to ryanodine (Conti et al., 2004).
Different isoforms of RyR (RyR1, RyR2 and RyR3) are known to be expressed in the
cerebellum. Purkinje cell mainly expresses RyR1whereas granular cell express RyR2 and the
isoforms present in MLIs are still unidentified to date (Kuwajima et al., 1992; Giannini et al.,
1995; Mori et al., 2000; Sawada et al., 2008).
Several studies have focused on the involvement of RyR in the efficiency of transmitter
release but little is known about the putative contribution of IP3R in neurotransmitter release.
Nevertheless, Kelm et al. (2010) indicated that IP3R is expressed in MLIs terminals and that
ethanol can induce an increase in IPSC frequency onto Purkinje cell through presynaptic IP3R
opening.
As mentioned earlier in this manuscript, the cerebellar cortex receives noradrenergic
inputs from the locus coeruleus. Accordingly it has been shown that noradrenaline can inhibit
Purkinje cell firing (Hoffer et al., 1972). It has been also reported that noradrenaline
superfusion enhances the frequency of spontaneous IPSC and mIPSC recorded in stellate cells
41 It was concluded that activation of presynaptic β2-adrenergic receptors on MLIs axons could
potentiate inhibitory neurotransmission through an increase in cAMP intracellular level.
Moreover, noradrenaline was reported to alter PPR of evoked IPSC recorded in Purkinje cells
42 1.2 Voltage dependent calcium channels.
Voltage dependent calcium channels (VDCCs) typically open in response to
membrane depolarization and specifically mediate Ca2+ influx. Ca2+ ions induce and regulate
many intracellular processes such as muscle contraction, cell proliferation, hormone secretion,
neurotransmitter release and gene expression. Different types of VDCCs are distinguished
according to their biophysical and pharmacological properties (Table 1 for pharmacology).
Based on these criteria, VDCCs are classified as high-threshold activated VDCCs (HVA) or
low-threshold activated VDCCs (LVA). At the molecular level, VDCCs are complex proteins composed of five subunits (α1, β, α2δ and γ) encoded by multiple genes (Fig 17). The principal subunit Cav (or α1) contains the pore, the selectivity filter, the voltage sensor and
interaction sites for auxiliary subunits such as G proteins, RYR and synaptic proteins.
Moreover, Cav subunits contain binding sites for agonists/antagonists and they are therefore
responsible for the unique biophysical and pharmacological properties of VDCCs. Auxiliary subunits such as β, α2δ and γ however, are required for the functioning and trafficking of VDCCs (Fig 17).
1.2.1 The main subunits: α1 subunits or Cav.
In mammals, 10 distinct genes encode for 10 different isoforms of Cav subunits. These
isoforms are grouped in three families: the Cav1 family (Cav1.1-1.4) corresponds to L-type
VDCCs, the Cav2 family (Cav2.1, 2.2 and 2.3) corresponds to the P/Q, N and R-type VDCCs
and the Cav3 family (Cav3.1, 3.2 and 3.3) representing T-type VDCCs (Ertel et al., 2000;
43 within a family and less than 40% among the three families. Cav1 and Cav2 families are high-
HVA whereas Cav3 family is low-threshold activated LVA.
Table 1: Localization, antagonists and cellular functions of VDCCs.
(From Catterall 2005).
1.2.1.1 Structure.
The pore–forming Cav subunit is the largest subunit (190-250 kDa) of the complex. In
absence of crystal structure, sequence analyses predict that Cav subunit is composed by four
homologous distinct domains (I-IV) containing six transmembrane segments (S1-S6) (Tanabe
et al., 1987; Fig 17). The S4 segment contains five to six positively charged amino acids
Channel Current Localization specific antagonists cellular function
Cav1.1 L Skeletal muscle; transverse tubules Dihydropyridines; phenylalkylamines; benzothiazepines Excitation-contraction coupling Cav1.2 L
Cardiac myocytes; smooth muscle myocytes; endocrine
cells; neuronal cell bodies; proximal dendrites
Dihydropyridines; phenylalkylamines;
benzothiazepines
Excitation-contraction coupling; hormone release; regulation of transcription; synaptic integration
Cav1.3 L
Endocrine cells; neuronal cell bodies and dendrites; cardiac atrial myocytes and pacemarker
cells; cochlear hair cells
Dihydropyridines; phenylalkylamines;
benzothiazepines
Hormone release; regulation of transcription; synaptic regulation;
cardiac pacemaking; hearing; neurotransmitter release from
sensory cells
Cav1.4 L
Retinal rod and bipolar cells; spinal cord; adrenal gland; mast
cells
Dihydropyridines; phenylalkylamines;
benzothiazepines
Neurotransmitter release from photoreceptors
Cav2.1 P/Q Nerve terminals and dendrites;
neuroendocrine cells ω-Agatoxin IVA
Neurostransmitter release; dendritic Ca2+ transients;
hormone release
Cav2.2 N Nerve terminals and dendrites;
neuroendocrine cells ω-Conotoxin-GVIA
Neurostransmitter release; dendritic Ca2+ transients;
hormone release Cav2.3 R Neuronal cell bodies and
dendrites SNX-482
Repetitive firing; dendritic calcium transients
Cav3.1 T
Neuronal cell bodies and dendrites; cardiac and smooth
muscle myocytes
None Pacemaking; repetitive firing
Cav3.2 T
Neuronal cell bodies and dendrites; cardiac and smooth
muscle myocytes
None Pacemaking; repetitive firing
Cav3.3 T Neuronal cell bodies and
44 (lysine and arginine) and serves as voltage sensor. The pore structure is formed by
extracellular and partially transmembrane loops between S5-S6 segments (pore loops) in each
domain. The pore loops contain negatively charged amino acids (glutamic acids) involved in
calcium selectivity. The cytoplasmic loops connect the four domains and are involved in
channel regulation (Zamponi, 2003).
A
B
Fig 17: VDCC heteromeric complex.
A) Subunit structure of VDCCs (adapted from Catterall et al., 2005) B) Representation of VDCC heteromeric complex (from Dolphin, 2009)
45 1.2.1.2 Biophysical and pharmacological properties.
HVA VDCCs
HVA VDCCs share common characteristics: they are activated by a strong
depolarization and are blocked by Cd2+ (Catterall et al., 2005). Additionnally, HVA VDCCs
familly members, P/Q, N, L and R-type have different biophysical and pharmacological
properties (Table 1 for pharmacology).
L-type VDCCs open in response to depolarization and mediate long-lasting calcium
current due to their slow inactivation kinetic and are characterized by their large
single-channel conductance (Bean, 1985; Nowycky et al., 1985; Zhang et al., 1993). Table 2
summarizes all biophysical characteristics of Cav1.2 and Cav1.3 subunits.
Cav1.2
Conductance Ba2+ (25 pS) > Sr2+ = Ca2+ (9 pS)
Ion selectivity Ca2+ > Sr2+ > Ba2+ >> Mg2+ from permeability ratios Activation
Va = -17 mV (in 2 mM Ca 2+
; HEK cells); -4 mV (in 15 mM Ba2+; HEK cells) to -18.8 mV (in 5 mM Ba2+; HEK cells and Xenopus oocytes); τa = 1 ms at +
10 mV
Inactivation
Vh = -50 to -60 mV (in 2 mM Ca 2+
; HEK cells), -18 to -42 mV (in 5-15 mM Ba2+; HEK cells, τfast = 150 ms,τslow = 1100 ms; 61% inactivation after 250 ms
in HEK cells (at Vmax in 15 mM Ba 2+
); ~ 70% inactivation after 1s (at Vmax in
2 mM Ca2+); inactivation is accelarated with Ca2+ as charge carrier (Calcium-dependent inactivation: 86% inactivated after 250 ms)
Cav1.3
Conductance Not established Ion selectivity Not established
Activation Va = -15 to -20 mV (mouse cochlear hair cells; 10 mM Ba 2+
); -18 mV (in 15 mM Ba2+; HEK cells) to -37 mV (5 mM Ba2+; 2 mM Ca2+ HEK cells or Xenopus oocytes); τa < 1 ms at + 10 mV
Inactivation Vcalcium-induced inactivation is observed after expression in HEK cells and in h = -36 to -43 mV; τfast = 190 ms, τslow = 1700 ms (at Vmax in HEK cells); cochlear outer hair cells but not in inner hair cells
Table 2: Biophysical properties of Cav1.2 and Cav1.3 subunits
46
Fig 18: Biophysiological description of VDCC currents activated by step depolarization in tsA201 cells.
TsA201 cells express Cav1.2, Cav1.3 (grey), Cav2.2 or Cav3.1 (black) subunits with auxiliary subunits.
a) Average I-V curve relationships
b) Normalized current activated by a step depolarization
c) Averaged activation time constants at different test potentials calculated from exponential fits (From Helton et al., 2005).
When recorded at physiological temperature, the average L-type current presents a
half-maximal voltage activation of -20 mV (Liu et al., 2003) although some L-type channel
complexes can be activated at lower voltage. L-type currents display fast activation kinetic
similar to N-type currents and they are more resistant to steady-state inactivation than P/Q and
N-type currents (Fig 18; Liu et al., 2003; Catterall et al., 2005; Helton et al., 2005). Current
mediated by Cav1.2 and Cav1.3 subunits (Cav1.2 currents or Cav1.3 currents) activate in
response to different voltage waveforms such as action potentials or step depolarization (Liu
et al., 2003; Helton et al., 2005). Moreover, the activation threshold of Cav1.3 is significantly
lower than this of Cav1.2 and (-45.7 mV versus -31.5 mV) accompanied by a faster overall
and a slower inactivation during the depolarizing pulse (Fig 18, Koschak et al., 2001; Xu &
47 L-type VDCCs are sensitive to three groups of blockers: one selective: 1,4-dihydropyridine
(DHP) and two imperfectly selective: phenylakylamines (verapamil) and benzothiazepines
(diltiazem) (Cai et al., 1997 and for review see Catterall & Striessnig, 1992). L-type channels
blockers are well characterized and are used therapeutically for treatment of hypertension
(Triggle, 1992).
DHPs were first synthesized by Arthur Hantzch in 1882 and form now a large family (nimodipine, nifedipine, isradipine….) among which L-type channel agonist and antagonist can be distinguished. DHP antagonists typically block L-type VDCCs in a state and
time-dependent manner and they preferentially bind to the channels in their active conformation
(Bean, 1984; Holz et al., 1988). Cav1.3 and Cav1.2 subunits are not equally sensitive to DHP
antagonists: Cav1.3 currents obtained in response to a step depolarization are incompletely
blocked by DHPs. Interestingly this fact is overemphasized for one DHP antagonist:
isradipine. Isradipine sensitivity is 8.5 fold lower for Cav1.3 than for Cav1.2 subunits
(Koschak et al., 2001). Interestingly, it has to be noted that DHP antagonists fail to block
L-type VDCCs currents opened by action potentials (Helton et al., 2005).
Besides, Schramm et al. (1983) showed that small modifications to nifedipine result in a new
DHP with agonist effect on VDCCs: the BayK 8644 i) induces cardiac and skeletal muscle
contraction; ii) increases the mean open time and the conductance of the channel (Schramm et
al., 1983; Nowycky et al., 1985) iii) shifts the current-voltage (I-V) relationship towards
hyperpolarizing potentials and iv) slows current activation and deactivation. DHP antagonists
and agonists bind with high affinity on the same specific binding sites to Cav1 subunits. The
DHP binding domains involve amino acid residues localized on the domain III of S5-S6 and
48 Like BayK 8466, FPL 64176 a nonDHP agonist enhances Ca2+ current, slows activation and
inactivation kinetics of Cav1.2 current and shifts the IV relationship curve to negative voltage
(Rampe & Lacerda, 1991; Kunze & Rampe, 1992).
In contrast to DHP, phenylalkylamines block the L-type current in a state and use-dependent
manner from the intracellular side of membrane. They bind the Cav subunit on the domain III
and IV of S6 and the pore region (Hescheler et al., 1982; Cai et al., 1997). Furthermore,
benzothiazepines block L-type current in a use and state-dependent manner binding
extracellularly on the domain IV of S5 and S6 (Watanabe et al., 1993; Cai et al., 1997). Very
recently, Kang and co-workers developed a new potent and highly selective Cav1.3 subunit
antagonist bearing an IC50 as low as 1.7 µM for Cav1.3 versus1162 µM for Cav1.2, the
(1-(3-chlorophenethyl)-3-cyclopenylpyrimidine-2,4,6-(1H,3H,5H)-thione called compound 8 in my
thesis; Kang et al., 2012).
For many years P- and Q- type VDCCs were considered as two different VDCCs due
to their different biophysical and pharmacological properties: P-type current was observed in Purkinje cells (Llińas et al., 1989) whereas Q-type current was seen in granule cells (Randall & Tsien, 1995). A later study showed that Cav2.1 knockout (KO) mice neither displayed
P-type current in Purkinje cells nor Q-P-type current in granule cells (Jun et al., 1999). Finally, the
results presented by Bourinet et al. (1999) indicated that alternative splicing of the gene
encoding Cav2.1 generates P-type and Q-type channels as well as multiple phenotypic variants.
As a consequence, P- and Q- type VDCCs are now grouped as P/Q-type VDCCs. N-type VDCCs (for “neuronal”) were exclusively cloned from brain (Catterall et al., 2005). Interestingly, like P/Q-type VDCCs, they are mostly localized in neuron terminals. Table 3
49
Cav2.1
Conductance 9, 14, 19 pS (P-type, cerebellar Purkinje neurones); 16-17 pS (for α1A/α2δ/β in Xenopus oocytes)
Ion selectivity Ba2+ > Ca2+
Activation
Va = -5 mV for native P-type, Va = -11 mV for native Q-type
(with 5 mM Ba2+ charge barrier) Va = -4.1 mV for rat α1A-a/α2δ/β4
Va = +2.1 mV for rat α1A-b/α2δ/β4 (with 5 mM Ba 2+
charge
carrier) Va = +9.5 mV; τa = 2.2 ms at +10 mV for human α1A-1/α2δ/β1b
in HEK293 cells (with 15 mM Ba2+ charge carrier)
Inactivation
Vh = -17.2 mV for α1A-a/α2δ/β4; Vh = -1.6 mV for α1A-b/α2δ/β4
(with 5 mM Ba2+ charge carrier); Vh = -17 mV, τh = 690 ms at
+10 mV human α1A-1/α2δ/β1b in HEK293 cells (with 15 mM
Ba2+ charge carrier), τh > 1 s at 0 mV native P-type (with 5
mM Ba2+ charge carrier) Cav2.2
Conductance 20 pS (bullfrog sympathetic neurones); 14.3 pS (rabbit BIII cDNA in skeletal muscle myotubes)
Ion selectivity Ba2+ > Ca2+
Activation VHEK293 cells, 15 mM Baa = +7.8 mV, τa = 3 ms at +10 mV (human α2+ 1B/α2δ/β1-3 in
charge carrier); Va = + 9.7 mV, τa
= 2.8 ms at +20 mV (rat α1B-II/β1b, in Xenopus oocytes, 40 mM
Ba2+ charge carrier)
Inactivation Vh = -61 mV, τh~200 ms at +10 mV (human α1B/α2δ/β1-3 in
HEK293 cells, 15 mM Ba2+ charge carrier); Vh = -67.5 mV; τh
= 112 ms at +20 mV (rat α1B-II/β1b in Xenopus oocytes, 40 mM
Ba2+)
Table 3: Biophysical properties of Cav2.1 and Cav2.2 subunits.
(From Catterall et al., 2005).
P/Q type VDCCs currents are blocked by two neurotoxins: ω-agatoxin VIA isolated from Agelenopsis aperta spider venom and ω-conotoxin MVIIC purified from the venom of Conus magnus, a marine snail. Both toxins bind to an extracellular site on Cav2.1 subunits but they
50 act according two different mechanisms. ω-agatoxin VIA stabilize the channels closed state (McDonough et al., 1997) whereas ω-conotoxin MVIIC is a pore blocker (McDonough et al., 2002).
N-type VDCCs are blocked by conotoxine MVIIC and also by a specific blocker: the
ω-conotoxin GVIA (peptide isolated from Conus geographus marine snail vemon, see Catterall
et al., 2005 for review).
R-type (for “residual”) currents flow throw channels based up on the Cav2.3 subunit
and are resistant to DHP, ω-agatoxin GVIA, ω-conotoxin GVIA and ω-conotoxine MVIIC
(Randall & Tsien, 1995; Randall & Tsien, 1997). Note that biophysical characteristics of
Cav2.3 subunits are summarized in Table 4.
Cav2.3
Conductance Not established Ion selectivity Ba2+ ~ Ca 2+ (rat); Ba2+ > Ca2+ (human) Activation Va = +3.5 mV , τa = 1.3 ms at 0 mV (human α1E/α2δ/β1-3, 15 mM Ba 2+ charge
carrier in HEK293 cells) Va = -29.1 mV , τa = 2.1 ms at -10 mV (rat α1E/α2δ/β1b, 4 mM Ba2+ chage
car-rier in Xenopus oocytes)
Inactivation Vh = -71 mV, τh = 74 ms at 0 mV (human α1E/α2δ/β1-5, 15 mM Ba 2+
charge carrier in HEK293 cells); Vh = -78.1 mV, τh = 100 ms at - 10 mV (rat
α1E/α2δ/β1b, 4 mM Ba 2+
charge carrier in Xenopus oocytes)
Table 4: Biophysical properties of Cav2.3 subunit.
(From Catterall et al., 2005)
They are inhibited by two non-specific blockers such as nickel ion (IC50 = 27 µM) and
mibefradil (IC50 = 0.4 µM) (Jiménez et al., 2000) as well by a selective partial antagonist:
SNX482 (IC50 = 15-30 nM), a toxin isolated from an African tarantula, Hysterocrates gigas
51 LVA VDCCs: T-type VDCCs
Compared to HVA, Ttype VDCCs currents display a low threshold (between 70 to
-50 mV, peak around -30 mV) and fast activation kinetics (See Table 5 and Fig 18, Catterall et
al., 2005; Helton et al., 2005). Cav3.1, Cav3.2 and Cav3.3 currents are blocked by nickel ion
(respectively IC50 = 250, 12 and 216 µM), by mibefradil (Lee et al., 1999, Martin et al., 2000)
and by amiloride (Todorovic & Lingle 1998; Monteil et al., 2000). Pharmacology of T-type
VDCCs is summarized in Lory & Chemin (2007). Recently, a specific and reversible T-type
VDCCs antagonist
(3,5-dichloro-N-[1-(2,2-dimethyl-tetrahydro-pyran-4-ylmethyl)-4-fluoro-piperidin-4-ylmethyl]-benzamide, called TTA-P2) was created by Shipe et al., (2008) and is
nowadays acknowledged as the most specific T-type current blocker (Boehme et al., 2011;
Choe et al., 2011; Dreyfus et al., 2010; Eckle et al., 2012; Evans et al., 2013).
Cav3.1 Conductance 7.5 pS Ion selectivity Sr2+ > Ba2+ = Ca2+ Activation Va = -46 mV , τa = 1 ms at -10 mV Inactivation Vh = -73 mV, τh = 11 ms at -10 mV Cav3.2 Conductance 9 pS Ion selectivity Ba2+ = Ca2+ Activation Va = -46 mV , τa = 2 ms at -10 mV Inactivation Vh = -72 mV, τh = 16 ms at -10 mV Cav3.3 Conductance 11 pS Ion selectivity Ba2+ = Ca2+ Activation Va = -44 mV , τa = 7 ms at -10 mV Inactivation Vh = -72 mV, τh = 69 ms at -10 mV
Table 5: Biophysical properties of Cav3.1, Cav3.2 and Cav3.3 subunits.
52
1.2.2 Auxilliary subunits.
In the case of HVA VDCCs, the Cav subunit is generally associated with a cytoplasmic
β subunit, a membrane-anchored extracellular α2δ subunit and a γ subunit (Fig 17). The auxiliary subunit composition of LVA is not yet completely understood.
Amongst calcium channel auxiliary subunits, the β subunit is the most intensively studied. In mammals, four β subunit isoforms have been identified (β1, β2, β3 and β4) and are encoded by four different genes (see Birnbaumer et al., 1994 for review). All β subunits have several splice variants such as the β1a, β1b and β1c splice variants for β1 (See Dolphin, 2003a for review). All 4 beta subunits are known to be expressed in the CNS (Williams et al., 1992;
Collin et al., 1993; Ludwig et al., 1997, Vendel et al., 2006). The β subunits is a cytosolic
protein that contains an src homology 3 (SH3)/guanylate kinase (GK) domain (Fig 17B).
They bind with high affinity to a conserved region of 18 residues on the intracellular I-II loop
of Cav subunit via their GK domain as well as to the C or N termini of Cav subunit with lower
affinity. In association with Cav1 and Cav2 subunits, all β subunit isoforms, increase calcium
current amplitude, shift the voltage-dependence towards more negative values and modify
channel inactivation and activation properties (see review Buraei & Yang, 2010). The β
subunit has been shown to increase the number of P/Q-type VDCCs at membrane surface by
masking ER retention signal on Cav subunit (Bichet et al., 2000). The I-II loop of the β
subunit was suggested to be an ER export signal motif and accordingly the β subunit increases
surface density of channels by binding I-II loop of Cav1.2 subunit for instance (Fang &
Colecraft, 2011). In the cerebellum β subunits seem to play a role in the developmental regulation of VDCCs and bear different subcellular localizations. Indeed, β1, β3 and β4 subunits expression increase in mice from birth to adulthood. Whereas β1 and β3 are predominantly located in Purkinje cell dendrites, β4 is usually detected in dendrites and axons (Ferrándiz-Huertas et al., 2012).