_________________________________
University of Liège, Civil and Mechanical Engineering Institute (B 52/3). Chemin des Chevreuils, 1, B - 4000 LIEGE, Belgium – Phone: 32.4.366.93.50 – Fax: 32.4.366.92.38 – Email: Luc.Courard@ulg.ac.be
Effects of the presence of free lime nodules into concrete:
1experimentation and modelling
23
Luc COURARD*, Hervé DEGEE, Anne DARIMONT 4
University of Liege, Department of Architecture, Geology, Environment and Constructions,
5 Belgium 6 7 8 ABSTRACT 9
When nodules of lime are embedded into concrete, the expansion 10
accompanying the transformation of CaO into Ca(OH)2 induces stresses and
11
strains in both the lime nodule and in the concrete matrix. The concrete cover 12
thickness, the diameter and the shape of the lime nodule as well as the 13
mechanical characteristics of concrete and lime are the key parameters 14
influencing the development of internal pressure and hence controlling the risk 15
of cracking or pop-out. In order to study the effect of lime into cementitious 16
concretes, laboratory investigations and modelling have been performed and 17
show that the minimum cover thickness necessary to avoid the development of 18
the pop-out phenomenon is estimated of the order of half the diameter of the 19
inclusion. This is coming from the observation that expansion happens inside 20
the porosity of the hydrated lime Ca(OH)2: ESEM and DRX analysis confirm
21
the effect of confinement in the development of crystals. 22
Keywords: hydration, mechanical properties, CaO, concrete, pop-out. 24 25 1. Introduction 26 27
Lime has been used for a very long time in construction and buildings: Roman cement 28
was already made of a part of lime while it remained the only binder used until modern 29
cement were designed during XIXth century [1]. Lime is an industrial product obtained by 30
calcination of limestone in a lime kiln [2]. This is described as a bright lime (Table 1), 31
because of its high reactivity with water. The bulk density of the limestones industrially used 32
for the manufacture of lime usually offers a lower density than calcite used for ornamental 33
stones: porosity maybe up to 30% [3]. Quick lime is very reactive with water and hydrates are 34
quickly formed [4]. Hydration process is accompanied by a significant proliferation (Table 1). 35
The formation of Ca(OH)2 yields in larger volume (expansive reaction). The ratio of volume
36
change from CaO particle to Ca(OH)2 is 33.1/16.8 ≈ 2.
37 38
Table 1 39
Hydration of quick to hydrated lime [2, 3]. 40
Property CaO + H2O → Ca(OH)2
Molecular weight 56.08 18.01 74.09
Bulk density (g/cm3) 1.40 -1.90 0.45 -0.65
Specific density (g/cm3) 3.33 1 2.24
Molar volume (cm3/mole) 56.08/3.33=16.8 74.09/2.24 = 33.1
41
The doubling of the molar volume (from 16.8 to 33.1 cm3/mole) is responsible for expansion 42
during hydration [4]. The intensity and speed of hydration are governed by lime purity, 43
particle size, surface area, ...etc [5]. Burning temperature and kiln technology are also two 44
important discriminant factors in the case of industrial lime production [3]. 45
An interesting parameter used to quantify the reactivity of lime is the so-called T60, 46
which is measured in accordance with standardized method EN 459-2:2001. It gives the speed 47
of lime extinction, or the time needed to attempt a temperature of 60°C: the smaller it is, the 48
more reactive the lime is. In some cases, the lime can be dead burned, leading to high density 49
CaO grains. [4]. This dead burn lime hydrates very slowly because of a reduced porosity [6]. 50
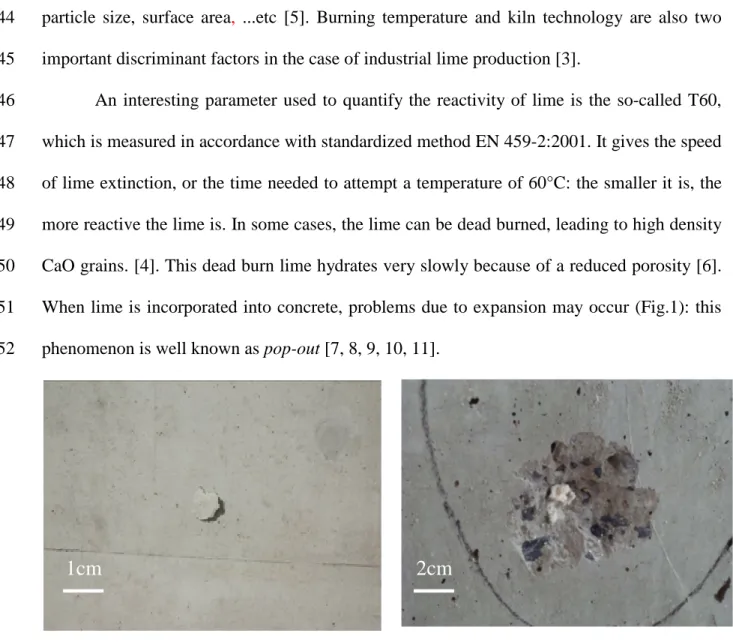
When lime is incorporated into concrete, problems due to expansion may occur (Fig.1): this 51
phenomenon is well known as pop-out [7, 8, 9, 10, 11]. 52
Fig. 1. Degradations induced by pop-out in concrete. 53
In many cases, quick lime is present in steel or iron slags [8, 9]. That means that it is 54
rarely in the form of millimeter-sized aggregate in a confined environment. In the case of steel 55
slags, Deng et al. [10] observed that expansion rates are depending on the type of cement and 56
the percentage of lime: for lime contents of 2 and 5% (by weight of cement), the maximum 57
observed rate of expansion is 0.12 and 0.7%, respectively, for cement type CEM I. The 58
expansion force is estimated at 11.87 MPa at 3 days. A “dead” lime was used for 59
experimentation and required alkali activation: the concentration of OH-ions in the pore 60
solution of cement paste controls the expansion by affecting the positions occupied by the 61
2cm
1cm
crystals of Ca(OH)2 and the pressure of crystallization. Analyzes of the behaviour of LD steel
62
slags containing lime nodules [11] were also conducted as a result of damage observed. An 63
expansion rate of 0.16% (measured by immersion according to the Korean standard KS F 64
2580) was considered. The finite element calculations show that the depth of the pop-out 65
increases as concrete strength decreases and the diameter of the slag increases (Fig. 2). 66
Fig. 2. Concrete cover versus diameter of the slag for different concrete types (from [11]) 67
Other authors [12, 13] made investigations on fine lime particle coming from 68
shrinkage preventing agents or wrong cement manufacturing. 69
Useful information may be found through the study of other expanding processes [14]: 70
Alkali Aggregate Reaction (AAR) should induce similar stresses inside concrete. A difference 71
is however coming from the easier fulfilling of aggregate cracks by the silica gel which 72
progressively replaces a part of the initial products present along the edge of stone material. 73
74
With regard to the very poor information coming from literature reviewing, it clearly 75
appears a lack of knowledge on the behaviour of quick lime aggregates (up to 20mm 76
diameter) when mixed into concrete. A risk evaluation analysis is needed: it will be based on 77
an experimental program and modelling that will help for understanding free lime behaviour 78
in confined situation. 79
80
2. Stresses calculation and modelling: theoretical background 81
2.1. Simplified approach
82
As a first simplified preliminary approach, it is considered that the swelling pressure is 83
unable to induce cracking in the concrete as a nodule of lime can merely be considered as an 84
air bubble, whose effect is increasing the porosity and, consequently, decreasing the 85
compressive strength of concrete. Bolomey and Feret theories can be used to quantify this 86
phenomenon [15]. 87
Based on the equation p (aggregates) + s (sand) + c (cement) + w (water) + v (voids) = 88
1, which expresses the sum of the volume fractions for 1 m³ of concrete, we have, with λ = 89
(c/(c + w + v)), the Feret formula which expresses the relationship between the compressive 90
strength of concrete and the voids (v): 91 c 0 2 0 2 0 cube c, with K K .R v w c c K K f = + + = =
λ
(1) 92where fc,cube is the compressive strength (MPa), K is a granular coefficient and Rc = the
93
compressive strength of cement measured on standardized mortar (EN 196-1), 94
This clearly indicates that the compressive strength decreases when the w/c ratio 95
increases. If we express this equation as a function of W and C (mass ratio) for a cement 96
relative density of 3.15, the expression can be written: 97 2 0 , ) V ( C W 3.15 1 1 . + + =K fccube (2) 98
It is experimentally observed that K is about 4.9 for ordinary concrete [16]. Bolomey formula 99
also suggests a linear relationship between the compressive strength and the ratio C/W. 100
= 1 cube c, -h W C k f 101
where k (26 – 36) and h1 (0.45 to 0.87) depend on the quality of the cement, the age of the
102
concrete, the shape and dimensions of the test pieces, the curing conditions and the sieving 103
curve of aggregates and sand. 104
The volume occupied by the nodules can be considered as an additional volume of water 105
in the sense of increasing W/C ratio; that will partially produce an additional volume of air 106
after curing and evaporation. If we consider for example a W/C = 0.5 and a bulk density of 107
lime 1.56 [3], the volume occupied by the nodules, for a percentage of 0.3% of the mass of 108
aggregates into concrete (1300 kg/m³ of concrete), would be: 0.003 x 1300/1560 = 0.0025 m³ 109
= 2.5 litres. This means that we can consider a fictitious increase of the amount of water for a 110
350 kg concrete cement of about 2.5 litres, which means a total of 175 + 2.5 = 177.5 litres. 111
The W/C ratio increases thus from 0.50 to 0.507. Feret formula allows estimating the 112
resulting loss of strength [16]: 113
(
)
(1 3,15 0,51)² 1 / 3,15x0,50 1 1 2 x + + = 1.017 114This corresponds to a loss of strength of about 1.7%. 115
This evaluation clearly shows that the influence of nodules inside the concrete has a very 116
marginal impact on the major structural characteristic of concrete: compressive strength is 117
only lightly affected by a reasonable level of pollution by lime nodules. 118
119
However, if these nodules are close to the surface, they are likely to induce pop-out and 120
cracking, which is detrimental for concrete structure durability [17]. Only few data are 121
available on this subject in the literature [10, 12, 18] and mainly deals with the effect of the 122
nodules of lime in steel slag, most often used as aggregates for making concrete blocks [11]. 123
These slags contain mostly dead-burned lime nodules, much slower to react because more 124
compact than the type of lime considered here. 125
Specific theoretical developments have thus been carried out to assess the risk of such 126
phenomena. Cracking and the emergence of a burst are indeed conditioned by a number of 127
factors related to the materials: 128
• the depth of the nodule, 129
• the diameter of the nodule, 130
• the concentration of nodules, 131
• the conditions of confinement of the nodule of lime (rate of expansion, swelling 132
pressure), 133
• tensile strength of the concrete, 134
• modulus of rigidity of lime (and hydrated lime) and concrete. 135
For this purpose, simple theoretical models are proposed. These models are based on 136
the mechanics of materials and on the theory of elasticity. The study also assesses the 137
sensitivity of the mechanical effects with respect to the various relevant physical parameters. 138
Two configurations are studied. The first one considers a nodule embedded within the 139
concrete mass: the objectives are in this case to estimate the influence zone of the nodule and 140
the possible risks of interaction between neighbouring nodules, as well as the risk of crushing 141
or cracking of the concrete in the vicinity of the nodule. The second situation is considering a 142
nodule located near the free surface of the concrete, with the main objective of evaluating the 143
risk of occurrence of a pop-out phenomenon. 144
2.2. Modelling of expansive nodule inside a rigid medium
145
2.2.1. Behaviour of a nodule embedded within concrete
146
Model 1 used in this situation considers a spherical nodule in perfect contact with an 147
environment encompassing infinite dimensions. Both media are assumed to exhibit an elastic 148
behaviour. Although both materials are known to be largely inelastic, this model is however 149
appropriate for low level of stresses – and in particular to estimate the initiation of cracking – 150
and can also provide a good understanding of the physical phenomena with a limited 151
computational effort. 152
Model 1 (Fig. 3) is based on the assumption that the swelling of the nodule is partially 153
prevented by pressure developing at the interface between concrete and lime and confining 154
the nodule. This pressure depends on the mechanical properties (elastic modulus and 155
Poisson's ratio) of the two materials, as well as on the amplitude of the swelling as it would be 156
observed if the nodule was perfectly free to expand upon hydration. Assuming a spherical 157
symmetry of the problem and a perfect compatibility of the displacements at the interface 158
between lime nodule and concrete matrix, the pressure can be calculated using equation 3, on 159
the base of the relations proposed in [19] for spherical containers under internal or external 160 uniform pressure: 161 (3) 162 with 163 (4) 164 and 165 (5) 166
where EL and EC are the elastic modulus of hydrated lime and concrete, respectively, νL and
167
νC are the Poisson's ratio of hydrated lime and concrete, respectively, R is the initial radius of
168
the nodule and ∆R the variation of the radius of the nodule due to hydration process. 169
∆R/R ratio can be directly related to volume variation by means of equation 6:
(6) 171
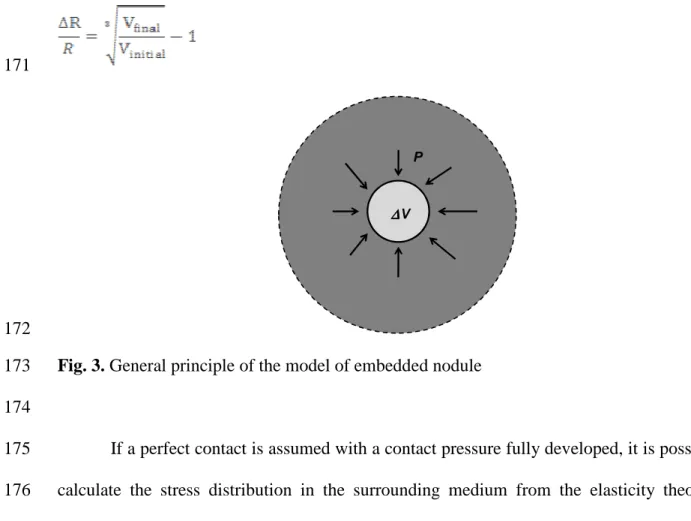
∆∆∆∆V P
172
Fig. 3. General principle of the model of embedded nodule 173
174
If a perfect contact is assumed with a contact pressure fully developed, it is possible to 175
calculate the stress distribution in the surrounding medium from the elasticity theory, as 176
proposed in [19]. It is needed to distinguish compressive stresses σr, acting in radial direction,
177
and tensile stresses σt, oriented in the circumferential direction. They are given by equations 7
178 and 8, respectively: 179 (7) 180 and 181 (8) 182
In these equations, the stresses are positive in tension and negative in compression. 183
Furthermore, D is the diameter of the inclusion and z is the distance from the interface 184
concrete/inclusion to the considered point inside the concrete. 185
These stresses can then be compared to the compressive and tensile strength of the 186
concrete in order to assess the risk of a local crushing around the nodule or of occurrence of 187
radial cracks associated with circumferential tension in the vicinity of the nodule. On the 188
other hand, the model allows estimating the area of concrete mechanically disturbed by the 189
presence of a swelling nodule. 190
2.2.2. Effect of a nodule in the vicinity of the concrete surface
191
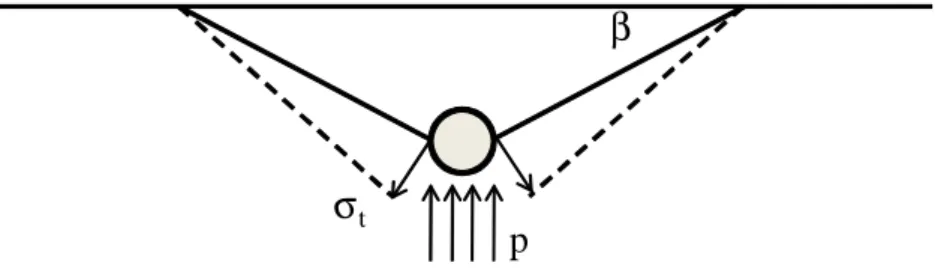
A second model (Fig. 4) is used to assess the risk of local bursting of concrete (pop-192
out). It is now assumed that the swelling pressure is no more balanced by a stress distribution
193
with spherical symmetry, but rather by a tensile stress distribution varying linearly from the 194
inclusion towards the surface and distributed on a truncated cone. 195
Based on this failure pattern, one can evaluate the maximum tensile stress acting at the 196
base of the truncated cone with the following equation: 197
(9)
198
where R is the radius of the nodule, p is the pressure induced at the interface between nodule 199
and concrete, e is the thickness of concrete covering and β is the angle of the ejection cone 200
with respect to the concrete surface. Equation 9 simply translates the fact that the resultant of 201
swelling pressure acting on the bottom part of the nodule is directly balanced by the vertical 202
resultant of tensile stresses acting at the surface of the ejection cone and that the pop-out 203
effect is initiated when the local tension stresses exceed the tension resistance of the concrete 204
matrix. 205
207
Fig. 4. Principle of concrete rupture due to near-to-surface swelling nodule 208
209
Based on the evaluation of the swelling pressure obtained from model 1, tensile stress can be 210
calculated from model 2 and compared to the tensile strength of concrete to assess the risk of 211
pop-out. 212
213
3. Description of the experimental program 214
215
The objectives of the experimental investigations and analyses were: 216
• to observe the behaviour of a lime nodule embedded into concrete, 217
• to quantify expansion rate of lime, 218
• to characterize the quality of hydrated lime (densification process), 219
• to select data for calculation modelling (expansion and compressibility modulus of 220
free lime). 221
222
3.1. Selection and preparation of materials
223
Free lime (from 80 to 120 mm limestone blocks) is representative of a production 224
process with a classical reactivity (T60 = 2 min17 s) and purity; density is equal to 1.44 g/cm3.
225
Samples (Φ = 18.5 mm and H = 15 to 20 mm) are cored in the lump lime. Concrete blocks of 226
(190x190x85) mm³ have been firstly used to simulate confining effect. They provide a 227
p
σ
tcompressive strength of 15 N/mm2 and a density of 2.2 g/cm3. This type of porous concrete 228
has been selected in order to favour water transmission and lime reaction. 229
230
3.2. Confining operations
231
A cylindrical opening of 19 mm diameter (Fig. 5a) and 25 mm deep (Fig. 5b) is cored 232
in the blocks by means of a drill. To study the impact of the situation of the nodule of lime 233
from the concrete surface, the holes are made at different distances from the edge of the 234
concrete block (Fig. 5c). To ensure the best confinement possible, finishing cylindrical 235
orifices are performed with quick-setting cement to fill the cone left by the bit, to smooth the 236
cylinder walls and to repair the damaged edge of the whole drilling. However, despite these 237
precautions, confinement is not perfect: the top surface of the block is not perfectly flat and a 238
minimum clearance is required to introduce the carrot in his hole (Fig.5d). 239
(c) (d) Fig. 5. Preparation of the concrete blocks.
240
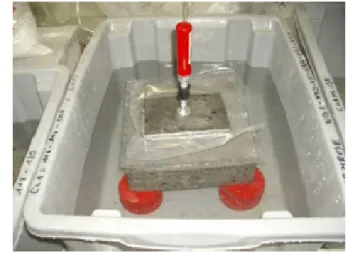
The confinement of the concrete block is then ensured by steel plates and clamps. A plastic 241
sheet is inserted under the steel plate for preventing any reaction between lime and steel (Fig. 242
6). The assembly is then immersed in water and the water level is adjusted under the top edge 243
of the block (Fig. 7). 244
Fig. 6. Confinement of the free lime nodule inside the concrete.
Fig. 7. Immersion of the concrete block into water.
245
A reference test is made in order to check the time needed for a complete hydration of 246
a free lime cylinder: it was measured that 67 hours storage into water allowed a full hydration 247
of the sample by means of water transfer through the porosity of the sample. 248
The blocks are then cut with a diamond saw (dry) at the right and the edge of the 249
nodule, in order to observe possible internal cracks. Hydrated lime cores are then recovered, 250
measured, weighed and analyzed on the base of the loss on ignition at 100 °C (moisture 251
measurement) and 600 °C (measuring the rate of hydration). 252
3.3. X Ray Diffraction and Microscopical analysis
253
X Ray Diffraction anlyses have been carried out in order to determine the mineralogy 254
of the crystals and the nature of the hydrated products. 255
Samples observed with Environmental Scanning Electron Microscope (ESEM) are 256
similar to the one used for XRD investigations. The samples are glued on metal pads using a 257
conductive adhesive. The specimens are thus metallized with Pt before being introduced into 258
the vacuum chamber of a scanning electron microscope ESEM. The electron beam gives a 259
view of topography and shape of hydrated lime. EDAX (Philips) system, coupled with ESEM, 260
allows the detection of elements identified on a spectrum according to their energy dispersion. 261
These analyses allow obtaining a good identification of different forms of calcium 262
hydroxide crystals under confinement. 263
264
4. Results and discussions 265
4.1. Stress calculation and modelling hypothesis
266
In order to feed the proposed models, data needed are: 267
• Elastic modulus of hydrated lime and concrete, 268
• Poisson's ratio of hydrated lime and concrete, 269
• Variation of volume of nodule during hydration. 270
The elastic modulus and Poisson's ratio of lime are estimated from [20]: the value used 271
for the elastic modulus of 100 MPa and Poisson's ratio is 0.25. Results obtained from the 272
experimental program running in parallel with the present theoretical study indicate similar 273
values (chapter 4). The module of the concrete is of the order of 30 GPa and its Poisson's ratio 274
is considered equal to 0.2. It will be shown later on that the results are quite insensitive to 275
these latter values. 276
The swelling rate is more difficult to estimate. In fact, if the volume variation of the lime 277
during hydration can reach values as high as 200%, these values are only relevant in the 278
absence of any confinement. The tests carried out in the framework of the present study show 279
indeed that the volume variation significantly depends on the stiffness and strength of the 280
confining medium. The results presented in chapter 4 and other tests on lightweight concrete 281
blocks show that, if one measures the change in diameter of cylindrical samples in the 282
direction of confinement (i.e. in the radial direction) for samples with a diameter which is 283
adjusted to the initial hole made in the confining medium, and which therefore are in contact 284
with this medium from the start of the hydration reaction, the average value of ∆R/R is: 285
• 22% for confinement in cellular concrete block of 2 MPa compression characteristic 286
strength, 287
• 16% for confinement in cellular concrete block of 4 MPa compression characteristic 288
strength, 289
• 7% for confinement in a heavy concrete block of 15 MPa compression characteristic 290
strength. 291
These values correspond to respective volume variations ∆V/V of 49, 34 and 15%, 292
respectively. 293
This observation is explained by the fact that, when the confining pressure reaches a 294
sufficient level, it forces the hydration reaction to occur towards the inside of the lime sample. 295
This reaction proceeds thus at constant volume and pressure, but results in a more dense 296
hydrated material. It is therefore expected that its elastic modulus be higher than the reference 297
value of 100 MPa. 298
Equations 7, 8 and 9 cannot be directly applied in the purpose of comparison with the 299
case of cylindrical test samples: the above equations indeed assume a spherical inclusion. The 300
transition to the cylindrical case, however, can be done quite simply by changing the 301 coefficients Cb and Cch: 302 (10) 303 and 304 (11) 305
Taking into account this adaptation, it is possible to evaluate contact pressure developed for 306
the different test conditions (Table 2). 307
308
Table 2 309
Evaluation of the contact pressure vs lime and concrete properties 310 EC (MPa) ∆R/Rmean (%) ∆R/Rmax (%) Pmean (MPa) Pmax (MPa) Cellular concrete block C2 2,000 22 24 32 35 Cellular concrete block C4 4,000 16 19 24 29 Concrete 15,000 7 12 11 19 311
One might conclude from values in table 2 that the pressure required to confine the 312
reaction varies with the material. It must however be noted that the model assumes an elastic 313
behaviour of the confining material whatever the value of the pressure, while an evaluation of 314
the stresses developed in the confining medium for the cellular concrete block case (i.e. σc,max
315
= p and σt,max = p/2) concludes that they exceed by far the resistance of the blocks.
316
Calculations show that, for a sample of 18 mm diameter, the resistance is actually exceeded 317
on a thickness approximately equal to the diameter of the sample. It can therefore be 318
estimated that the effective stiffness of the zone of the confining medium directly surrounding 319
the inclusion is reduced with respect to its reference undamaged value, thereby increasing the 320
value of the coefficient CC and reducing consequently the pressure so as to reach a balanced
321
situation between effective stiffness and pressure. A refined modelling of this phenomenon 322
would however require advanced tools that are considered out of the scope of the present 323
study. One must also note that cracks were indeed observed in the zone surrounding the 324
inclusion for some of the cellular concrete blocks used for confinement tests, which is in 325
accordance with the above conclusions. On the other hand, for an ordinary concrete 326
containment, the calculated level of pressure is such that the stress remains at a level below 327
the resistance of the material. The model reproduces thus correctly the experimental trends. 328
The range of parameters considered for the upcoming parameter studies is defined by: 329
• EC: 7000, 15000 and 30000 MPa, which corresponds to concrete confinement ranging
330
from poor characteristics to ordinary concrete; 331
• EL: 100 to 200 MPa, ranging from a normal value to a value doubled to take into
332
account densification of lime during hydration. Experimental tests shows actually that, 333
for the samples corresponding to hydration in heavy concrete blocks, and thus with the 334
highest densification rate, the value of the measured elastic modulus is about 150 335
MPa; 336
• νL and νC equal to 0.25 and 0.20 (values from the technical literature);
337
• Change in volume of the spherical inclusion varying from 10 to 50%, which 338
corresponds to changes in radius of 3 to 15%. This range roughly sweeps the radius 339
variation observed during tests on hydration inside the heavy concrete blocks 340
(observed values varying between 3 and 12%). 341
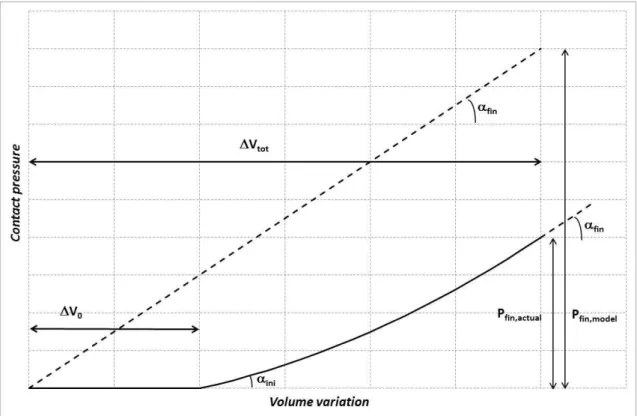
Finally, it must be stated that, as illustrated in Fig. 8, the pressure level provided by the 342
model for a given volume variation (Pfin,model) is obviously an upper bound of the actual value
343
(Pfin,actual) due to the following reasons:
344
• The model assumes that the inclusion and the confining materials are in perfect 345
contact and exhibit a spherical symmetry, while they actually very often show 346
significant shape irregularities. In order to provide order of magnitudes, it is relevant 347
to note that, for same volume variation and initial diameter, the pressure calculated for 348
a cylindrical inclusion is 25% less than the one calculated for a spherical inclusion (i.e. 349
the slope
α
of the real "pressure vs volume" curve is lower than the one given by Eq. 3 350and 6); 351
• The model assumes that the contact is established from the beginning of swelling. In 352
reality, it can be assumed that a part ∆V0 of the measured volume variation is
353
corresponding to the filling of the voids between the inclusion and the matrix; the real 354
pressure should therefore be associated with only a fraction of the volume change; 355
• The model assumes that the elastic modulus of lime is constant throughout the 356
swelling phase, whereas it is in fact a phenomenon whose parameters vary with time. 357
The mechanical characteristics αini of hydrated lime at the initiation of the swelling are
358
corresponding to an unconfined environment and progressively evolve to those (αfin)
359
of hydrated lime properties in confined environment. The model conservatively 360
considers the stiffer situation (αfin) throughout the entire swelling process.
361
The level of conservatism of the chosen modelling assumptions is however quite impossible 362
to quantify. 363
364
Fig. 8. Comparison of the actual and assumed pressure/volume relationship 365
366
4.2. Model exploitation and parametric study
367
4.2.1. Evaluation of the contact pressure
368
Results of the calculation of the contact pressure are presented on Table 3. It is showed 369
that pressure is roughly independent from the quality of concrete. However, results are clearly 370
influenced by the rigidity of the lime and the variation of the volume: estimated pressure 371
ranges from 6 to 57 MPa (this latter value is clearly unrealistic but defines an absolute upper 372
bound that would never be overtaken even for the worst conditions). It has also to be 373
mentioned that a possible variation of the Poisson's ratio of the lime could induce significant 374
variation of the pressure: e.g. for an elastic modulus equal to 100 MPa, a variation of volume 375
corresponding to 30% and Poisson's ratio equal to 0.2, 0.25 and 0.3, resulting pressure is 376
equal to 15, 18 and 23 MPa respectively. 377
For the reasonable average values of the parameters (EL = 150 MPa and volume
378
variation of 20%), pressure is up to 19 MPa, which is however a clearly conservative estimate 379
of the real pressure, as illustrated on Fig. 8. 380
381
Table 3 382
Evaluation of the contact pressure vs E modulus of lime (EL) and concrete (EC) and volume
383
(radius) variation of lime 384 EL (MPa) ∆V/V (%) ∆R/R (%) p [EC=7000] (MPa) p [EC=15000] (MPa) p [EC=30000] (MPa) 100 10 3 6 6 6 20 6 12 12 12 30 9 18 18 18 40 12 23 24 24 50 14 28 29 29 150 10 3 9 10 10 20 6 18 19 19 30 9 27 27 27 40 12 35 35 35 50 14 42 43 43 200 10 3 12 13 13 20 6 24 25 25 30 9 35 36 36 40 12 46 47 47 50 14 56 57 57 385
4.2.2. Stress distribution
386
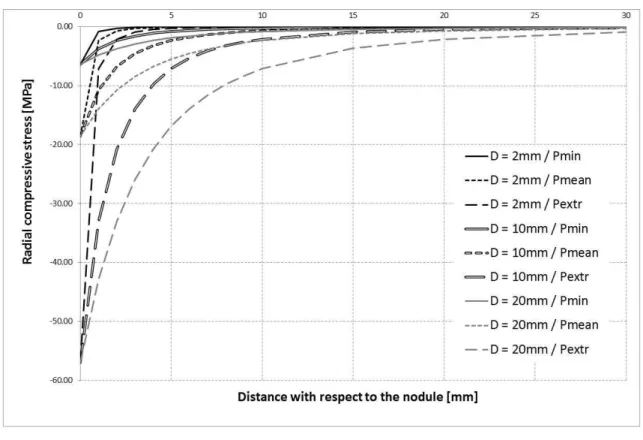
Compressive and tensile stress distributions are given in Figs. 9 and 10 for several 387
values of pressures and nodule diameters. Curves are corresponding to 3 levels of pressure 388
taken from Table 3: 389
• Pmin = 6 MPa (pressure calculated on the base of minimalistic hypotheses),
390
• Pmean = 19 MPa (pressure conservatively calculated on the base of most probable
391
hypotheses), 392
• Pextr = 57 MPa (pressure upper bound calculated on the base of extreme hypotheses).
393
Values of stresses are calculated for 3 lime nodule diameters: 2, 10 and 20 mm, respectively. 394
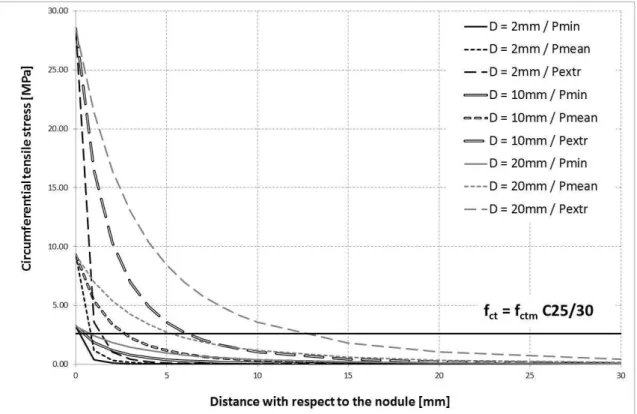
On Fig. 9 providing tensile stresses, horizontal straight line corresponds to the mean tensile 395
strength of ordinary C25/30 concrete. 396
397
Fig. 9. Evolution of compressive stresses vs contact pressure and nodule diameter 398
Fig. 10. Evolution of tensile stresses vs contact pressure and nodule diameter 399
The figure related to compressive stresses (Fig. 9) shows that, around a nodule which is 400
assumed to be perfectly smooth and spherical, the stress level is equal to the pressure. For 401
extreme conditions, this level is likely to exceed the level of resistance of ordinary concrete. 402
However, for average conditions, this level remains acceptable. The curves also clearly show 403
that the stress level rapidly decreases with the distance from the nodule. Consequently, at a 404
distance equal to two times the diameter, the stress level is only about 1% of the pressure and 405
goes down to less than 0.1% at a distance corresponding to 5 times the diameter. It can 406
therefore be concluded that: 407
• Local crushing of the concrete near the nodule is normally not to be feared; 408
• The area of influence of a nodule is of the order of 2 to 3 times the diameter (measured 409
from the centre of the nodule). Assuming that the minimum distances between nodules 410
are in the order of 100 mm, the areas potentially impacted by the presence of nodules 411
are unlikely to interfere. 412
413
Fig. 10 shows that, except for the minimum conditions, there exists a region around the 414
nodule where tensile forces are potentially present and thus likely to initiate micro-cracking. 415
No significant cracking has however been observed in tests performed in the laboratory for 416
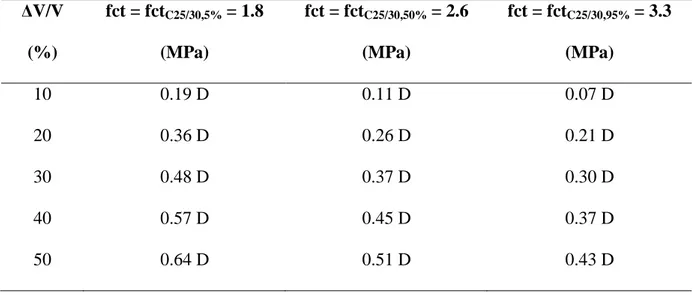
lime hydration in heavy concrete blocks (chapter 4). Table 4 gives the thickness of the 417
potentially cracked area corresponding to a module of lime E = 150 MPa for different values 418
of the volume change and of the tensile strength of the concrete (corresponding to percentiles 419
of 5, 50 and 95, respectively, for standard concrete C25/30). 420
421
Table 4 422
Thickness of the potentially cracked zone around nodule of D diameter vs tensile strength 423 ∆V/V (%) fct = fctC25/30,5% = 1.8 (MPa) fct = fctC25/30,50% = 2.6 (MPa) fct = fctC25/30,95% = 3.3 (MPa) 10 0.19 D 0.11 D 0.07 D 20 0.36 D 0.26 D 0.21 D 30 0.48 D 0.37 D 0.30 D 40 0.57 D 0.45 D 0.37 D 50 0.64 D 0.51 D 0.43 D 424
One must be reminded that the values of radial swelling measured in the laboratory (chapter 425
4) are of the order of 7 % (so corresponding to a volume variation ∆V/V about 15 %). 426
However, in the worst case (∆V/V = 50 %) and for a very low concrete tensile strength (1.8 427
MPa), the thickness of the cracked area is potentially of the order of 64% of the diameter. 428
Under these conditions, if these cracked zones are fully assimilated to non-resistant inclusions 429
with a diameter equivalent to 2.28 times the diameter of the nodule (i.e. 1D + 2 x 0,64D), the 430
calculation of the effect of voids on the compressive strength of concrete according to section 431
1 of the present paper shows that, even in the case of cracking around all the nodules included 432
in the concrete (for a reasonable concentration of such lime nodules), the overall strength of 433
the concrete would hardly be affected. 434
435
4.2.3. Pop-out risk estimation
436
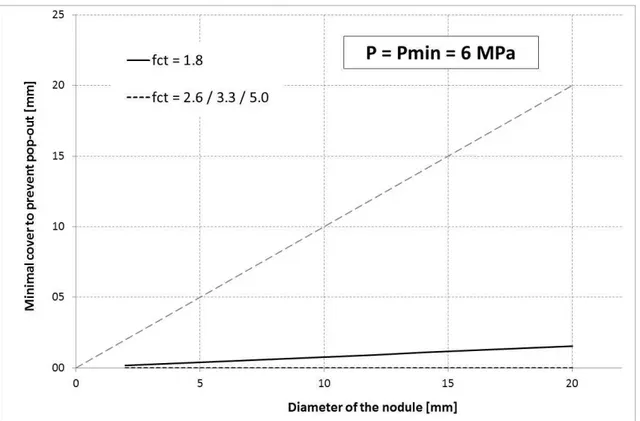
Figures 11, 12 and 13 represent the results obtained by using the equation 9 to estimate 437
the risk of pop-out. These figures actually represent the minimum thickness of the concrete 438
cover beyond which the theoretical model predicts no occurrence of pop-out. This thickness is 439
plotted as a function of the diameter of the inclusion for different values of the tensile strength 440
of concrete and of the swelling pressure of the nodule. The ejection angle is chosen equal to 441
30° in accordance with common observations made on site. For facilitating the reading of the 442
charts, a light grey dash line outlines the situation where concrete thickness equals the 443
diameter of the nodule. 444
The following observations can be drawn from the analysis of these figures: 445
• For the minimal assumptions (low elastic modulus of the lime and low inflation rate - 446
Fig. 11), the risk of pop-out is almost negligible. The model predicts occurrence of 447
pop-out only for very low quality of concrete (fct equal to 1.8 MPa). For higher values 448
of fct, the estimated risk of pop-out is zero whatever the cover thickness, as shown on 449
Fig. 11 by perfectly horizontal superimposed lines corresponding to fct equal to 2.6, 450
3.3 and 5.0 MPa. Even in the worst case, a cover thickness less than 10% of the 451
diameter appears sufficient to prevent pop-out; 452
• For the most realistic though conservative assumptions (intermediate modulus of the 453
lime and swelling ratio of 20% in volume - Fig. 12), the risk of pop-out is more 454
important. For a tensile strength corresponding to ordinary concrete (2.6 MPa), the 455
risk of pop-out occurs if the thickness of the covering is of the order of half of the 456
diameter (50 %) of the inclusion. This is to be compared with hydration tests on heavy 457
concrete blocks (inclusions approximately 20 mm diameter) for which pop-outs have 458
been observed only for cover thicknesses of 10 and 5mm (i.e. 50 and 25% of the 459
diameter). Modelling and observations seem to provide convergent results, confirming 460
thus the assumptions made on the different parameters entering in the modelling 461
process; 462
• For extreme cases (Fig. 13), the model predicts ejection of pop-outs for thicknesses of 463
less than 1 to 2 times the diameter, according to tensile strength of the concrete. 464
465
Fig. 11. Evolution of the minimal thickness of concrete cover vs nodule diameter (minimum pressure).
Fig. 12. Evolution of the minimal thickness of concrete cover vs nodule diameter (mean pressure).
466
pressure)
4.3. Confined free lime hydration results
467
4.3.1. Results of the tests
468
Eighteen trials were conducted, including 16 in the form of maximum confinement 469
(tests 1 to 16) and two under restricted confinement (tests 17 and 18), leaving more place for 470
the hydrate to crystallize: the confinement is in fact restricted if the carrot of lime is of a size 471
smaller than the hole in the concrete. In this case, the metal plate is not completely in contact 472
with the concrete surface and allows some expansion of the lime. Several distances D from 473
the edge of the concrete substrate were tested: 4.5 to 0.25 times the initial diameter d of the 474
core of lime, respectively D/d in Table 6). 475
After testing conditions 8, 9, 13 and 17, respectively, loss of ignition at 600°C was 476
measured in order to evaluate the rate of hydration of the lime (Table 5). 477
478
Table 5 479
Hydrated lime content of the samples. 480
Test Loss of ignition at 600°C [%] Ca(OH)2 content [%] 8 24.2 99.6 9 23.9 98.1 12 23.6 96.9 17 23.7 97.4 481
A minimum value of 97 % of Ca(OH)2 is measured. If we consider that initial lime is not
482
totally pure – it means less than 100% CaO due to unburn limestone - , we may conclude that 483
all the free lime has been hydrated. 484
485
4.3.2. Internal cracking of the concrete blocks and pop-outs
486
No cracking has been observed for all the concrete blocks tested (Fig. 14 a to e). Even 487
for free lime nodules very close to the concrete surface (0.5 times free lime nodule diameter), 488
no cracking appeared inside the block. 489
490
(a)Free lime nodule at 10 mm depth (b)Free lime nodule at 20 mm depth
(e) Free lime nodule at 5 mm depth : pop out but no internal crack
Fig. 14. Sections of concrete blocks and free lime nodules. 491
Pop-outs were observed only for specimens (Fig. 15a and b) corresponding to depths: 492
• 0.25 times free lime nodule diameter (2 by 3 of the specimens) and 493
• 0.5 times free lime nodule diameter (1 by 3 of the specimens). 494
When depth was higher than 1 times the free lime nodule diameter, no pop-out was observed. 495
(a) (b)
Fig. 15. Free lime nodule at 5 mm depth (a) and 10 mm depth (b). 496
4.3.3. Analysis of densification phenomenon and nodule expansion
As described in §3.2, the blocks are cut with a diamond saw (dry) at the right and the 498
edge of the nodule and hydrated lime cores are then recovered, measured and weighed. As a 499
reminder, in unconfined conditions, when quicklime CaO (bulk density about 1.5 g/cm3) is 500
transformed into Ca(OH)2 hydrate, it is in the shape of a powder of low density (about 0.5
501
g/cm3). The measurements show (Table 6), in confined situation, a densification process of 502
the hydrate which offers a density much higher than in unconfined case. During these tests, 503
the hydrates obtained in confined environment showed a density varying from 1.4 to 1.7 504
g/cm3, with average value of 1.55 g/cm3 (Table 6). 505
506
Table 6 507
Measurements of confined lime cylinders in concrete blocks (D is the distance between the 508
nodule and the surface and d is the diameter of the nodule) 509
Test Initial lime Observations Characteristics of hydrate
Density (g/cm³) D/d Pop-out (Y/N) Cracking (Y/N) Density (g/cm³) Volume expansion (%) Radial expansion (%) Longitudinal expansion (%) Maximal confinement 1 1.38 4.5 N N 1.39 32 10 8 2 1.58 4.5 N N 1.71 22 5 11 3 1.44 4.5 N N 1.62 18 7 4 4 1.44 4.5 N N 1.67 14 3 6 5 1.38 4.5 N N 1.47 24 6 11 6 1.49 4.5 N N 1.54 28 8 9 7 1.47 2 N N 1.66 17 8 1 8 1.39 2 N N 1.50 23 6 8 9 1.43 1 N N 1.49 27 8 8 10 1.40 1 N N 1.55 20 8 3 11 1.41 1 N N 1.52 23 6 9
12 1.46 0.5 Y N unrecovered 13 1.50 0.5 N N 1.50 32 12 5 14 1.39 0.5 N N 1.46 25 7 10 15 1.45 0.25 Y N unrecovered 16 1.51 0.25 Y N unrecovered Restricted confinement 17 1.41 2 N N 1.14 64 24 76 18 1.50 0.25 N N 1.31 51 27 73 510
This densification process logically implies a volume expansion factor much lower than what 511
is generally known when unconfined (300% as calculated from the ratio of 1.5 g/cm3 for lime 512
divided by 0.5 g/cm3 for Ca(OH)2 hydrated lime). Expansion factors measured here are in the
513
range from 15 to 30% (23% average). Figure 16 shows the experimental values in the case of 514
a high confined situation (tests 1 to 16, rhomb dots) and in the case of a partial confinement 515
(tests 17 and 18, square dots). 516
Fig. 16. Evolution of the density of hydrated lime vs volume expansion (confined (tests 1 to 16) and less confined (tests 17 and 18))
517
The positive expansion that is observed in the case of confined samples (rhumb dots) 518
means that these confinements are not perfect, leaving a free space for expansion. This 519
imprecision is statistically distributed across different samples. These expansions are not 520
related to a deformation of the concrete block. It is possible to estimate the density of the core 521
hydrate in the case of perfect confinement by extrapolating the regression line. This 522
extrapolation (82% correlation) allows to calculate that, in the case of perfect confinement (no 523
volume expansion), the hydrate, formed from lime industrial bulk with a density of 1.5 g/cm3, 524
will have an equivalent density of 1.84 g/cm3: this remains less than the absolute density of 525
the hydrate (2.2 g/cm3). 526
The tests allow concluding that hydration of quicklime in a confined environment, 527
leads to the production of completely hydrated portlandite nodules with very high densities. 528
529
4.3.4. Rigidity modulus
530
Some values from 100 to 200MPa are given in the literature [19]. Due to the intrinsic 531
variability of the free lime, tests have been performed on cylinder used for testing 532
confinement effect. Samples are prepared exactly in the same conditions than in §3.2: after 67 533
hours hydration, cylinders are cored from concrete blocks (Ø20mm and H15-20mm). Until 534
testing, specimens are stored into plastic bags in order to avoid carbonation process. 535
Compressive loading is applied at a speed of 5N/s on INSTRON 5585 tensile machine (Table 536
7). 537
Table 7 538
Rigidity modulus and compressive strength of hydrated lime cylinders (MPa). 539 Specimen reference Compressive strength [MPa] Rigidity modulus [MPa] 13 centered* 5.1 150 14 centered** 5.1 164 17 centered 5.4 189 2C20 8.3 168 4C10 3.8 129 5C40 5.3 180 10C10 5.4 144
* small crack at mid-height 540
** non parallel faces 541
542
These indicative measurements confirm literature results and have been used as reference 543
values for modelling (chapter 3). 544
545
4.3.5. Hydrated lime analysis
546
X Ray Diffraction analyses have been carried out in order to determine the mineralogy of 547
the crystals and the nature of the hydrated products. Several samples have been recorded: 548
• NC1 : not confined sample (100% free volume Vf)
549
• C110 : Ø10 mm sample confined into concrete hole of ± 20 mm diameter (± 75% Vf)
550
• C115: Ø15 mm sample confined into concrete hole of ± 20 mm diameter (± 44% Vf)
551
• C120: Ø20 mm sample confined into concrete hole of ± 20 mm diameter (± 0% Vf)
552
On diffractograms (Fig. 17), it appears that all the samples are of Portlandite type Ca(OH)2.
553
Calcite can be present in very few quantities, due to carbonation. 554
Fig. 17. XRD analysis on NC1 sample. 555
4.3.6. ESEM observations
556
The EDAX analysis confirmed the XRD analysis with bands, next to oxygen and 557
platinum bands, characterized by the presence of Ca. 558
559
NC1 sample
560
The unconfined sample is in the form of powder, hard to stick on the pad and difficult 561
to be metallized. The porosity (Fig. 18 (a)) is very high. The grains are generally anhedral, 562
rarely euhedral. They have a size of ± 1 to 5 microns (Fig. 18 (b)). 563
NC1
04-0733 (I) - Portlandite, syn - Ca(OH)2 - Y: 86.46 % - d x by: 1. - WL: 1.5406 - 0 - I/Ic PDF 1.4 - Operations: Background 0.000,0.000 | Smooth 0.150 | Import
NC1 - File: NC1.raw - Type: 2Th/Th locked - Start: 2.000 ° - End: 45.000 ° - Step: 0.020 ° - Step time: 0.6 s - Temp.: 25 °C (Room) - Time Started: 8 s - 2-Theta: 2.000 ° - Theta: 1.000 ° - Chi: 0.00 ° - Phi: 0.00 ° - X: 0.0
Lin (Counts) 0 10 20 30 40 50 60 70 80 90 100 110 120 130 140 150 160 170 180 190 200 210 220 2-Theta - Scale 2 10 20 30 40 d=26.83630d=23.80000d=16.23526 d=4.89551 d=3.10515 d=2.62351 Portlandite Portlandite Portlandite
(a) (b) Fig. 18. ESEM observations on NC1 sample.
564
C110 sample
565
The sample shows expansion cracks (Fig. 19 (a)). As in the periphery than in the 566
center of the sample, small euhedral crystals are observed; they attest that there was free space 567
for them for growing and adopting their own crystalline form. The crystals are associated with 568
very small needles blooms (Fig. 19 (b)). The size of portlandite crystals ranges from ± 0.1 to 5 569
microns. 570
(a) (b)
Fig. 19. ESEM observations on C110 sample.
C115 sample
Like for sample C110, the edge of the core is characterized by the presence of 572
expansion cracks. As in the periphery than in the center, small euhedral crystals are visible 573
(Fig. 20 (a)), which attest about the free space that has existed around them for developing 574
and adopting their crystalline shape. The size of portlandite crystals ranges from ± 2 to 5 575
microns (Fig. 20 (b)). 576
(a) (b)
Fig. 20. ESEM observations on C115 sample. 577
C120 sample
578
The puck taken from the sample is very dense. It is cut in the core using an instrument 579
that has left its mark: the wall of the core is regular and detached without tearing (Fig. 21 - 580
sample C120). Anhedral grains are joined and the porosity is low (Fig. 21 (a)). The grain size 581
is about 1 micron (Fig. 21 (b)). 582
(a) (b) Fig. 21. ESEM observations on C120 sample.
583
4.8. Comparisons and analysis of observations
584
At a low magnification (Fig. 22), two samples show common features (the expansion 585
cracks): C110 (Fig.19 (a) and C115 (Fig.22 (b)). The unconfined NC1 sample (Fig.22 (a)) is 586
in powder form while C120 appears to be more massive (Fig.22 (c)). 587
(c) C120
Fig. 22. Comparison of the samples under ESEM (low magnification). 588
At a higher magnification (1000x to 3000x), even if NC1 (Fig.18 (b)), C110 (Fig.19 589
(b)), C115 (Fig.20 (b)) samples are similar in grain size, this is not the case with regard to 590
their crystallinity: only C110 and C115 are characterized by the presence of euhedral crystals 591
(Fig. 23). Grain size is finer for sample type C120. 592
(c) C115 (d) C120 Fig. 23. Comparison of the samples under ESEM (high magnification). 593
The scanning electron microscopy allowed observing the structures of lime processed under 594
various conditions of confinement, both on site and in the laboratory. The comparison of 595
samples generated in the laboratory shows the difference between unconfined and confined, 596
and, for confined samples, the evolution of structures versus rates of expansion. Structure and 597
porosity may be compared with the densities of cylinders (Table 6). 598
599
5. Conclusions 600
601
A simple model based on the theory of elasticity, on duly validated experimental data 602
and on reasonable engineering judgement has been derived to estimate the consequences of 603
the presence of hydrated lime nodules from quicklime on the mechanical characteristics of 604
structural concrete and on the risk of occurrence of pop-outs likely to influence concrete 605
durability. By exploiting this simple model, the following conclusions can be drawn: 606
• for the range of parameters that have been selected, the pressure developed at the 607
interface between the concrete and the hydrated nodule varies from 6 to 60 MPa. The 608
most probable value is of the order of 20 MPa; 609
• the area of influence of a nodule is of the order of 2 to 3 times its diameter; 610
• no local crushing of concrete in the vicinity of a nodule is to be considered. If such a 611
crushing would anyway occur, it would only affect a very limited zone around the 612
nodule with no impact on the overall mechanical properties of the concrete; 613
• a micro-cracked zone is likely to develop around the nodule under the conjunction of 614
unfavourable conditions. The diameter of this cracked region could be at most of the 615
order of 230 % of the diameter of the nodule and its impact on the strength of the 616
concrete at the macroscopic level is proven as negligible; 617
• for the most probable values of the swelling pressure, the minimum concrete cover 618
thickness allowing the prevention of the pop-out phenomenon is of the order of half 619
the diameter of the inclusion. In other words, under the assumptions considered in this 620
study, no nodule located at a depth of more than half its diameter should cause pop-out 621
even when hydrated; 622
The following conclusions can be drawn from the experimental program: 623
• hydration of quicklime in a confined environment, leads to the production of 624
completely hydrated portlandite nodules; 625
• hydrate formed in a confined environment occupies the available volume and, in 626
present cases, may reach very high densities (average value = 1.55 g/cm³); 627
• the rate of volume expansion of the quicklime, depending of the free volume, is very 628
low (average 23% expansion) compared to an unconfined and is the result of a non-629
full confinement; 630
• in the case of a fully enclosed environment (case of lime nodules trapped in a concrete 631
structure), the density of the hydrate may reach up to 1.84 g/cm3, which is still under 632
2.24 g/cm3 (absolute and therefore maximum density); 633
• pop-out appear in the test conditions for depths less than or equal to 0.5 times the 634
initial diameter of the nodule of lime; 635
• no internal cracking is observed in the concrete blocks; 636
• when confinement is maximal, anhedral grains are joined and the porosity is low; 637
however, when space around nodules was available, porosity is large and grains shape 638
is euhedral. 639
Finally, laboratory tests clearly show that the depth of confinement is the most important 640
factor for explaining pop-out and free lime expansion. Moreover, just the near-to-surface 641
layer is affected by the risk of pop-out: when the nodule is under the concrete surface, 642
surrounding concrete is sufficiently resistant to confine nodule and avoid explosion. 643
Under the worst case scenarios in combined terms of swelling pressure and concrete 644
strength, the minimum thickness necessary to prevent the pop-out phenomenon is of the order 645
of two times the diameter of the inclusion. In other words, even under these extremely 646
unfavourable assumptions, no nodule located a depth of more than 2 times its diameter should 647 cause pop-outs. 648 649 References 650
[1] C. Plinius Secundus (maior), Natural history, translation from Latin by E. Littré (2nd 651
Tome), Paris, 1850. 652
[2] Ph. Dumont, Use of lime in construction, CERES 99/1 (University of Liège, Belgium), 653
1999 (in French). 654
[3] J.A.H. Oates, Lime and limestone. Chemistry and technology. Production and uses, 655
Wiley-VCH verlag GmbH, Weiheim, 1998. 656
[4] R.S. Boynton, Chemistry and Technology of Lime and Limestone, 2nd Edition, New 657
York : Wiley & Sons, 578 pages. 658
[5] S. Chatterji, Mechanism of expansion of concrete due to the presence of dead burnt 659
CaO and MgO, Cem. Concr. Res. 25(1) (1995) 51-56. 660
[6] M.H. Lee, J.C. Lee, Study on the cause of pop-out defects on the concrete wall and 661
repair method, Constr. Buildg. Mat. 23(1) (2009) 482-90. 662
[7] G.M. Idorn, Expansive mechanisms in concrete, Cem. Concr. Res. 22 (1992) 1039-663
1046. 664
[8] A. Verhasselt, Industrial by-products for the design of bonded layers in foundations: 665
blast furnace slags, iron slags and fly ashes, Belgian Road Research Center Publication, 666
CR 33/91 (1991) (in French). 667
[9] F. Choquet, Laboratory study for the valorization of iron slags and blast furnace slags in 668
road engineering, Belgian Road Research Center Publication, CR 22/84 (1984) (in 669
French).
670
[10] M. Deng, D. Hong, X. Lan, M. Tang, Mechanism of expansion in hardened cement 671
pastes with hard-burnt free lime, Cem. Conc. Res. 25 (2) (1995) 440-448. 672
[11] L. Mun-Hwan, L. Jong-Chan, Study on the cause of pop-out defects on concrete wall 673
and repair method, Constr. Bldg. Mat. 23(1) (2009) 482-490. 674
[12] B. Chiaia, A. Fantilli, G. Ferro and G.Ventura, Modeling the CaO hydration in 675
expansive concrete, Computational Modelling of Concrete Structures (Bicanic et al. 676
eds), CRC Press (2010) 441–449. 677
[13] H. Shi, L. Yuan, Theoretical and experimental research on expansive stress in hardened 678
cement paste, Advances in Concrete Research 4 (2004) 155-160. 679
[14] C.F. Dunant, K.L. Scrivener, Effects of uniaxial stress on alkali–silica reaction induced 680
expansion of concrete, Cement and Concrete Research 42 (2012) 567–576. 681
[15] Faury J., Concrete : influence of inert components – Requirements for a better design, 682
Dunod Ed., Paris (1942) (in French). 683
[16] Dreux G., New guide for concrete, 7th edition, Eyrolles Ed., Paris (1995) (in French). 684
[17] R. D. Hooton, A. M. Ramezanianpur, R. M. Ahani, U. Schutz, Durability of Portland 685
Limestone Cement Concrete, International congress on Durability of Concrete. ICDC 686
2012, Trondheim, Norway (10p.). 687
[18] B. Chiaia, A. Fantilli, G. Ventura, A chemo-mechanical model of lime hydration in 688
concrete structures, Constr. Bldg. Mat. 23 (2012) 308-315. 689
[19] S. Timoshenko and J. N. Goodier, Theory of Elasticity, 2nd Edition, McGraw-Hill Book 690
Company, 1951. 691
[20] K. Van Baelen, Carbonation of lime mortars and its effect on historical structures, PhD 692
thesis, Catholic University of Leuven (KULeuven), 1991 (in Dutch). 693
![Fig. 2. Concrete cover versus diameter of the slag for different concrete types (from [11]) 67](https://thumb-eu.123doks.com/thumbv2/123doknet/6876288.192803/4.892.172.719.309.642/fig-concrete-cover-versus-diameter-different-concrete-types.webp)