DIGITAL INVESTIGATIONS OF AN ARCHAEOLOGICAL SMART POINT CLOUD: A
REAL TIME WEB-BASED PLATFORM TO MANAGE THE VISUALISATION OF
SEMANTICAL QUERIES
F. Poux a, † ,*, R. Neuville a, † ,*, P. Hallot b, L. Van Wersch c, A. Luczfalvy Jancsó d, R. Billen a
a ULG, Department of Geography, Geomatics Unit, University of Liège, 4000 Liège, Belgium- (fpoux, romain.neuville, rbillen)@ulg.ac.be
b ULG, Architecture Faculty, Study and Representation of Space and Form, University of Liège, 4000 Liège, Belgium – p.hallot@ulg.ac.be
c ULG, Institut of civilisations, arts and letters, University of Louvain, 1348 Louvain-la-Neuve, Belgium- line.vanwersch@uclouvain.be
d ULG, European Archaeometry Centre (CEA), University of Liège, 4000 Liège, Belgium- andrea.luczfalvyjancso@doct.ulg.ac.be
† These authors contributed equally to this work
KEY WORDS: 3D Viewpoint management, Point Cloud, Semantic, WebGL, Segmentation, Classification, Feature extraction,
Cultural Heritage, Conservation
ABSTRACT:
While virtual copies of the real world tend to be created faster than ever through point clouds and derivatives, their working proficiency by all professionals’ demands adapted tools to facilitate knowledge dissemination. Digital investigations are changing the way cultural heritage researchers, archaeologists, and curators work and collaborate to progressively aggregate expertise through one common platform. In this paper, we present a web application in a WebGL framework accessible on any HTML5-compatible browser. It allows real time point cloud exploration of the mosaics in the Oratory of Germigny-des-Prés, and emphasises the ease of use as well as performances. Our reasoning engine is constructed over a semantically rich point cloud data structure, where metadata has been injected a priori. We developed a tool that directly allows semantic extraction and visualisation of pertinent information for the end users. It leads to efficient communication between actors by proposing optimal 3D viewpoints as a basis on which interactions can grow.
1. INTRODUCTION
The importance of cross-disciplinary understanding is essential to archaeological information extraction based on point clouds. However concepts and tools that simplify this process are rare, which complicates the merging of different experts’ perceptions around cultural heritage applications. Being able to share and exchange contextual knowledge to create a synergy among different actors is needed for planning and analysis of conservation projects. In this context, 3D digital exploration and investigations are a proven way to extract knowledge from field observations (Pieraccini et al., 2001; Remondino and Rizzi, 2010).
It relays through 3D content, often derived from 3D modelling techniques that shape surveyed or available data. Yet, 3D models such as meshes and parametric models interpolated from point clouds can generate interpretation blunders when made by non-experts. This process often leads to a blurry understanding of underlying information unlike the direct use of point clouds which permits an easier transition from data acquisition to information extraction. It also provides an insight on the core surveyed data, its precision and implicitly its usability. However, * Main and Corresponding authors, contributed equally.
their massiveness, heterogeneity, weak semantics, varying resolution and unusual visualisation makes their understanding and manipulation a difficult process.
Our paper is an attempt to bring communities together by providing new ways to collaborate through a web-based platform that intelligently manages the 3D visualisation of queries over a semantically rich point cloud. Decision making processes relays through efficient data visualisation techniques, to grasp pertinent information that constitute a reasoning groundwork. In this article, we study a highly detailed point cloud replica of ancient mosaics from the IXth century located in the Chapel of Germigny-des-Prés (Loiret, France). Researches are conducted to expand mosaic manufacturing understanding. Essentially of heterogeneous materials, sizes and periods the study of each tessera by analysing spatially-derived properties such as repartition, position, neighbourhood, number and density is of great importance for the archaeologist team. As such, a first step consist in recognition and data classification. This process is derived from the Smart Point Cloud model (Poux et al., 2016a), by integrating domain knowledge gathered from studies and analyses of artworks directly onto the data to allow.
The International Archives of the Photogrammetry, Remote Sensing and Spatial Information Sciences, Volume XLII-5/W1, 2017 GEOMATICS & RESTORATION – Conservation of Cultural Heritage in the Digital Era, 22–24 May 2017, Florence, Italy
Because the dome is composed of about one hundred thousand tesserae, immediately identifying semantic query results via data visualisation techniques is a gateway to transparently communicate relevant information. To achieve it, we use the method developed by (Neuville et al., 2016) based on the analysis of the computational display pixels. It determines an optimal viewpoint by maximising the visibility of objects selected by semantic queries.
In a first part, we will present our approach for object recognition and semantization within a hybrid point cloud. Then we will describe the framework to calculate a 3D viewpoint that exploits efficiently metadata. Finally, we will present our developed cross-platform software to visualise semantical queries and constitute an intelligent environment.
2. RESTORER’S DRIVEN INTEREST
By studying cultural heritage artwork, experts can use new processes to conduct specific investigations directly on a digital replica. The disposal of a virtual clone which depict necessary information leads to new insights and extracted information. These 3D datasets provide general knowledge through clever archiving and can constitute training datasets for machine learning (Goldberg and Holland, 1988) frameworks. In archaeology, researchers also use 3D digital models to annotate, measure, visualize, and compare the knowledge gathered from studies and analyses of other available artwork.
2.1 Archaeological study: the Carolingian oratory
The Carolingian oratory in Germigny-des-prés (Loiret, France) hosts ancient mosaics dated from the 9th century, composed of approximatively one hundred thousand tesserae. The quality of the preserved artworks are an exclusive occasion for the study of mosaics and also of the glass. Indeed, the arranged tesserae creating this mosaic are predominantly made in glass - a rare material in an archaeological context - and whose provenance in the early Middle Age is still a mystery (Van Wersch et al., in press). A specific study regarding each tessera independently and by analysing different properties, repartitions or advanced extracted information are important information sources for archaeological research.
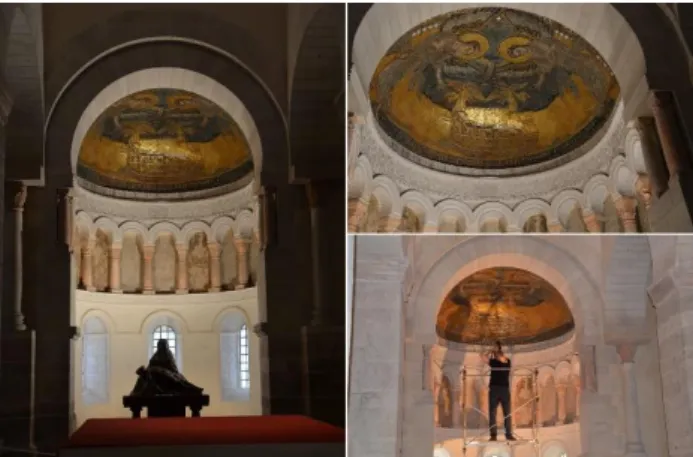
Figure 1 The mosaic of Germigny-des-prés © Line Van Wersch Composed of tesserae from different materials, sizes and periods, it is a well preserved and restored mosaic that culminates at 5.402m above the ground, presenting many challenges for 3D capture from both active and passive sensors. The dome is
protected and the limited accessibility allows only a light scaffolding, too tight and unstable to establish a steady tribrach.
2.2 The 3D digital copy: a multi-sensory point cloud
Point clouds are a direct source of information physically describing a 3D state of the recorded environment. As such, they are an exhaustive representation of the real world at every scale: a “goldmine” underexploited. Due to the considerable progress of surveying and reality capture technologies, getting hold of point clouds continues to become easier, faster and incurring lower costs. While laser scanning is largely used for precise applications, image-based reconstructions prove useful in cases ranging from archaeological to full towns and complex architectural reconstruction (Remondino et al., 2014), making this technique a favourable way to get quick and visually pleasant point clouds. Fusing data from both active and passive sensors provides additional information that relays through higher representative feature for contextual structuration and visualisation. (Poux et al., 2016b) showed the benefits of combining different features from these sensors while addressing specific challenges being registration, resolution adaptation, and attribute fusion to obtain a multiscale representation from urban scale to building scale. Building on this concept we applied the workflow to obtain a highly representative multi-feature point cloud combining datasets with varying resolution from terrestrial laser scanner and dense image matching reconstructions. The dome, object of interest, has a height comprised between 115.276 m and 116.360 m for the highest tessera (altitude NGF). We acquired the data using a phase-based calibrated terrestrial laser scanner: the Leica P30 from one optimized position by using an extended mounted tribrach (Figure 2).
Figure 2 Top View and Side view of TLS data, with the optical TLS centre’s position (red cross)
The terrestrial laser scanner was operated at 1550 nm for a maximum pulse energy of 135 nJ. The final accuracy of a single point at 78% albedo is 3 mm, where the final point cloud is composed of 30 336 547 points with intensity ranging from 0.0023 to 0.9916 covering solely the mosaic ((b) in Erreur !
Source du renvoi introuvable.). Several pictures were taken at
different positions in order to obtain a 3D point cloud of the mosaic. These pictures were shot using a Canon EOS 5D mark III camera equipped with a 24-105 mm lens. 286 pictures of 5760 x 3840 in RAW, radiometrically equalized and normalized were used to reconstruct the point cloud. Different softwares benchmarked in (Nikolov and Madsen, 2016) were tested and the final image-based point cloud reconstruction was made using ContextCapture (Novel et al., 2015). The final point cloud mosaic covering 9.38 m² is composed of 275 257 253 points which
The International Archives of the Photogrammetry, Remote Sensing and Spatial Information Sciences, Volume XLII-5/W1, 2017 GEOMATICS & RESTORATION – Conservation of Cultural Heritage in the Digital Era, 22–24 May 2017, Florence, Italy
represent a density of 29 pts/mm² ((d) in Erreur ! Source du
renvoi introuvable.).
Figure 3 Point Cloud of the mosaic – bottom-up view Finally, the different signatures are fused as in (Poux et al., 2016b) to obtain a spatial entity on which semantic information can be extracted.
3. POINT CLOUD SEMANTICS
Bringing intelligence to point clouds and creating a connection between available knowledge and classification procedures is a key step that permits semantic injection for information extraction. Building on the concept of Smart Point Cloud in (Poux et al., 2016a), we illustrate the global workflow for precise storage of information where point clouds are precisely classified with unique identifiers, allowing a greater precision with the metadata as it relates to the acquired geometry. Bridging effective data acquisition and fast rendering through efficient processing demands an adapted model to handle data heterogeneity, knowledge integration and indexing scheme.
3.1 Point Cloud model
“Intelligent environment” (Novak, 1997) as an interactive and smart structure to transparently communicate relevant information to users is an attractive solution for virtual reconstructions, especially point clouds. Identifying links and relations within segmented objects becomes essential to truly understand how each spatial entity relates to its surroundings. To perform spatial queries, indexing scheme such as octree derived indexing techniques can provide an efficient solution for out-of-core rendering and parallel processing, but inference reasoning stays limited. If within the point cloud and its attributes, all the necessary information can be found and easily conveyed without the need for time consuming and redundant tasks, it would become a more intelligent structure for processes. We define a classification, organisation, structuration and visualisation process through a flexible and highly contextual structure based on the Smart Point Cloud workflow, that can adapt to different domain and device expertise created by:
1. Integration of the multisensory data;
2. patch-oriented indexation including filtering and initial normalization;
3. Smart recognition described in 3.2 including segmentation, classification, validation and refinement;
4. Object-LoD Smart structuring & Octree indexing. This workflow is particularly suited to handle semantic injection and point cloud structuration for a tesserae-wise 3D digital replica, and is adapted to the use case of Germigny-des-Prés (Figure 5). After the operational block (which is not covered in this article) around the captured subject (where context and properties of the scene define the chosen methodology), the point cloud goes through a full process to extract semantic components from normalized signals as in Figure 4.
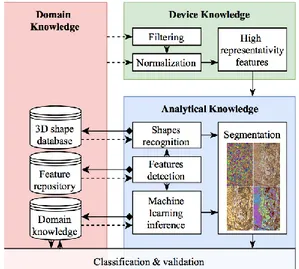
Figure 4 Segmentation and Classification of point cloud within a Smart Point Cloud (Poux et al., 2016a) context The device expertise block conditions which attribute to filter, normalize and a weighted adjustment process through data fusion as in (Poux et al., 2016b) is carried on. The data indexing scheme needs to retain critical information while previsioning structuration searches (attribute-key, NN, semantics). For this use case PostgresQL was used as a RDBMS and GIST as the main internal indexing scheme. Nested Octrees are used for rendering in order to accommodate the point density and repartition. However, class attributes and features are stored in a different structure while retaining a direct link to the correct point/patch index, as discuss in (Weinmann, 2016).
The domain block stores information in the same PostgresQL, directly exchanging information with the analytical block, executed through python scripting and C++ processing onto the database point data. The architecture of the domain knowledge lies on the same database server database keeping two different entities: the training data and the expert knowledge intelligence. Each of these modules participates into the classification and organization to obtain labelled data. The analytical results are evaluated regarding completeness, and either validated or refined if rejected. When validated, the results are passed onto a WebGL GUI described in 4.
The International Archives of the Photogrammetry, Remote Sensing and Spatial Information Sciences, Volume XLII-5/W1, 2017 GEOMATICS & RESTORATION – Conservation of Cultural Heritage in the Digital Era, 22–24 May 2017, Florence, Italy
Figure 5 Adaptation of the Smart Point Cloud workflow (Poux et al., 2016a) to Germigny-des-Prés tesserae semantic injection
This whole pipeline describes an intelligent archeological environment creation, from data acquisition to collaboration and interaction where the end-user has access to relevant information deprecated in the structure through a knowledge update. The segmentation and classification steps heavily condition the results as well as the validating process, relating to the problems of data mining (Xindong Wu et al., 2014) for point cloud processing.
3.2 Mosaic point cloud classification and integration
Segmentation and features extraction are well studied areas within point cloud processes. However, the integration of knowledge is still rare, with few example of hybrid pipelines (Ben Hmida et al., 2012; Pu and Vosselman, 2009). The used approach constitute a hybrid method inspired by previous work in shape recognition (Chaperon and Goulette, 2001; Lin et al., 2013; Ochmann et al., 2016; Schnabel et al., 2007), region growing pipelines (Dimitrov and Golparvar-Fard, 2015; Nurunnabi et al., 2012; Rusu and Blodow, 2009) and abstraction-based segmentation (Aijazi et al., 2013; Douillard and Underwood, 2011; Montaut, 2006; Girardeau-Montaut et al., 2005; Samet and Tamminen, 1988) relying on 3D connected component labelling and voxel-based segmentation.
Indeed, unstructured point cloud can benefit of structural properties that can be used as part of a segmentation process. Our approach illustrated in Figure 6 is based on available features and directly includes knowledge and semantic sources at both the segmentation stage, the classification step and the semantic injection. First, the point cloud is segmented regarding colour information by referring to the database table containing float RGB colour ranges for each material composing the mosaic. Then the gap is enhanced by superimposing intensity values over colour information. The segmentation is refined and reveals better point filtering. Then a multi-scale abstraction-based (global features extracted from a generalized spatial node such as a voxel, a sub-group or region identified spatially) routine that voxelates the 3D space at different abstraction levels and by constructing an octree structure to speed up computations.
Figure 6 Hybrid segmentation and classification pipeline for an archaeological smart point cloud structuration These steps are extracted from analytical knowledge where density information constrain the initial bounding-box containing the points. An initial low level voxel structure is computed retaining the number of points as attribute. 26-connectivity study groups adjacent voxels if voxels aren’t surrounded by empty voxels. This allows to clean possible noise from difficult colours extraction. Then a multi-scale iterative 3D connected components algorithm at different octree levels starting at a voxel size of 10* 10*10 mm, recursively segments under-segmented groups (detected by injecting analytical knowledge regarding minimum Bounding-box size of processed material) by refining the voxel-based subdivision until the number of generated voxels is inferior to the density-based calculation of estimated voxels number. When subgroups dimensions correspond to material’s available knowledge, segments are added to the independent Tesserae segments. For absorbent materials that imply low intensity and high noise, the 3D distance map is used to detect points that belong to each tesserae. Then, for each detected segment, every point is projected on the RANSAC best fit plane, and a 2D outline algorithm calculate the convex hull of the
The International Archives of the Photogrammetry, Remote Sensing and Spatial Information Sciences, Volume XLII-5/W1, 2017 GEOMATICS & RESTORATION – Conservation of Cultural Heritage in the Digital Era, 22–24 May 2017, Florence, Italy
projected points to constrain the plane. The generated polygon is then studied to establish its complexity regarding the work of (Brinkhoff et al., 1995), and domain knowledge including size, geometry and spatial distribution (Table 1) leads to tesserae classification.
Sample Available knowledge
Surface (in cm²) Approx. Geometry Reflectance (at 1.55 µm) Date Gold ~ 1 cm² ~ square H. Reflective XIX Gold < 1 cm² irregular ~ Mat < Faience ~ 20
cm²
tear, diamond
Reflective XIX Silver ~ 1 cm² ~ square H. Reflective XIX Table 1 Tesserae knowledge and semantic properties Finally, semantic information is transferred to the point cloud that can be used for information extraction (Figure 7).
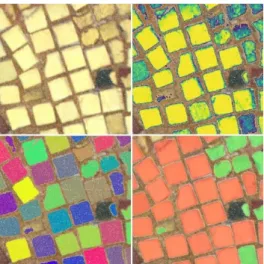
Figure 7 Point cloud from left to right, Colour, colour segmented, abstraction-based segmented, classified Once every point from each sample has been classified, the information is stored on a server-side PostgresQL database, by first grouping each tessera in semantic patches and then grouping each class through relational joints.
Figure 8 Segmentation, Classification and Semantization Therefore, only required information is extracted from this semantically rich point cloud. This include point cloud spatial attributes, minimum convex hull of each tessera, colour attributes, coordinate system, normal, orientation, size, density,
… On an expert’s view, this gives the ability to reason about the data through information extraction and permits to avoid interpretation brought by data denaturisation. We obtain a tesserae-wise structure where each segment is connected to semantical information. Through data visualisation, we can address visual components that elegantly represent the analytical results while proposing an efficient way to interact with the data.
4. REAL TIME 3D VISUALISATION
Through the characterisation of a semantically rich point cloud data structure, performing queries on tesserae is now feasible. However, since the mosaic is composed of around one hundred tesserae, visualising efficiently the result of a query is quite arduous. That is why we provide to users a set of optimal viewpoints in order to directly focus their attention on the common requested tesserae. A processing step, transparent to users, is carried out and presented in this section.
4.1 The 3D viewpoint management of requested tesserae
Based on the algorithm developed by (Neuville et al., 2016) we manage the 3D viewpoint so as to determine an optimal position and orientation of the camera for the visualisation of three kinds of tesserae distinguished by their material: faience, gold and silver (Table 1). Through the previous steps of recognition and semantization described in 3.2, we are now able to exploit the semantically rich point cloud data structure in order to visualise efficiently the different sorts of tesserae. To achieve it, we perform a pre-processing step, totally transparent to users, in which we compute the optimal camera positions on a 3D COLLADA model of the mosaic which is constituted of the minimum convex hull of each tesserae information stored in the database.
The algorithm looks at the pixels of the computational display which enables to avoid the under-object recognition phenomenon. It also allows to directly work on the final rendering of the 3D model which already integrates the use of an algorithm to process hidden faces. Finally, it can be used on any kinds of 3D data structure (vector, raster or point cloud) (Neuville et al., 2016).
We implemented the application in WebGL, a JavaScript API for rendering 3D graphics within any compatible web browser. We used Three.js, a cross-browser JavaScript library which uses the WebGL framework and enhances it. In the first implementation illustrated in (Neuville et al., 2016), a region growing process was used to distinguish the objects. However, to enhance the computation performance by reducing the calculation time, we apply one unique colour per instance for each class (e.g. faience tesserae); all non- requested tesserae are coloured in black. (Figure 9).
The International Archives of the Photogrammetry, Remote Sensing and Spatial Information Sciences, Volume XLII-5/W1, 2017 GEOMATICS & RESTORATION – Conservation of Cultural Heritage in the Digital Era, 22–24 May 2017, Florence, Italy
Figure 9 Unique colourisation of a group of golden tesserae (bottom-up view)
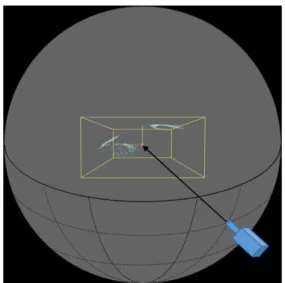
For each class of tesserae (gold, silver and faience), we compute a bounding box and we locate its center (Figure 10). The bounding box center becomes the center of the sphere on which the camera will move in order to determine the optimal camera position (Figure 11). The coordinates of the camera on the sphere are computed according to the following formulae (Neuville et al., 2016):
X = xcenter+ r ∗ cos(ф) ∗ cos(Ѳ); Y = ycenter+ r ∗ sin(ф);
Z = zcenter+ r ∗ cos(ф) ∗ sin(Ѳ); (1) where X, Y, Z = camera coordinates;
xcenter,ycenter, zcenter = coordinates of the center of the sphere;
r = radius of the sphere; ф = vertical angle; Ѳ = horizontal angle.
The assumption regarding the viewpoint direction is controlled by natural viewing; in our case, bottom-up view. The radius of the sphere has been computed in order to see all requested tesserae whether the camera position. With regard to the rotation increment, it has been fixed at 5 degrees which means that more than one thousand images of the mosaic will be analysed for each kind of tesserae. It is worth mentioning that the rotation angle is fixed arbitrary, but further research will extend the use case to determine an optimal rotation angle to deal with the performance and the accuracy of viewpoint calculation. Depending on the users’ requirements, it could be recalculated. Indeed the computation time is a function of different parameters (Neuville et al., 2016) :
- the number of analyzed images (directly linked to the rotation increment);
- the size (number of pixels) of the images; - the number of objects to detect;
- the computer capacity.
Figure 10 Bounding box (yellow) and its centre (red) related to the golden tesserae (bottom-up view)
From each camera position, we compute the number of visible tesserae from the user request observed in the produced image. Since each instance of one sort of tesserae is coloured uniquely, the algorithm performs by counting the number of different pixels colours. Hence the number of distinct colours in the image corresponds to the number of tesserae seen from this camera position. The visibility of a tessera is fixed at one pixel but it can be changed according to the users’ needs. The camera position that maximises the view of requested tesserae corresponds to the optimal viewpoint. If two camera locations present the same number of observed tesserae, we apply a maximisation criterion regarding the pixels to determine the optimal camera position.
Figure 11 Camera displacement on the sphere by only considering bottom-up views
4.2 The web-based platform
The World Wide Web is a democratized way to share and exchange information. As such, it constitutes a long-term mean to collaborate, and is independent of the location which is very important considering the need to be able on site to work with digital copies. Indeed, an application accessible anywhere and by multiple users at the same time is key for an archaeological 3D platform. Concurrency is also very important, and a platform should be able to scale up to multiple simultaneous connexions. As such, a client-side application and RESTful development constitute a good solution for a flexible web software.
The International Archives of the Photogrammetry, Remote Sensing and Spatial Information Sciences, Volume XLII-5/W1, 2017 GEOMATICS & RESTORATION – Conservation of Cultural Heritage in the Digital Era, 22–24 May 2017, Florence, Italy
Figure 12 First GUI iteration of the web-based platform for point cloud dissemination and 3D viewpoint management
To integrate the semantically rich point cloud and the viewpoint management of queried tesserae, we developed a web software using jquery, Three.js, Potree (an Open Source JavaScript library for point cloud rendering) and tween.js. The platform includes a tool to directly allow semantic extraction and visualisation of pertinent information for the end users. It enables an efficient information relaying between actors. The web application is implemented in a WebGL framework and is accessible on any HTML5-compatible browser. It enables real time point cloud exploration of the mosaics in the Oratory of Germigny-des-Prés, and emphasises the ease of use as well as performances. A sidebar allows the user to select one kind of tesserae and to directly get into the optimal position in order to visualise efficiently the requested tesserae class.
Since the previous optimal viewpoints are computed from a finite sphere, we gave the possibility to adjust the final computed viewpoint dynamically and in real-time. Indeed, depending on the user’s requirements, the viewpoint can be customised as a function of the visibility need of non-requested objects. In the case of tesserae class visualisation, we zoom in on the objects of the query so as to propose a viewpoint as close as possible to the requested tesserae. The optimal viewpoints for the three sorts of tesserae (faience, golden and silver) are presented in the next section.
4.3 Results & Discussions
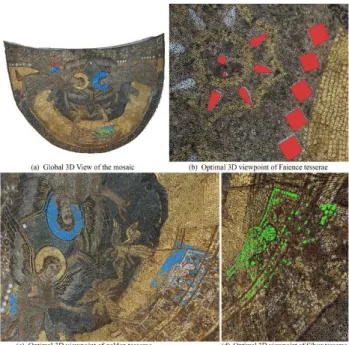
By a simple interaction with the GUI, the users can access and share a common viewpoint result of a semantic query. In the test case, Figure 13 presents the optimal viewpoints for three classes of tesserae. It is worth mentioning that additional viewpoints could be computed which depends on the initial query. For instance, we could calculate multiple optimal camera positions for one specific sort of tesserae, depending on a needed surface, distance to rotation center, density estimate ... The latest could be particularly interesting for the golden tesserae since they are quite scattered in space. Furthermore, we could also investigate the impact of the statistical parameter used when two viewpoints present the same number of objects: maximum, average …
Figure 13 Global 3D view of the mosaic (a) and the optimal viewpoints for the faience, golden and silver tesserae
The tests were carried on three subsets of the global mosaic point cloud in order to validate the methodologies and the global pipeline from acquisition to visualisation and interaction. Future work will include a general classification, and the 3D viewpoint management possibilities will be extended to handle complex query scenario, as well as optimized performances.
5. CONCLUSION
In this paper, we developed an HTML-5 cross-platform web application that facilitates the knowledge dissemination of an ancient mosaic located in the oratory of Germigny-des-Prés. First, we created semantically rich point cloud through smart point cloud structuration. This process was carried by automatic segmentation and classification of tesserae that compose the mosaic. Then, we extracted the necessary requested information from the semantically rich point cloud data structure in order to visualise efficiently three sorts of tesserae distinguished by their material: faience, gold and silver. We computed optimal camera positions and orientations that maximise the visibility of requested tesserae. Then, the optimal viewpoints are dynamically rendered to users through the platform on which interactions can grow.
ACKNOWLEDGEMENTS
Line Van Wersch is acknowledged for her support and guidance in archeological reasoning. The data acquisition was financed by “prix de la fondation Comhaire” - lauréate L. Van Wersch, FRS-FRNS.
6. REFERENCES
Aijazi, A., Checchin, P., Trassoudaine, L., 2013. Segmentation Based Classification of 3D Urban Point Clouds: A Super-Voxel Based Approach with Evaluation. Remote Sens. 5, 1624–1650. doi:10.3390/rs5041624
Ben Hmida, H., Boochs, F., Cruz, C., Nicolle, C., 2012.
The International Archives of the Photogrammetry, Remote Sensing and Spatial Information Sciences, Volume XLII-5/W1, 2017 GEOMATICS & RESTORATION – Conservation of Cultural Heritage in the Digital Era, 22–24 May 2017, Florence, Italy
Knowledge Base Approach for 3D Objects Detection in Point Clouds Using 3D Processing and Specialists Knowledge. Int. J. Adv. Intell. Syst. 5, 1–14.
Brinkhoff, T., Kriegel, H., Schneider, R., Braun, A., 1995. Measuring the Complexity of Polygonal Objects, in: Proceedings of the 3rd ACM International Workshop on Advances in Geographic Information Systems. Baltimore, Maryland, p. 109. doi:10.1.1.73.1045&rep
Chaperon, T., Goulette, F., 2001. Extracting cylinders in full 3D data using a random sampling method and the Gaussian image, in: Computer Vision and Image Understanding. pp. 35–42.
Dimitrov, A., Golparvar-Fard, M., 2015. Segmentation of building point cloud models including detailed architectural/structural features and MEP systems. Autom. Constr. 51, 32–45. doi:10.1016/j.autcon.2014.12.015 Douillard, B., Underwood, J., 2011. On the segmentation of 3D
LIDAR point clouds, in: International Conference on Robotics and Automation. IEEE, Shangai, pp. 2798–2805. doi:10.1109/ICRA.2011.5979818
Girardeau-Montaut, D., 2006. Détection de changement sur des données géométriques tridimensionnelles. Télécom ParisTech.
Girardeau-Montaut, D., Roux, M., Thibault, G., 2005. Change Detection on points cloud data acquired with a ground laser scanner, in: ISPRS Workshop Laser Scanning. ISPRS, Enschede.
Goldberg, D.E., Holland, J.H., 1988. Genetic Algorithms and Machine Learning. Mach. Learn. 3, 95–99. doi:10.1023/A:1022602019183
Lin, H., Gao, J., Zhou, Y., Lu, G., Ye, M., Zhang, C., Liu, L., Yang, R., 2013. Semantic decomposition and reconstruction of residential scenes from LiDAR data. ACM Trans. Graph. 32, 1. doi:10.1145/2461912.2461969 Neuville, R., Poux, F., Hallot, P., Billen, R., 2016. Towards a normalized 3D geovizualisation: The viewpoint management. ISPRS Ann. Photogramm. Remote Sens. Spat. Inf. Sci. IV-2/W1, 179–186. doi:10.5194/isprs-annals-IV-2-W1-179-2016
Nikolov, I., Madsen, C., 2016. Benchmarking Close-range Structure from Motion 3D Reconstruction Software Under Varying Capturing Conditions, in: EuroMed 2016: Digital Heritage. Progress in Cultural Heritage: Documentation, Preservation, and Protection. Springer, Cham, pp. 15–26. doi:10.1007/978-3-319-48496-9_2
Novak, M., 1997. Intelligent Environments: Spatial Aspects of the Information Revolution, P. Droege. ed. Elsevier. doi:978-0-444-82332-8
Novel, C., Keriven, R., Poux, F., Graindorge, P., 2015. Comparing Aerial Photogrammetry and 3D Laser Scanning Methods for Creating 3D Models of Complex Objects, in: Capturing Reality Forum. Bentley Systems, Salzburg, p. 15.
Nurunnabi, A., Belton, D., West, G., 2012. Robust Segmentation in Laser Scanning 3D Point Cloud Data, in: 2012 International Conference on Digital Image Computing Techniques and Applications. IEEE, Fremantle, WA, pp. 1–8. doi:10.1109/DICTA.2012.6411672
Ochmann, S., Vock, R., Wessel, R., Klein, R., 2016. Automatic reconstruction of parametric building models from indoor point clouds. Comput. Graph. 54, 94–103. doi:10.1016/j.cag.2015.07.008
Pieraccini, M., Guidi, G., Atzeni, C., 2001. 3D digitizing of cultural heritage. J. Cult. Herit. 2, 63–70. doi:10.1016/S1296-2074(01)01108-6
Poux, F., Hallot, P., Neuville, R., Billen, R., 2016a. SMART POINT CLOUD: DEFINITION AND REMAINING
CHALLENGES. ISPRS Ann. Photogramm. Remote Sens. Spat. Inf. Sci. IV-2/W1, 119–127. doi:10.5194/isprs-annals-IV-2-W1-119-2016
Poux, F., Neuville, R., Hallot, P., Billen, R., 2016b. Point clouds as an efficient multiscale layered spatial representation, in: Vincent, T., Biljecki, F. (Eds.), Eurographics Workshop on Urban Data Modelling and Visualisation. The Eurographics Association. doi:10.2312/udmv.20161417 Pu, S., Vosselman, G., 2009. Knowledge based reconstruction of
building models from terrestrial laser scanning data. ISPRS J. Photogramm. Remote Sens. 64, 575–584. doi:10.1016/j.isprsjprs.2009.04.001
Remondino, F., Rizzi, A., 2010. Reality-based 3D documentation of natural and cultural heritage sites—techniques, problems, and examples. Appl. Geomatics 2, 85–100. doi:10.1007/s12518-010-0025-x
Remondino, F., Spera, M.G., Nocerino, E., Menna, F., Nex, F., 2014. State of the art in high density image matching. Photogramm. Rec. 29, 144–166. doi:10.1111/phor.12063 Rusu, R.B., Blodow, N., 2009. Close-range scene segmentation
and reconstruction of 3D point cloud maps for mobile manipulation in domestic environments. Intell. Robot. Syst. IROS IEEE/RSJ Int. Conf. 1–6.
Samet, H., Tamminen, M., 1988. Efficient component labeling of images of arbitrary dimension represented by linear bintrees. IEEE Trans. Pattern Anal. Mach. Intell. 10, 579– 586. doi:10.1109/34.3918
Schnabel, R., Wahl, R., Klein, R., 2007. Efficient RANSAC for Point Cloud Shape Detection. Comput. Graph. Forum 26, 214–226. doi:10.1111/j.1467-8659.2007.01016.x Van Wersch, L., Kronz, A., Simon, K., Hocquet, F.-P., Strivay,
D., 2016. Matériaux des mosaïques de Germigny-des-Prés. Germigny-des-prés.
Weinmann, M., 2016. Reconstruction and Analysis of 3D Scenes. Springer International Publishing, Cham. doi:10.1007/978-3-319-29246-5
Xindong Wu, Xingquan Zhu, Gong-Qing Wu, Wei Ding, 2014. Data mining with big data. IEEE Trans. Knowl. Data Eng. 26, 97–107. doi:10.1109/TKDE.2013.109
The International Archives of the Photogrammetry, Remote Sensing and Spatial Information Sciences, Volume XLII-5/W1, 2017 GEOMATICS & RESTORATION – Conservation of Cultural Heritage in the Digital Era, 22–24 May 2017, Florence, Italy