PROPOSED 2011 PROGRAM-BUDGET
Main Document
San Jose, Costa Rica
IICA/CE/Doc.560a(10) Original: Spanish 5-7 October 2010
Contents
I. INTRODUCTION ... 1
II. STRATEGIC GUIDELINES FOR 2011 ... 1
III. THE OVERALL BUDGET FOR 2011 ... 1
IV. RESOURCES OF THE REGULAR FUND ... 2
V. ALLOCATION OF REGULAR FUND RESOURCES BY CHAPTER ... 2
VI. ALLOCATION, BY PROGRAM, OF REGULAR FUND RESOURCES FOR DIRECT TECHNICAL COOPERATION SERVICES ... 4
VII. ALLOCATION OF REGULAR FUND RESOURCES BY MAJOR OBJECT OF EXPENDITURE... 5
I. Introduction
The present document contains the proposed allocation of resources for IICA’s 2011 Program Budget, in accordance with IABA Resolution No. 453, adopted at the Fifteenth Regular Meeting of the Board, held in Jamaica from 29-30 October 2009. The IABA approved the global amount for the 2010-2011 Program Budget and the detailed allocation for 2010, and delegated the task of approving the detailed allocation of the budget for 2011 to the Executive Committee.
This document was submitted for consideration to the Special Advisory Committee on Management Issues, which recommended that the Director General submit it to the Executive Committee. The purposes of the 2011 Program Budget are: i) to define the technical cooperation actions on which the Institute will concentrate its efforts, financed by the Regular Fund (quotas of the Member States and miscellaneous income), to implement the strategic guidelines and priorities set forth in the 2010-2014 Medium-term Plan (MTP); ii) to specify the objectives, outputs and expected results of the actions under each Program financed by the Regular Fund; iii) to show an estimate of the external resources that are expected to be executed and the financing of the Complementary Structure financed with the Institutional Net Rate (INR) resources needed to support the execution of those external resources; and, iv) to allocate Regular Fund resources in accordance with the priorities of the 2010-2014 Medium-term Plan.
II. Strategic Guidelines for 2011
To implement the 2010-2014 MTP, IICA will prioritize its cooperation efforts under four Technical Concentration Programs and two Areas for Cross-coordination aligned with the Core Thematic Areas for Cooperation and the Strategic Objectives of the MTP. There will also be a Center for Strategic Analysis for Agriculture that will furnish the programs and areas with strategic information about agricultural issues.
The Technical Concentration Programs, which will be institutional in nature, will be:
Innovation for Productivity and Competitiveness Agricultural Health and Food Safety
Agribusiness and Marketing
Agriculture, Territories, and Rural Well-being The Areas for Cross-coordination will be:
Agriculture, Natural Resources Management and Climate Change Agriculture and Food Security
Appendix 1 presents the general objectives and the lines of action, with their specific objectives, expected results and indicators of the Technical Concentration Programs, the Areas for Cross-cutting Coordination and the Center for Strategic Analysis for Agriculture for 2010-2014.
The Institute’s role in, the products, expected results and specific achievement indicators of technical cooperation actions, will be defined in the projects financed with the resources of the Regular Fund.
III. The Overall Budget for 2011
The Institute finances its technical cooperation activities emanating from mandates of the governing bodies with resources from the Regular Fund. That fund is made up of Member State quotas and miscellaneous income, basically from financial yields, tax recovery and the sale of assets and services. In addition, the Institute complements its technical cooperation actions with programs and projects financed with external resources, based on agreements with partners or counterparts. For the Institute, managing external resources means increased technical and administrative personnel requirements and higher operating costs. These additional costs are covered by the Institutional Net Rate that the counterparts undertake to pay IICA.
2 It is estimated that for 2011 external resources will amount to US$154.6 million and INR resources will amount to US$9.7 million. The preliminary allocation of INR resources totals US$10.1 million, comprising US$9.7 million in INR resources to be generated in 2011 and approximately US$450,000 from the INR Fund.
The final allocation of INR resources is subject to the signing of agreements that give rise to programs and projects financed with external resources and to the projected estimate of INR resources to be generated as a result of those agreements. The allocation policy states that up to 50% of INR resources is allocated to the Offices in the Member States and the other 50% is used to finance complementary structures of units and corporate activities that provide direct support in the execution of external resources.
The Regular Fund budget approved for 2011 is US$33,398,239. Of this amount, US$27,298,239 corresponds to Member State quotas and US$6,100,000 to miscellaneous income.
At its Fifteenth Regular Meeting, held in Jamaica in 2009, the IABA approved the Regular Fund resources, quota contributions and miscellaneous income for the period 2010-2011. The data for external and INR resources are merely indicative and their approval is subject to the signing of agreements and the generation of the respective INR resources.
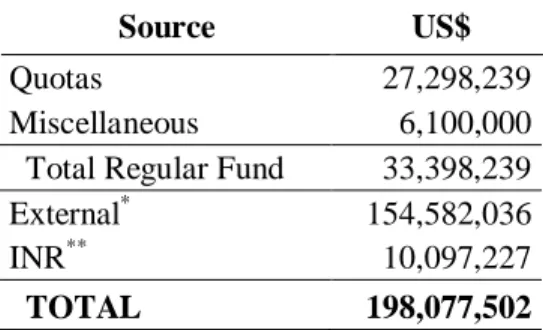
In sum, the overall budget for 2011 is as follows:
Source US$
Quotas 27,298,239
Miscellaneous 6,100,000
Total Regular Fund 33,398,239
External* 154,582,036
INR** 10,097,227
TOTAL 198,077,502
*/ Estimated figures
**/Includes the INR resources expected to be generated and approximately US$450,000 from the INR Fund.
In the List of Tables, Table 1 shows the overall budget by source.
Table 2 breaks down the overall budget by programming center and
source of financing.
IV.
Resources of the Regular Fund
The proposed 2011 Program Budget for the Regular Fund focuses the use of resources on the priorities and guidelines established in the 2010-2014 Medium-term Plan.
Table 3 shows the evolution of the budget of the Regular Fund in
recent years and the overall amounts approved by the IABA for the 2010-2011 biennium.
Table 4 shows the quota scale for the Member States and the amount
of miscellaneous resources approved by the IABA for the 2010-2011 biennium.
V.
Allocation of Regular Fund
Resources by Chapter
The Institute’s budget is divided into four chapters:
Chapter I: Direct Technical Cooperation Services Chapter II: Management Costs
Chapter III: General Costs and Provisions
Chapter IV: Renewal of Infrastructure and Equipment
Table 5 shows the proposed allocation of resources from the Regular
Fund for 2011, by chapter.
Chapter I: Direct Technical Cooperation Services
This chapter contains the costs of the Institute’s technical cooperation actions at the national, regional and hemispheric levels required to
3 achieve the objectives set in the Medium-term Plan. It includes IICA’s contribution to the Tropical Agriculture Research and Higher Education Center (CATIE). The resources allocated for this Chapter are as follows:
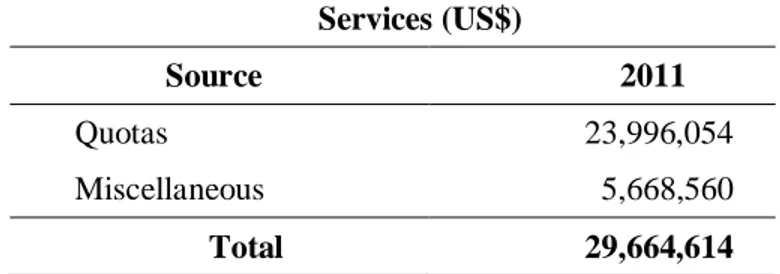
Chapter I: Direct Technical Cooperation Services (US$)
Source 2011
Quotas 23,996,054
Miscellaneous 5,668,560
Total 29,664,614
These resources, used to finance technical cooperation, account for 88.8% of the Regular Fund.
Table 5 shows the distribution of this chapter by Technical
Concentration Program.
Chapter II: Management Costs
Chapter II: Management Costs includes the resources of the units responsible for managing the Institute and providing support services. Those units, which are located at Headquarters, are the Office of the Director General and the Secretariat of Corporate Services.
The former, for the purposes of Chapter II: Management Costs, includes the Office of the Director General, the Office of the Deputy Director General, the Coordination Unit, the Internal Audit Unit, the Legal Services Unit and the Social Communication Unit.
Corporate Services is made up of the Office of the Director of Corporate Services and services related to finance, human resources, programming, budget, as well as general services.
The resources that these units use to renew their infrastructure and equipment (Chapter IV) are not included. The resources allocated for this chapter are:
Chapter II: Management Costs (US$)
Source 2011
Quotas 1,631,376
Miscellaneous 77,783
Total 1,709,159
These resources, which are used to cover management costs, account for 5.1% of the Regular Fund.
Table 5 shows the allocation of the Regular Fund for 2011 for this
chapter.
Chapter III: General Costs and Provisions
General Costs and Provisions are general commitments not directly related to the preceding chapters or to a specific Unit. They include support for the Governing Bodies, insurance, the OAS Administrative Tribunal and the OAS Retirement and Pension Fund, the external audit, the pensions of former Directors General and the Emergency Assistance Fund for IICA Personnel.
The resources for this chapter are:
Chapter III: General Costs and Provisions (US$)
Source 2011
Quotas 1,274,952
Miscellaneous 50,000
4 These resources, used to cover general costs and provisions, account for 4.0% of the Regular Fund.
Table 5 gives a breakdown the content of this chapter for 2011. Chapter IV: Renewal of Infrastructure and Equipment
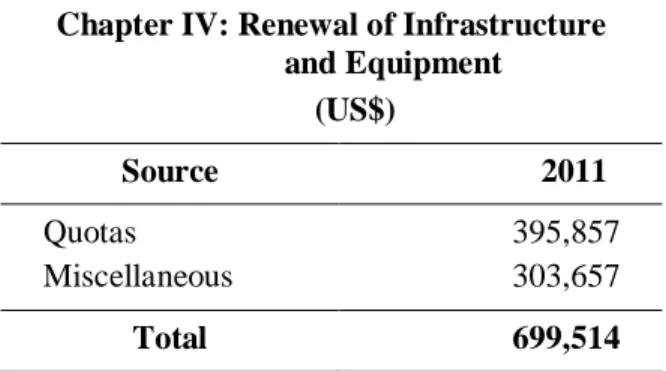
The budget items included in this Chapter are improvements to IICA-owned properties and buildings and the purchase of vehicles, equipment and computer licenses.
The resources allocated are as follows:
Chapter IV: Renewal of Infrastructure and Equipment (US$) Source 2011 Quotas 395,857 Miscellaneous 303,657 Total 699,514
These resources, used for the renewal of infrastructure and equipment, account for 2.1% of the Regular Fund.
Personnel and Operating Costs for 2011 financed with the Regular Fund
Table 6 shows: i) allocations by groups of objects of expenditure
(International Professional Personnel, Local Professional Personnel, General Services Personnel and Operating Costs); ii) the number of personnel positions, by category and classification; and, iii) the sources of financing.
VI. Allocation, by Program, of Regular Fund
Resources for Direct Technical
Cooperation Services
As explained in section “II. Strategic Guidelines for 2011,” the proposal focuses IICA’s cooperation actions on the Technical Concentration Programs established in the 2010-2014 Medium-term Plan, which are: Innovation for Productivity and Competitiveness; Agricultural Health and Food Safety; Agribusiness and Marketing; and, Agriculture, Territories and Rural Well-being.
The resources allocated to each of the four Technical Concentration Programs comprise the amounts earmarked for:
Institutional programs at the hemispheric, regional and national levels
Institutional Funds and Line Items
Activities to provide technical support to the institutional programs
A breakdown of this information by Technical Concentration Program, for the resources of the Regular Fund, appears in Appendix 2.
Table 5 shows the allocation of the Regular Fund for each of the
Technical Concentration Programs. These resources are distributed as follows: 29.4% for the program Innovation for Productivity and Competitiveness; 24.0% for the program Agricultural Health and Food Safety; 23.8% for the program Agribusiness and Marketing; and, 22.8% for the program Agriculture, Territories and Rural Well-being.
The allocation is based on the priorities established in the 2010-2014 Medium-term Plan.
5
VII. Allocation of Regular Fund Resources
by Major Objective of Expenditure
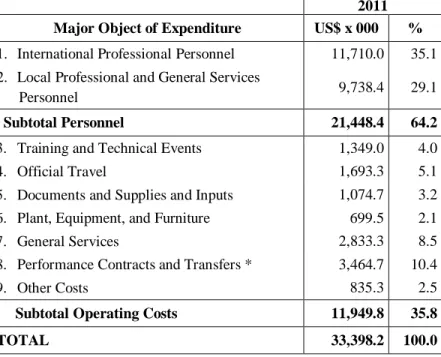
The distribution of the Regular Fund by Major Object of Expenditure (MOE) for 2011 is as follows:
2011 Major Object of Expenditure US$ x 000 %
1. International Professional Personnel 11,710.0 35.1 2. Local Professional and General Services
Personnel 9,738.4 29.1
Subtotal Personnel 21,448.4 64.2
3. Training and Technical Events 1,349.0 4.0 4. Official Travel 1,693.3 5.1 5. Documents and Supplies and Inputs 1,074.7 3.2 6. Plant, Equipment, and Furniture 699.5 2.1 7. General Services 2,833.3 8.5 8. Performance Contracts and Transfers * 3,464.7 10.4 9. Other Costs 835.3 2.5
Subtotal Operating Costs 11,949.8 35.8
TOTAL 33,398.2 100.0
*/ Includes transfer of US$1,000,000 to CATIE.
Considering that the Institute is a technical cooperation organization whose main strength is the knowledge of its personnel, 64.2% of the budget of the Regular Fund is earmarked for personnel costs and 35.8% for operating costs.
Table 7 gives a breakdown for each major object of expenditure (the
items of which they are composed, in monetary and percentage terms) to make it easier to understand the purposes of each one.
Table 8 shows the number of staff positions financed with resources
from the Regular Fund between 1992 and 2011. For 2011, the proposed distribution of personnel is as follows: 93 international professional, 157 local professional and 213 general service positions. The activities of 91.4% of the international professionals and 96.8% of the local professionals involve direct technical cooperation.
VIII. Projection of External Resources and INR
It is estimated that IICA will execute US$154,582,036 in external funds in 2011.
In order to cover the incremental costs incurred in the execution of these external resources, IICA expects to receive US$9,649,035 in INR resources in 2011.
Appendix 3 gives a breakdown of the projection of external and INR
LIST OF TABLES
Table 1
Overall Budget, 2011 Program Budget, US$ x 000
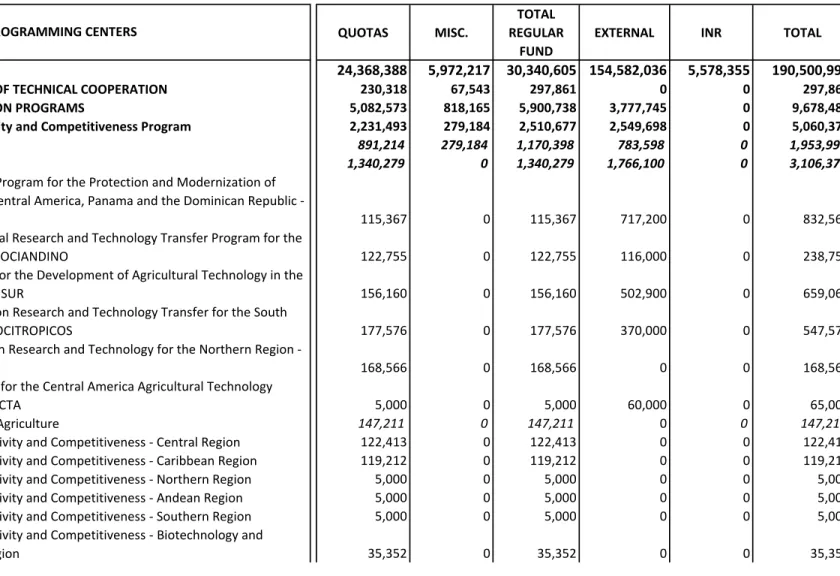
Table 2
Overall Budget by Programming Center and Source of Financing, 2011-US$
Table 3
Evolution of the Regular Fund in Nominal Values, 1994-2009 and 2010-2011, US$ x 000
Table 4
Quota Scale of the Member States and Miscellaneous Income, 2010 and 2011, US$
Table 5
Allocation of the Regular Fund by Chapter, US$
Table 6
Overall Allocation, Regular Fund: Quotas and Miscellaneous Income, US$ and Number of Staff Positions
Table 7
Structure of the Major Object of Expenditure, Regular Fund, US$ x 000 and %
Table No. 1
2011
Program Budget
QUOTAS OF MEMBER STATES 27,298.2
MISCELLANEOUS INCOME 6,100.0
TOTAL REGULAR FUND 33,398.2
EXTERNAL RESOURCES FOR PROGRAMS AND PROJECTS* 154,582.0
INSTITUTIONAL NET RATE** 10,097.3
198,077.5
Overall Budget
2011 Program Budget
(US$ x 000)
**/ Includes the INR resources expected to be generated and approximately US$450,000 from the INR Fund. */ Estimates. Final figures will depend on the agreements signed.
RESOURCES BY SOURCE
TOTAL
AMOUNT
Table No. 2
QUOTAS MISC.
TOTAL REGULAR
FUND
EXTERNAL INR TOTAL 24,368,388 5,972,217 30,340,605 154,582,036 5,578,355 190,500,996 230,318 67,543 297,861 0 0 297,861 5,082,573 818,165 5,900,738 3,777,745 0 9,678,483 2,231,493 279,184 2,510,677 2,549,698 0 5,060,375 891,214 279,184 1,170,398 783,598 0 1,953,996 Regional Component 1,340,279 0 1,340,279 1,766,100 0 3,106,379
Regional Cooperative Program for the Protection and Modernization of Coffee Cultivation in Central America, Panama and the Dominican Republic -
PROMECAFE 115,367 0 115,367 717,200 0 832,567
Cooperative Agricultural Research and Technology Transfer Program for the
Andean Subregion - PROCIANDINO 122,755 0 122,755 116,000 0 238,755
Cooperative Program for the Development of Agricultural Technology in the
Southern Cone - PROCISUR 156,160 0 156,160 502,900 0 659,060
Cooperative Program on Research and Technology Transfer for the South
American Tropics - PROCITROPICOS 177,576 0 177,576 370,000 0 547,576
Cooperative Program in Research and Technology for the Northern Region -
PROCINORTE 168,566 0 168,566 0 0 168,566
Support to the System for the Central America Agricultural Technology
Integration System - SICTA 5,000 0 5,000 60,000 0 65,000
Promotion of Organic Agriculture 147,211 0 147,211 0 0 147,211
Innovation for Productivity and Competitiveness - Central Region 122,413 0 122,413 0 0 122,413 Innovation for Productivity and Competitiveness - Caribbean Region 119,212 0 119,212 0 0 119,212 Innovation for Productivity and Competitiveness - Northern Region 5,000 0 5,000 0 0 5,000 Innovation for Productivity and Competitiveness - Andean Region 5,000 0 5,000 0 0 5,000 Innovation for Productivity and Competitiveness - Southern Region 5,000 0 5,000 0 0 5,000 Innovation for Productivity and Competitiveness - Biotechnology and
Biosafety - Andean Region 35,352 0 35,352 0 0 35,352
PROGRAMMING CENTERS
2011
Overall Budget by Programming Center and Source of Financing
2011 - US$
I. TECHNICAL COOPERATION
Program Budget
A. OFFICE OF THE DIRECTOR OF TECHNICAL COOPERATION B. TECHNICAL CONCENTRATION PROGRAMS
1. Innovation for Productivity and Competitiveness Program
Hemispheric Component
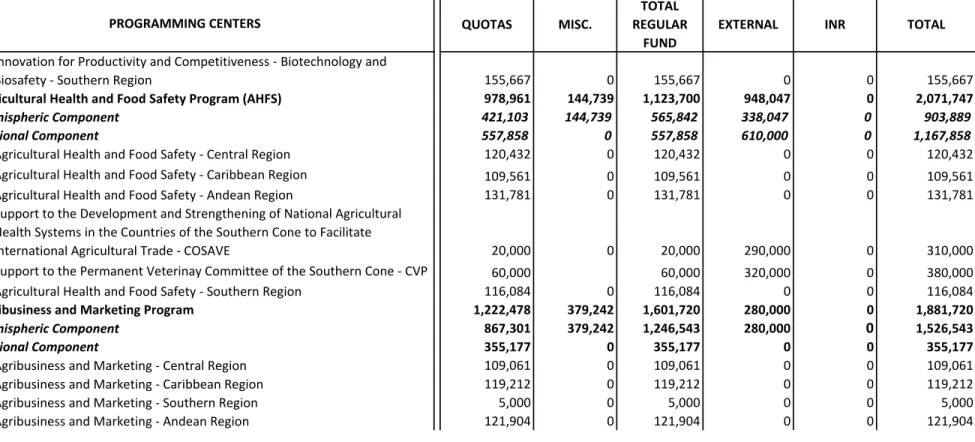
Table No. 2
QUOTAS MISC.
TOTAL REGULAR
FUND
EXTERNAL INR TOTAL PROGRAMMING CENTERS
2011
Overall Budget by Programming Center and Source of Financing
2011 - US$
Program Budget
Innovation for Productivity and Competitiveness - Biotechnology and
Biosafety - Southern Region 155,667 0 155,667 0 0 155,667
978,961 144,739 1,123,700 948,047 0 2,071,747
421,103 144,739 565,842 338,047 0 903,889
Regional Component 557,858 0 557,858 610,000 0 1,167,858
Agricultural Health and Food Safety - Central Region 120,432 0 120,432 0 0 120,432 Agricultural Health and Food Safety - Caribbean Region 109,561 0 109,561 0 0 109,561 Agricultural Health and Food Safety - Andean Region 131,781 0 131,781 0 0 131,781 Support to the Development and Strengthening of National Agricultural
Health Systems in the Countries of the Southern Cone to Facilitate
International Agricultural Trade - COSAVE 20,000 0 20,000 290,000 0 310,000
Support to the Permanent Veterinay Committee of the Southern Cone - CVP 60,000 60,000 320,000 0 380,000 Agricultural Health and Food Safety - Southern Region 116,084 0 116,084 0 0 116,084 1,222,478 379,242 1,601,720 280,000 0 1,881,720 867,301 379,242 1,246,543 280,000 0 1,526,543
Regional Component 355,177 0 355,177 0 0 355,177
Agribusiness and Marketing - Central Region 109,061 0 109,061 0 0 109,061
Agribusiness and Marketing - Caribbean Region 119,212 0 119,212 0 0 119,212
Agribusiness and Marketing - Southern Region 5,000 0 5,000 0 0 5,000
Agribusiness and Marketing - Andean Region 121,904 0 121,904 0 0 121,904
Hemispheric Component
3. Agribusiness and Marketing Program
Hemispheric Component
2. Agricultural Health and Food Safety Program (AHFS)
Table No. 2
QUOTAS MISC.
TOTAL REGULAR
FUND
EXTERNAL INR TOTAL PROGRAMMING CENTERS
2011
Overall Budget by Programming Center and Source of Financing
2011 - US$
Program Budget
649,641 15,000 664,641 0 0 664,641
286,003 15,000 301,003 0 301,003
Regional Component 363,638 0 363,638 0 0 363,638
Agriculture, Territories and Rural Well-being - Central Region 120,348 0 120,348 0 0 120,348 Agriculture, Territories and Rural Well-being - Caribbean Region 5,000 0 5,000 0 0 5,000 Agriculture, Territories and Rural Well-being - Andean Region 114,577 0 114,577 0 0 114,577 Agriculture, Territories and Rural Well-being - Southern Region 123,713 0 123,713 0 0 123,713
371,837 125,798 497,635 0 0 497,635 188,487 40,000 228,487 0 0 228,487 183,350 85,798 269,148 0 269,148 878,346 228,566 1,106,912 0 0 1,106,912 281,133 228,566 509,699 0 0 509,699 Regional Component 597,213 0 597,213 0 0 597,213
Center for Strategic Analysis for Agriculture - Central Region 120,069 0 120,069 0 0 120,069 Center for Strategic Analysis for Agriculture - Caribbean Region 117,827 0 117,827 0 0 117,827 Center for Strategic Analysis for Agriculture - Andean Region 123,129 0 123,129 0 0 123,129 Center for Strategic Analysis for Agriculture - Southern Region 136,188 0 136,188 0 0 136,188 Support for the Agricultural Policy Coordination Network of the South -
REDPA and Support for the Informal Group of the Agricultural Negotiators -
GINA SUR 100,000 0 100,000 0 0 100,000
E. TECHNICAL COOPERATION SUPPORT UNITS 488,462 484,200 972,662 0 452,286 1,424,948
114,906 256,990 371,896 0 0 371,896
204,806 91,701 296,507 0 0 296,507
100,470 59,000 159,470 0 452,286 611,756
68,280 76,509 144,789 0 0 144,789
Hemispheric Component
1. Agricultural Leadership Center
2. Inter-American Center for Information and Editorial Production 3. Information and Communication Technologies
4. Center for Communication and Distance Learning - CECADI
Hemispheric Component
C. AREAS FOR CROSS-COORDINATION: 1. Agriculture and Food Security
2. Agriculture, Natural Resource Management and Climate Change D. CENTER FOR STRATEGIC ANALYSIS FOR AGRICULTURE
4. Agriculture, Territories and Rural Well-being Program
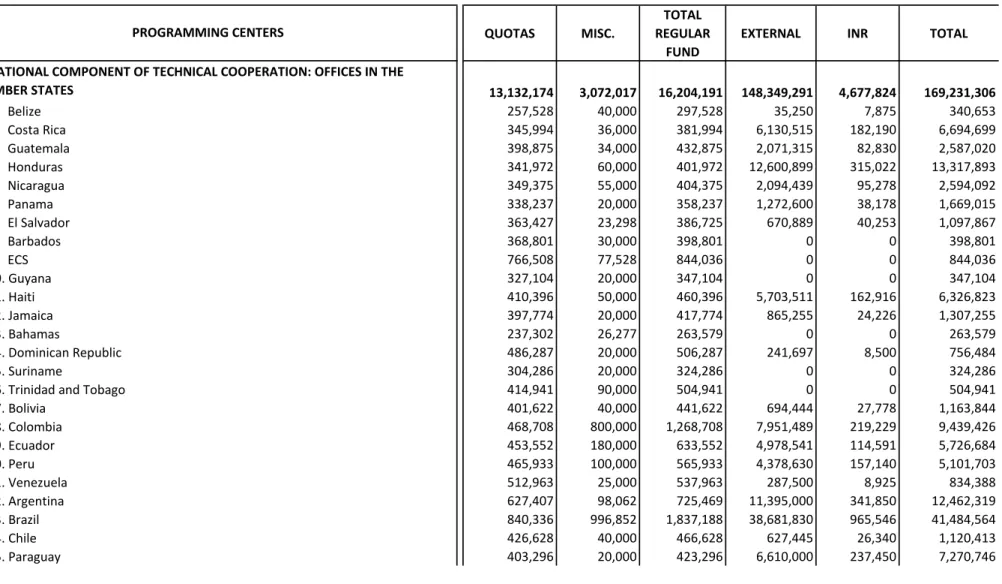
Table No. 2
QUOTAS MISC.
TOTAL REGULAR
FUND
EXTERNAL INR TOTAL PROGRAMMING CENTERS
2011
Overall Budget by Programming Center and Source of Financing
2011 - US$
Program Budget
13,132,174 3,072,017 16,204,191 148,349,291 4,677,824 169,231,306 257,528 40,000 297,528 35,250 7,875 340,653 345,994 36,000 381,994 6,130,515 182,190 6,694,699 398,875 34,000 432,875 2,071,315 82,830 2,587,020 341,972 60,000 401,972 12,600,899 315,022 13,317,893 349,375 55,000 404,375 2,094,439 95,278 2,594,092 338,237 20,000 358,237 1,272,600 38,178 1,669,015 363,427 23,298 386,725 670,889 40,253 1,097,867 368,801 30,000 398,801 0 0 398,801 766,508 77,528 844,036 0 0 844,036 327,104 20,000 347,104 0 0 347,104 410,396 50,000 460,396 5,703,511 162,916 6,326,823 397,774 20,000 417,774 865,255 24,226 1,307,255 237,302 26,277 263,579 0 0 263,579 486,287 20,000 506,287 241,697 8,500 756,484 304,286 20,000 324,286 0 0 324,286 414,941 90,000 504,941 0 0 504,941 401,622 40,000 441,622 694,444 27,778 1,163,844 468,708 800,000 1,268,708 7,951,489 219,229 9,439,426 453,552 180,000 633,552 4,978,541 114,591 5,726,684 465,933 100,000 565,933 4,378,630 157,140 5,101,703 512,963 25,000 537,963 287,500 8,925 834,388 627,407 98,062 725,469 11,395,000 341,850 12,462,319 840,336 996,852 1,837,188 38,681,830 965,546 41,484,564 426,628 40,000 466,628 627,445 26,340 1,120,413 403,296 20,000 423,296 6,610,000 237,450 7,270,746 F. NATIONAL COMPONENT OF TECHNICAL COOPERATION: OFFICES IN THEMEMBER STATES 1. Belize 2. Costa Rica 3. Guatemala 4. Honduras 5. Nicaragua 6. Panama 7. El Salvador 8. Barbados 9. ECS 10. Guyana 11. Haiti 12. Jamaica 13. Bahamas 14. Dominican Republic 15. Suriname
16. Trinidad and Tobago 17. Bolivia 18. Colombia 19. Ecuador 20. Peru 21. Venezuela 22. Argentina 23. Brazil 24. Chile 25. Paraguay
Table No. 2
QUOTAS MISC.
TOTAL REGULAR
FUND
EXTERNAL INR TOTAL PROGRAMMING CENTERS
2011
Overall Budget by Programming Center and Source of Financing
2011 - US$
Program Budget
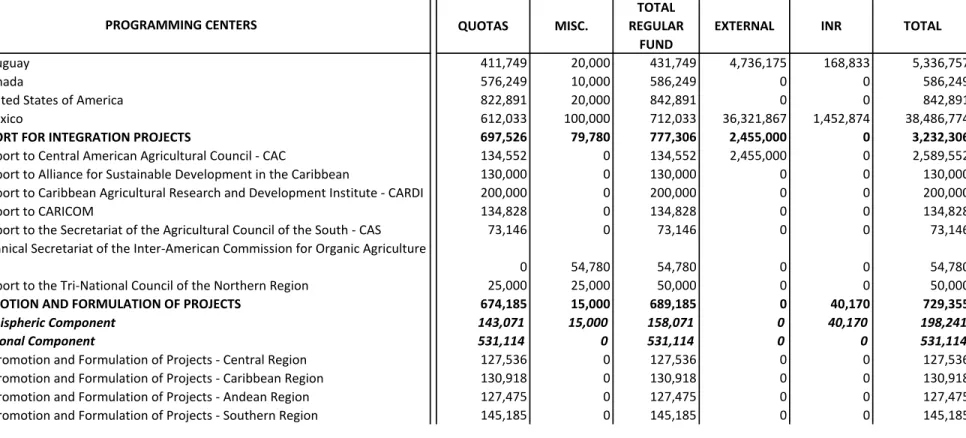
411,749 20,000 431,749 4,736,175 168,833 5,336,757 576,249 10,000 586,249 0 0 586,249 822,891 20,000 842,891 0 0 842,891 612,033 100,000 712,033 36,321,867 1,452,874 38,486,774 697,526 79,780 777,306 2,455,000 0 3,232,306 134,552 0 134,552 2,455,000 0 2,589,552 130,000 0 130,000 0 0 130,000 200,000 0 200,000 0 0 200,000 134,828 0 134,828 0 0 134,828 73,146 0 73,146 0 0 73,146 0 54,780 54,780 0 0 54,780 25,000 25,000 50,000 0 0 50,000H. PROMOTION AND FORMULATION OF PROJECTS 674,185 15,000 689,185 0 40,170 729,355
143,071 15,000 158,071 0 40,170 198,241
Regional Component 531,114 0 531,114 0 0 531,114
Promotion and Formulation of Projects - Central Region 127,536 0 127,536 0 0 127,536 Promotion and Formulation of Projects - Caribbean Region 130,918 0 130,918 0 0 130,918 Promotion and Formulation of Projects - Andean Region 127,475 0 127,475 0 0 127,475 Promotion and Formulation of Projects - Southern Region 145,185 0 145,185 0 0 145,185 G. SUPPORT FOR INTEGRATION PROJECTS
Hemispheric Component
26. Uruguay 27. Canada
28. United States of America 29. Mexico
7. Support to the Tri-National Council of the Northern Region
6. Technical Secretariat of the Inter-American Commission for Organic Agriculture - ICOA
1. Support to Central American Agricultural Council - CAC
2. Support to Alliance for Sustainable Development in the Caribbean
3. Support to Caribbean Agricultural Research and Development Institute - CARDI 4. Support to CARICOM
5. Support to the Secretariat of the Agricultural Council of the South - CAS
Table No. 2
QUOTAS MISC.
TOTAL REGULAR
FUND
EXTERNAL INR TOTAL PROGRAMMING CENTERS
2011
Overall Budget by Programming Center and Source of Financing
2011 - US$
Program Budget
I. TECHNICAL SUPPORT UNITS AND ACTIONS 1,283,789 299,651 1,583,440 0 408,075 1,991,515 361,126 91,241 452,367 0 128,603 580,970 371,518 52,249 423,767 0 15,175 438,942 551,145 56,161 607,306 0 264,297 871,603
0 100,000 100,000 0 0 100,000
J. INSTITUTIONAL FUNDS AND LINE ITEMS 529,178 781,497 1,310,675 0 0 1,310,675
Institutional Funds and Line Items 529,178 781,497 1,310,675 0 0 1,310,675
K. CONTRIBUTION TO CATIE 1,000,000 0 1,000,000 0 0 1,000,000
Contribution to CATIE 1,000,000 0 1,000,000 0 0 1,000,000
II. MANAGEMENT UNITS 1,654,899 77,783 1,732,682 0 2,978,961 4,711,643
663,770 20,000 683,770 0 1,048,913 1,732,683 991,129 57,783 1,048,912 0 1,930,048 2,978,960
III. CORPORATE ACTIVITIES 1,274,952 50,000 1,324,952 0 1,539,911 2,864,863
Housing Allowance 0 0 0 0 650,000 650,000
Financial Information System 0 0 0 0 314,911 314,911
Stabilization for loss of purchasing power of US$, Funding Cycles for
Projects and Preinvestment 0 0 0 0 575,000 575,000
Governing Bodies 400,000 0 400,000 0 0 400,000
Insurance 441,802 0 441,802 0 0 441,802
Pensions Former Directors 287,650 0 287,650 0 0 287,650
Contribution to the Administration of the Retirement and Pension Fund 25,000 0 25,000 0 0 25,000
Contribution to the OAS Administrative Tribunal 25,000 0 25,000 0 0 25,000
External Audit 95,500 0 95,500 0 0 95,500
Emergency Assistance Program for Staff 0 50,000 50,000 0 0 50,000
27,298,239 6,100,000 33,398,239 154,582,036 10,097,227 198,077,502 TOTAL
2. Secretariat of Corporate Services
1. Directorate of Management and Regional Integration 2. Secretariat of Planning and Evaluation
3. Secretariat of External Relations (including Permanent Office in Europe) 4. Strenghtening of Technical Capabilities
1. Office of the Director General (Chapters II and IV)
Evolution of the Regular Fund in Nominal Values
1994-2009 and 2010-2011 (US$ x 000)
PERIOD QUOTAS MISCELLANEOUS REGULAR FUND 1994 26,707.5 267.1 26,974.6 1995 27,508.7 275.1 27,783.8 1996 27,508.7 283.4 27,792.1 1997 27,508.7 291.9 27,800.6 1998 27,508.7 2,491.3 30,000.0 1999 27,508.7 2,491.3 30,000.0 2000 27,508.7 2,491.3 30,000.0 2001 27,508.7 2,491.3 30,000.0 2002 27,508.7 2,491.3 30,000.0 2003 27,167.6 2,832.4 30,000.0 2004 27,167.6 2,832.4 30,000.0 2005 27,167.6 2,832.4 30,000.0 2006 27,167.6 2,832.4 30,000.0 2007 27,167.6 2,832.4 30,000.0 2008 27,227.8 4,100.0 31,327.8 2009 27,227.8 4,100.0 31,327.8 2010 27,298.2 6,100.0 33,398.2 2011 27,298.2 6,100.0 33,398.2
Note: The Cuban quota was excluded from the quota resources as of 2003.
Table No. 3
2010-2011
Program Budget
Table No. 4
OAS
% % AMOUNT % AMOUNT
Antigua and Barbuda 0.022 0.022 6,052 0.022 6,052
Argentina 3.211 3.211 883,304 3.211 883,304 Bahamas 0.077 0.077 21,182 0.077 21,182 Barbados 0.060 0.060 16,505 0.060 16,505 Belize 0.022 0.022 6,052 0.022 6,052 Bolivia 0.046 0.046 12,654 0.046 12,654 Brazil 7.953 7.953 2,187,765 7.953 2,187,765 Canada 13.761 13.761 3,785,469 13.761 3,785,469 Chile 1.073 1.073 295,168 1.073 295,168 Colombia 0.839 0.839 230,798 0.839 230,798 Costa Rica 0.187 0.187 51,441 0.187 51,441 Dominica 0.022 0.022 6,052 0.022 6,052 Dominican Republic 0.206 0.206 56,668 0.206 56,668 Ecuador 0.207 0.207 56,943 0.207 56,943 El Salvador 0.105 0.105 28,884 0.105 28,884 Grenada 0.022 0.022 6,052 0.022 6,052 Guatemala 0.187 0.187 51,441 0.187 51,441 Guyana 0.022 0.022 6,052 0.022 6,052 Haiti 0.045 0.045 12,379 0.045 12,379 Honduras 0.045 0.045 12,379 0.045 12,379 Jamaica 0.123 0.123 33,836 0.123 33,836 Mexico 8.141 8.141 2,239,482 8.141 2,239,482 Nicaragua 0.045 0.045 12,379 0.045 12,379 Panama 0.163 0.163 44,839 0.163 44,839 Paraguay 0.124 0.124 34,111 0.124 34,111 Peru 0.553 0.553 152,123 0.553 152,123
Saint Kitts and Nevis 0.022 0.022 6,052 0.022 6,052
Saint Lucia 0.022 0.022 6,052 0.022 6,052
Saint Vincent and the Grenadines 0.022 0.022 6,052 0.022 6,052
Suriname 0.045 0.045 12,379 0.045 12,379
Trinidad and Tobago 0.152 0.152 41,813 0.152 41,813
United States of America 59.470 59.470 16,359,412 59.470 16,359,412
Uruguay 0.181 0.181 49,791 0.181 49,791 Venezuela 2.060 2.060 566,679 2.060 566,679 SUB TOTAL 99.235 99.235 27,298,239 99.235 27,298,239 Cuba 0.765 0.765 0.765 TOTAL QUOTAS 100.000 100.000 27,298,239 100.000 27,298,239 MISCELLANEOUS INCOME 2 6,100,000 6,100,000
TOTAL REGULAR FUND 33,398,239 33,398,239
Note: The percentage for Cuba is not taken into consideration when calculating the Member State quotas. 1/ As per Resolution AG/RES. 1 (XXXVI-E/08), of the OAS General Assembly.
2/ In 2010 and 2011 miscellaneous income will comprise US$4,100,000 to be generated and US2,000,000 from the Miscellaneous Fund.
IICA IICA
2010 2011
Based on the OAS Quota Scale for 2009.
1(US$)
MEMBER STATES
Program Budget
Table No. 5
QUOTAS MISCELLANEOUS
US$ US$ US$
CHAPTER I: Direct Technical Cooperation Services 23,996,054 5,668,560 29,664,614 100.0% 88.8% Innovation for Productivity and Competitiveness Program 7,435,100 1,297,230 8,732,330 29.4% Agricultural Health and Food Safety Program 5,576,751 1,545,247 7,121,998 24.0% Agribusiness and Marketing Program 5,457,230 1,595,900 7,053,130 23.8% Agriculture, Territories and Rural Well-being Program 5,526,973 1,230,183 6,757,156 22.8% CHAPTER II: Management Costs 1,631,376 77,783 1,709,159 100.0% 5.1%
Office of the Director General 662,870 20,000 682,870 40.0% Secretariat of Corporate Services 968,506 57,783 1,026,289 60.0% CHAPTER III: General Cost and Provisions 1,274,952 50,000 1,324,952 100.0% 4.0%
Governing Bodies 400,000 0 400,000 30.2%
Insurance 441,802 0 441,802 33.3%
Pensions Former Directors 287,650 0 287,650 21.7%
Contribution to the OAS Administrative Tribunal 25,000 0 25,000 1.9% Contribution to the Administration of the Retirement and Pension Fund 25,000 0 25,000 1.9%
External Audit 95,500 0 95,500 7.2%
Emergency Assistance Program for Staff 0 50,000 50,000 3.8% CHAPTER IV: Renewal of Infrastructure and Equipment 395,857 303,657 699,514 100.0% 2.1%
TOTAL 27,298,239 6,100,000 33,398,239 100.0%
PP-C-05 Table N. 5: Page 1 of 1
2011
Program Budget
Allocation of the Regular Fund by Chapter
(US$)
CHAPTER REGULAR FUND
Overall Allocation
Regular Fund: Quotas and Miscellaneous
(US$ and Number of Positions)
Program Budget Table N° 6 2011 DG 1 SDG 1 D1 1 D2 17 P6 14 P5 56 P4 1 P3 1 P2 P1 Class Total 93 PL5 10 PL4 44 PL2 24 PL3 66 PL1 13 Class Total 157 G9 1 G8 9 G6 56 G7 49 G5 27 G4 36 G3 19 G2 10 G1 6 Class Total 213
Summary IPP Summary LPP
Summary GSP Number of Positions
Summary by Object of Expenditure
International Professional Personnel (IPP) 11,710,011
Local Professional Personnel (LPP) 6,417,784
General Services Personnel (GSP) 3,320,616
Operating Costs (MOE 3 to 9) 11,949,828
Total 33,398,239 35.1% 19.2% 9.9% 35.8% 100.0% US$ % Source of Funds Quota Resources 27,298,239 Miscellaneous Resources 6,100,000 Total 33,398,239 81.7% 100.0% US$ % 18.3% Total 370 Total LPP and GSP SDGA 1 2011 2011 2011 2011 2011
Table No. 6: Page 1 of 1 PP-Ci-06 BD CPS
Table 7
Program Budget
1 International Professional Personnel 11,710.0 100.0%
Salaries 6,089.2 52.0%
Benefits and Other Costs of International Personnel 5,620.8 48.0%
2 Local Professional and General Services Personnel 9,738.4 100.0%
Salaries 6,816.9 70.0%
Benefits and Other Costs of National Personnel 2,921.5 30.0%
3 Training and Technical Events 1,349.0 100.0%
Training for Personnel 161.9 12.0%
Technical Events 1,133.2 84.0%
Didactic Material 54.0 4.0%
4 Official Travel 1,693.3 100.0%
Per Diems 1,100.6 65.0%
Transportation 592.7 35.0%
5 Documents and Materials and Supplies 1,074.7 100.0%
Publications and Documents 429.9 40.0%
Office Materials and Supplies 569.6 53.0%
Materials for IICA Projects 75.2 7.0%
6 Plant, Equipment and Furniture 699.5 100.0%
Improvements to Land, Buildings and Immoveable Assets 42.0 6.0%
Acquisition of Equipment and Furnishings 517.6 74.0%
Acquisition of Vehicles 139.9 20.0%
7 General Services 2,833.3 100.0%
Communications 850.0 30.0%
Public Services 240.8 8.5%
Repairs and Maintenance 651.7 23.0%
Fuel 198.3 7.0%
Rents 878.3 31.0%
Customs Expenditures 14.2 0.5%
8 Performance Contracts and Transfers 3,464.7 100.0%
Technical Consulting Services 1,524.5 44.0%
Support Services 737.3 21.3%
External Auditing 94.2 2.7%
Transfers to Third Parties 1,108.7 32.0%
9 Other Costs 835.3 100.0%
Insurance 576.4 69.0%
Official Hospitality 127.8 15.3%
Ceremonies and Awards 24.2 2.9%
Financial Expenses 104.4 12.5%
Others 2.5 0.3%
33,398.2 TOTAL
2011
Breakdown of Each Major Object of Expenditure 2010
Structure of the Major Objects of Expenditure. Regular Fund (US$ x 000 and %)
Table No. 8 2011
Staff Positions Financed by the Regular Fund
Program Budget1992 - 2011 Program Budgets
YEAR IPP LPP GSP TOTAL
1992 134 82 346 562 1993 134 79 344 557 1994 132 80 349 561 1995 132 81 312 525 1996 121 87 289 497 1997 117 95 285 497 1998 110 98 249 457 1999 103 101 247 451 2000 99 97 251 447 2001 99 97 251 447 2002 96 101 238 435 2003 93 120 221 434 2004 94 126 230 450 2005 94 126 230 450 2006 94 131 237 462 2007 94 131 227 452 2008 94 135 227 456 2009 94 135 227 456 2010 95 152 213 460 2011 93 157 213 463
Note: Does not include positions financed with external resources and INR resources IPP: International Professional Personnel
LPP: Local Professional Personnel GSP: General Services Personnel