SEVENTEENTH REGULAR MEETING OF THE IABA AND
MEETING OF MINISTERS OF AGRICULTURE OF THE AMERICAS 2013
2014-2015 PROGRAM BUDGET
Main document
Buenos Aires, Argentina
September 24-27, 2013
IICA/JIA/Doc. 362 (13)
Original: Español
2014-2015
Program
Budget
Inter-American
Institute for
Cooperation on
Agriculture
September 2013
Main Document
CONTENTS
I. Introduction ... 1
II. Strategic Guidelines for the 2014-2015 biennium ... 2
III. Overall Budget for the 2014-2015 biennium ... 3
IV. Technical Cooperation Services for 2014 ... 4
V. Allocation of Regular Fund resources for 2014 by Chapter ... 4
Chapter I: Direct Technical Cooperation Services ... 5
Chapter II: Management Costs ... 6
Chapter III: General Costs and Provisions... 6
Chapter IV: Renewal of Infrastructure and Equipment ... 7
VI. Allocation of Regular Fund Resources for 2014 by Technical Concentration Program ... 7
VII. Allocation of Regular Fund Resources for 2014 by Major Object of Expenditure ... 8
I.
INTRODUCTION
he present document contains the proposed Program Budget of the Inter-American Institute for Cooperation on Agriculture (IICA) for the period 2014-2015.
This proposal was presented to the Thirty-third Regular Meeting of the Executive Committee, held in Mexico City, Mexico, from June 17-18, 2013. At that meeting, the Committee adopted Resolution IICA/CE/Res. 569 (XXXIII-O/13), in which it recommended that the Inter-American Board of Agriculture (IABA) approve the Income Budget for 2014-2015 and the Expenditure Budget for 2014, as detailed in Document IICA/CE/Doc. 615 (13) “2014-2015 Program Budget.”
Since the current Medium-term Plan (MTP) covers the period 2010-2014, and a new period of administration begins in January 2014, IICA is presenting for approval the sources of financing for the Regular Fund for 2014 and 2015, and the Program Budget for Expenditures for 2014.
Furthermore, since implementation of a new MTP will begin in 2014, covering the period 2014-2018, the Budget for Expenditures for that year will need to be adjusted to the new MTP, once the latter has been approved, to facilitate its immediate implementation. Similarly, the Budget for Expenditures for 2015 will have to be approved based on the guidelines of the new MTP.
The proposed 2014-2015 Program Budget was prepared taking into consideration a number of criteria, including the importance of:
Ensuring that the Institute remains a viable technical cooperation instrument of the Member States, one that supports their efforts to achieve the sustainable development of agriculture, promote food security, and reduce poverty;
Strengthening the Institute’s financial capacity, as a means of enhancing the cooperation services it provides to its Member States;
Capitalizing properly on the major efforts made by the Institute to reduce operating costs, thereby increasing efficiency;
Coping efficiently with the fact that alternative sources of financing used in the past, such as recovery of quota arrears and miscellaneous income, no longer exist;
Continuing to promote the policy calling for an increase in the Institutional Net Rate (INR)1 used to cover the indirect costs generated in the administration of externally funded projects.
Making an additional effort to absorb the loss of value of the Regular Fund, given the freezing of Member State quotas and the drop in miscellaneous income; and,
Operating consistently in an environment in which no further measures for reorienting expenditure, reducing staff and making savings are possible, and it will be increasingly difficult to cover higher personnel costs, the revaluation of local currencies, and the rising prices of services, equipment, furnishings, vehicles, consultants, travel, insurance, etc.
Bases of the Program Budget:
1. Allocation of the quota contributions of the Member States applying the scale approved by the OAS for 2013, in General Assembly Resolution AG/RES. 2762(XLII-O/12) of 4 June 2012, and with the over-quotas approved in the 2013 Program Budget.
1
Approved by the Thirty-second Regular Meeting of the Executive Committee in 2012, by means of Resolution IICA/CE/Res. 556(XXXII-O/12) of 10 October 2012.
2. Maintenance of the amount of the Member State quotas at USD 27,810,000 and Miscellaneous Income at USD 6,100,000 per year, financed with USD 3,500,000 in income that is expected to be generated and USD 2,600,000 from the Miscellaneous Income Fund. 3. Estimated loss of 4.1% per year in the purchasing power of the Regular Fund, based on a
weighted average of the variations both in the price indexes of national currencies, and in the exchange rates of national currencies against the dollar, and in the breakdown of expenditure by currency.
4. The following measures are included in the proposal in order to be able to absorb the increase in the costs of the Regular Fund in 2014, estimated to be USD 1.4 million:
o Elimination of 6 International Personnel Positions Financed with the Regular Fund, four in Chapter I: Direct Technical Cooperation Services, and two in Chapter II: Management Costs.
o Elimination of 14 General Services Personnel positions.
o USD 592,600 reduction in operating costs (major objects of expenditure 3-9) o Adjustments with respect to the 2013 Program Budget:
Rationalization of international travel and greater use of electronic media (a decrease of 0.3% despite price increases)
Continued reduction in the cost of printed publications by replacing them with electronic publications, which, together with the savings in materials and inputs, makes for a total reduction of 6.9%.
Less investment in equipment and furnishings (reduction of 15.7%). Reduction in communication costs by making more and better use of
institutional networks (reduction of 14.7%). A 5.4% reduction in performance contracts.
II.
STRATEGIC GUIDELINES FOR THE 2014-2015 BIENNIUM
o complete the implementation of the 2010-2014 MTP, IICA will continue to focus its cooperation efforts on four Technical Concentration Programs and two Programs for Cross-cutting Coordination that dovetail with the Strategic Objectives; on the complementary work of the Center for Strategic Analysis for Agriculture, which supplies the programs with strategic information on sectoral issues; on the promotion and financing of projects for the countries; on the visiting professionals program; on the scholarship program; and on efficient administration, all of which strengthen IICA’s technical cooperation services.
The Technical Concentration Programs, which are institutional in nature, are as follows: Innovation for Productivity and Competitiveness
Agricultural Health and Food Safety Agribusiness and Commercialization Agriculture, Territories and Rural Well-being
3
The Programs for Cross-cutting Coordination are:These programs are implemented through IICA technical cooperation projects, which, in the case of the Offices in the Member States dovetail with the technical cooperation strategies agreed upon with the relevant national authorities.
Similarly, the way in which Corporate Services supports and complements technical cooperation activities marks a change in the culture of the administration that adds value to the projects and enhances the social contribution to the Member States.
III.
OVERALL BUDGET FOR THE 2014-2015 BIENNIUM
he Institute finances its technical cooperation activities, mandated by its Governing Bodies, with resources from the Regular Fund, which is made up of Member State quotas and miscellaneous income, basically obtained from financial yields, tax recovery, and the sale of assets and certain services. In addition, the Institute increases its technical cooperation actions by implementing externally funded programs and projects, under agreements signed with partners or counterparts. The management of external resources demands the time of additional technical and administrative personnel, increasing operating costs. These additional costs are covered by the Institutional Net Rate (INR) that counterparts agree to pay IICA.
It is estimated that external resources will amount to USD 150.0 million. The preliminarily calculation of income from the application of the INR in 2014 is USD 10.7 million.
The final amount of INR resources received is subject to the signing and execution of agreements for the implementation of externally funded programs and projects, and the amount of INR resources actually obtained under those agreements.
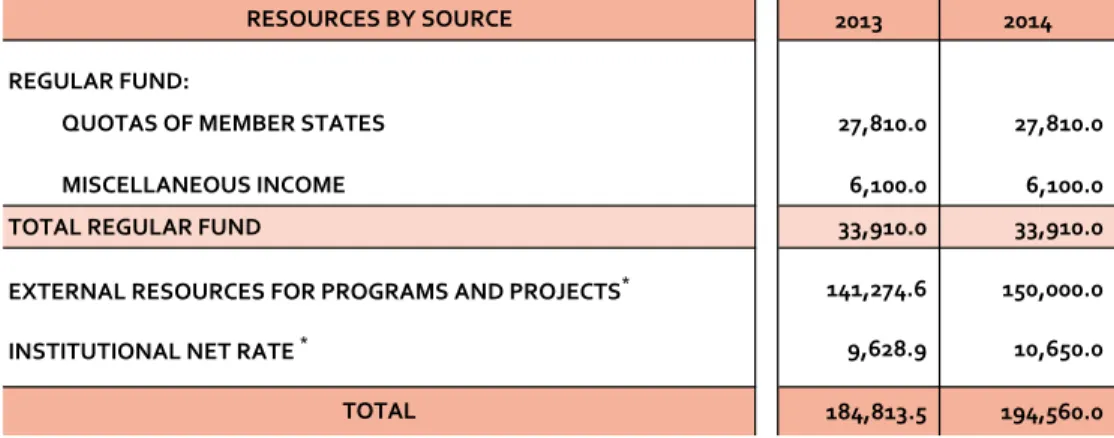
The Regular Fund budget amounts to USD 33,910.000 for 2014, made up of USD 27,810,000 in Member State quotas and USD 6,100,000 in miscellaneous income.
The Income Budget for 2014-2015 is the same in nominal values as the 2013 budget, as shown in
Table A.
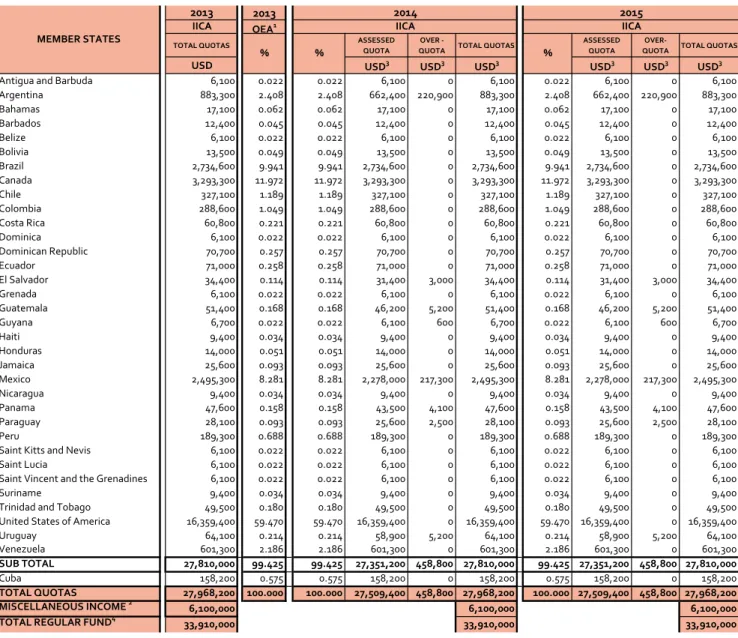
The Kingdom of Spain contributes an annual quota of USD 60,000 as an Associate Member, pursuant to an agreement adopted in the First Plenary Session of the Eleventh Regular Meeting of the Inter-American Board of Agriculture, held on November 26, 2001 in Bávaro, Dominican Republic.
Agriculture, Natural Resource Management and Climate Change Agriculture and Food Security
RESOURCES BY SOURCE 2013 2014 2014
MEMBER STATE QUOTAS 27,810.0 27,810.0 27,810.0 MISCELLANEOUS INCOME 6,100.0 6,100.0 6,100.0
TOTAL REGULAR FUND 33,910.0 33,910.0 33,910.0
Table A
Income Budget
2013 and 2014-2015 Program Budgets
(USD x 000)
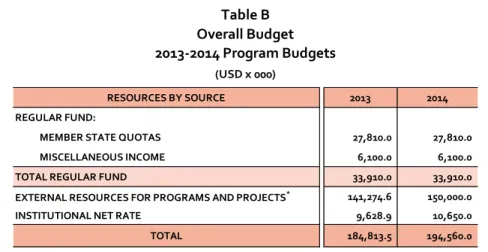
Table B shows the Overall Budget approved for 2013, and the one proposed for 2014.
Table 2, attached to this document, presents the percentage scale of the Member States’ quota
contributions in keeping with the distribution approved by the OAS, and the over-quota contributions of Argentina, El Salvador, Guatemala, Guyana, Mexico, Panama, Paraguay, and Uruguay.
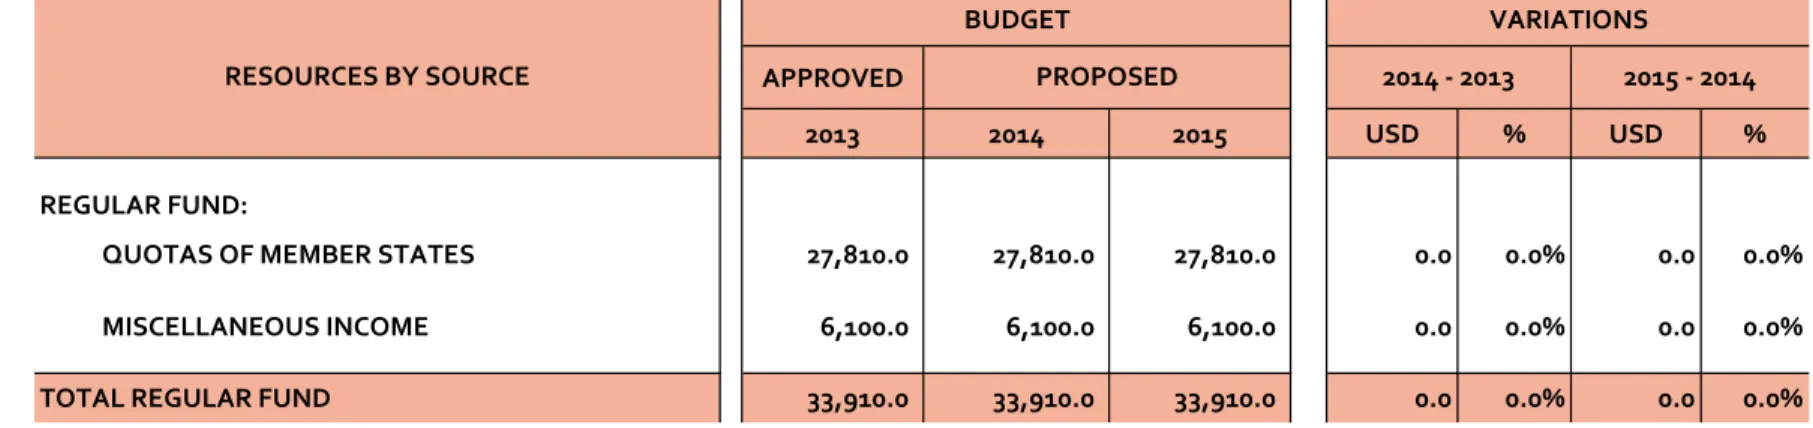
Table 3 shows the variations in the Budget for Income from the Regular Fund for 2013, 2014, and
2015.
Table 4 details the allocation of the Budget for Expenditures from the Regular Fund for 2014 by
Programming Center, in accordance with the guidelines of the 2010-2014 Medium-term Plan.
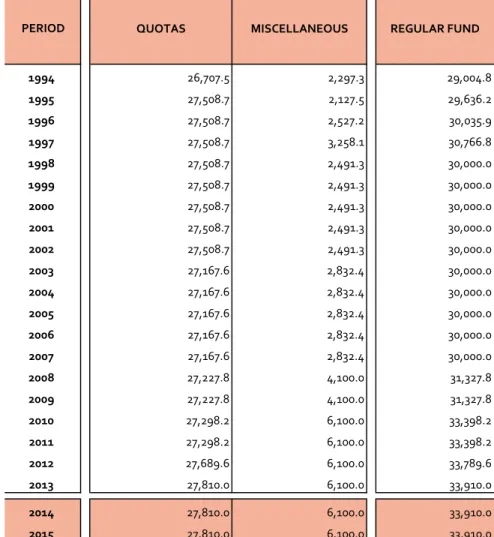
Table 5 summarizes the evolution of the Regular Fund budget since 1994 and the proposal for the
2014-2015 biennium, with the amounts indicated previously.
IV.
TECHNICAL COOPERATION SERVICES FOR 2014
esources are budgeted in accordance with the guidelines of the 2010-2014 Medium-term Plan, the Technical Cooperation Strategies agreed upon with the governments of the Member States, and IICA’s technical cooperation projects approved by the pertinent bodies of the General Directorate.
Appendix 1 presents the objectives, expected results, and achievement indicators of IICA’s projects
for the period covered by the Medium-term Plan (2010-2014), which will conclude in 2014, the year in which implementation of the 2014-2018 Medium-term Plan will get under way.
V.
ALLOCATION OF REGULAR FUND RESOURCES FOR 2014 BY CHAPTER
he Institute’s budget is divided into four Chapters: o I: Direct Technical Cooperation Services o II: Management Costs
o III: General Costs and Provisions
o IV: Renewal of Infrastructure and Equipment
2013 2014
REGULAR FUND:
MEMBER STATE QUOTAS 27,810.0 27,810.0 MISCELLANEOUS INCOME 6,100.0 6,100.0
TOTAL REGULAR FUND 33,910.0 33,910.0
EXTERNAL RESOURCES FOR PROGRAMS AND PROJECTS* 141,274.6 150,000.0
INSTITUTIONAL NET RATE 9,628.9 10,650.0 184,813.5
194,560.0 */ Estimates. Final figures will depend on the agreements signed and executed.
Table B Overall Budget 2013-2014 Program Budgets (USD x 000) RESOURCES BY SOURCE TOTAL
R
T
5
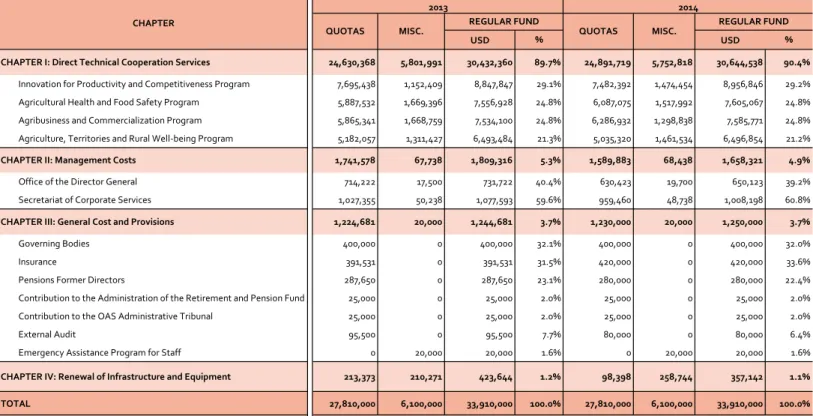
Figure 1 and Table 6 show the proposed allocation of Regular Fund resources by Chapter.CHAPTER I: DIRECT TECHNICAL COOPERATION SERVICES
This chapter includes the costs of the Institute’s technical cooperation actions at the national, regional, and hemispheric levels required to achieve the objectives defined in the Medium-term Plan. It includes IICA’s contribution to the Tropical Agriculture Research and Higher Education Center (CATIE) and the Caribbean Agricultural Research and Development Institute (CARDI), the financing of projects, the costs of the Center for Strategic Analysis for Agriculture (CAESPA), the Offices in the Member States, and the Technical Support Units. The resources allocated for this Chapter are as follows:
Table C
Chapter I: Direct Technical Cooperation Services Regular Fund (USD) Source 2013 2014 Quotas Miscellaneous 24,630,368 5,801,991 24,891,719 5,752,818 Total 30,432,360 30,644,538
The resources of the Regular Fund allocated to technical cooperation increased from 88.8% in 2011 to 89.3% in 2012, and 89.7% in 2013. The figure will rise to 90.4% in 2014. Thanks to improvements in the administration of the budget, it is possible to allocate more resources to direct technical cooperation services (See Table 6 for the years 2013 and 2014).
Does not include resources that the units and actions of this Chapter use for the renewal of infrastructure and equipment (Chapter IV).
CH. I: TECHNICAL COOPERATION COSTS USD 30.6 90.4% CH. II: MANAGEMENT COSTS USD 1.7 4.9% CH. III: GENERAL COSTS AND PROVISIONS USD 1.3 3.7% CH. IV: RENEWAL INFRASTRUCTURE AND EQUIPMENT USD 0.4 1.1% Figure 1
Distribution of the Regular Fund by Chapter 2014 (in millions of USD)
CHAPTER II: MANAGEMENT COSTS
Management Costs include the resources of the units responsible for managing the Institute and providing support services. Those units, which are located at Headquarters, are the Office of the Director General and the Secretariat of Corporate Services.
For the purposes of “Chapter II: Management Costs,” the Office of the Director General comprises the Office of the Director General, the Office of the Deputy Director General, the Coordination of the Office of the Director General, the Internal Audit Unit, the Legal Advisory Services Unit, and the Social Communication Unit.
Corporate Services includes the Office of the Secretary of Corporate Services and the services related to financial management, human talent, programming, budget, and general services. These resources also include Headquarters costs related to security, public utilities, janitorial services, transportation, procurement, the main switchboard, document processing, maintenance of buildings and grounds, among others.
The resources that these units use to renew their infrastructure and equipment are not included (Chapter IV).
The resources allocated to management costs decrease from 5.3% of the Regular Fund in 2013 to 4.9% in 2014. (See Table 6).
The resources allocated for this Chapter are:
Table D
Chapter II: Management Costs Regular Fund (USD) Source 2013 2014 Quotas 1,741,578 1,589,883 Miscellaneous 67,738 68,438 Total 1,809,316 1,658,321
CHAPTER III: GENERAL COSTS AND PROVISIONS
General costs and provisions are general commitments not directly related to the preceding chapters, or to a specific unit. They include funding for the Governing Bodies; institutional insurance; contribution to the administration of the OAS Administrative Tribunal and the OAS Retirement and Pension Fund; External Audit; pensions of former Directors General; and the Emergency Assistance Fund for Institute Personnel.
7
The resources for this chapter are:
Table E
Chapter III: General Costs and Provisions Regular Fund (USD) Source 2013 2014 Quotas 1,224,681 1,230,000 Miscellaneous 20,000 20,000 Total 1,244,681 1,250,000
The resources allocated to general costs and provisions account for 3.7% of the Regular Fund in both 2013 and 2014 (See Table 6).
CHAPTER IV: RENEWAL OF INFRASTRUCTURE AND EQUIPMENT
The budget items included in this Chapter are the conservation and maintenance of IICA-owned buildings and properties, and the renewal of vehicles, equipment, and software licenses, both at Headquarters and in the 34 Offices in the Member States.
Table F
Chapter IV: Renewal of Infrastructure and Equipment Regular Fund (USD) Source 2013 2014 Quotas 213,373 98,398 Miscellaneous 210,271 258,744 Total 423,644 357,142
The resources allocated to renew infrastructure and equipment decrease from 1.2% of the Regular Fund in 2013 to 1.1% in 2014. The austerity budget strategy has a major negative impact on this Chapter (See Table 6).
VI.
ALLOCATION OF REGULAR FUND RESOURCES FOR 2014 BY TECHNICAL
CONCENTRATION PROGRAM
or 2014, the Regular Fund resources corresponding to Chapter I: Direct Technical Cooperation Services are allocated to technical projects and actions under one or more of the Technical Concentration Programs (See Table 6).
Some 29.2% of the resources are allocated for actions related to the Innovation for Productivity and Competitiveness Program. The figure is 24.8% for both the Agricultural Health and Food Safety Program and the Agribusiness and Commercialization Program. Finally, the Agriculture, Territories and Rural Well-being Program will account for 21.2% of the resources in 2014.
VII.
ALLOCATION OF REGULAR FUND RESOURCES FOR 2014 BY MAJOR OBJECT OF
EXPENDITURE
he personnel and operating costs for 2014 financed with the Regular Fund are shown in Table
7: i) allocations by groups of objects of expenditure (International Professional Personnel, Local
Professional Personnel, General Services Personnel, and Operating Costs); ii) the number of personnel positions, by category and classification; and, iii) the sources of financing.
Table 8 details the items of which each major object of expenditure is composed, in monetary and
percentage terms, to make it easier to understand the purposes of each one.
Table 9 shows the absolute and relative variations in each of the Major Objects of Expenditure in
2013 and 2014.
Table 10 shows staff positions financed with resources from the Regular Fund between 1992 and
2014. The Institute plans to finance 6 fewer international professional positions than in the 2012-2013 biennium, maintain the same number of local professionals (151), and eliminate 14 general services positions (the number will fall from 208 in the 2012-2013 biennium to 194 in 2014).
These tables show:
The amount allocated to cover the costs of International Professional Personnel (82 positions), which falls from USD 11,802,843 in 2013 to USD 11,440,581 (-3.1%) in 2014, due to the combined effect of a 3.0% increase in the Salary Scale, variations in the classifications of some Specialists and Representatives in the Member States, and the elimination of 6 positions financed with the Regular Fund.
The total cost of Local Professional Personnel (151 positions) is USD 7,579,312 in 2013, rising to USD 7,685,088 (+1.4%) in 2014.
The cost of General Services Personnel (USD 3,916,580 in 2013) increases to USD 3,926,280 (+0.25%) in 2014, with 14 fewer positions (down from 208 to 194).
An average salary increase of 5.10% for local personnel is estimated for 2013, and 5.81% in 2014, which, combined with the variations in the exchange rate of the US dollar against the currencies of the other countries and the reduction in General Services Personnel (14 fewer positions), results in a 1.0% increase in costs in US dollars. The purpose of these measures is to try to maintain IICA’s current competitiveness in labor markets.
Operating costs total USD 10,610,665 in 2013 and USD 10,858,052 (+2.3%) in 2014, making it possible to halt the continuous fall in operating costs in recent years, as can be seen in
Figure 2, which also shows the evolution of personnel costs, whose growth will be curbed
by eliminating positions.
Table G, which corresponds to Table 9 in the attachment, presents the distribution of the Regular
Fund by Major Object of Expenditure (MOE) for 2014, and shows the distribution approved in the 2013 Program Budget, for comparative purposes.
9
USD x 000 % US$ x 000 %
1 International Professional Personnel 11,802.8 34.81% 11,440.6 33.74% 2 Local Professional and General Services Personnel 11,495.9 33.90% 11,611.4 34.24%
23,298.7 68.71% 23,051.9 67.98%
3 Training and Technical Events 1,171.0 3.45% 1,618.9 4.77% 4 Official Travel 1,234.9 3.64% 1,231.0 3.63% 5 Documents and Materials and Supplies 914.7 2.70% 851.7 2.51% 6 Plant, Equipment and Furniture 423.6 1.25% 357.1 1.05% 7 General Services 2,856.2 8.42% 2,922.4 8.62% 8 Performance Contracts and Transfers * 3,188.6 9.40% 3,014.8 8.89% 9 Other Costs 822.3 2.42% 862.2 2.54%
10,611.3 31.29% 10,858.1 32.02% 33,910.0 100.00% 33,910.0 100.00%
*/ Includes USD 1,000,000 to CATIE and USD 200,000 to CARDI.
Table G
Resources of the Regular Fund by Major Object of Expenditure
Major Object of Expenditure 2013 2014
SUBTOTAL PERSONNEL COSTS
SUBTOTAL OPERATING COSTS GRAND TOTAL (USD x 000) 10,000.0 12,000.0 14,000.0 16,000.0 18,000.0 20,000.0 22,000.0 24,000.0 2007 2008 2009 2010 2011 2012 2013 2014
Figure 2
Nominal Evolution Personnel and Operating Costs
Regular Fund Resources 2007-2014 Program Budgets
(In 000 of USD)
Figure 3 shows the relative weight of each major object of expenditure for 2013 and 2014.
The following conclusions can be drawn from the data in tables 7, 8, 9, and 10:
o Personnel costs decrease from 68.7% in 2013 to 68.0% in 2014, with a negative impact on the Institute’s technical capacity (the number of professionals falls from 239 in 2013 to 233 in 2014). The figure includes increases of 3% in the salary scale of the International Professional Personnel and an average of 5.81% in local currencies for local personnel.
o Operating costs increase from 31.3% in 2013 to 32.0% in 2014 (USD 246,800). The item that increases the most is related to the direct delivery of technical cooperation: Major Object of Expenditure (MOE) 3, Training and Technical Events (38.2%). The other items that increase in relative terms are MOE 7, General Services (2.3%), to cover the higher costs of public services, repairs and maintenance, fuel, and janitorial and security contracts; and, MOE 9, Other Costs, to cover increases in insurance and financial expenses.
o The operating expenses that decrease are MOE 4, Official Travel (-0.3%), in a context of higher costs and, as a result, the application of an austerity policy in relation to international travel established by the Director General, and more and better use of the Institute’s videoconferencing facilities; MOE 5, Documents, and Materials and Supplies (-6.9%), as a result of a strategy of giving priority to electronic publications and better use of the materials and supplies of the offices and projects; MOE 6, Plant, Equipment and Furniture (-15.7%), with restrictions on purchases of equipment and furniture posing a challenge for IICA, one that will have to be reviewed in 2015; and MOE 8, Performance Contracts (-5.4%).
his proposed 2014-2015 Program Budget provides the flexibility needed for the change of Medium-term Plan, the financial constraints of recent years, the permanent increase in personnel and operating costs, and the gradual loss of competitiveness in labor markets. In the present financial circumstances, the proposal provides a reasonable response to the technical cooperation priorities set by the Governing Bodies, based on criteria such as quality, effectiveness, rationality, equity, transparency, and accountability, as part of a policy based on results.
11
VIII.LIST OF TABLES ATTACHED
Table No. 1 Overall Budget. 2013 and 2014 Program Budgets (in thousands of US dollars)
Table No. 2 Quota Scale of the Member States, Contributions of Over-quotas, and Miscellaneous Income for 2014-2015 (USD)
Table No. 3 Budget for Income from the Regular Fund. 2013 and 2014-2015 Program Budgets (in thousands of US dollars)
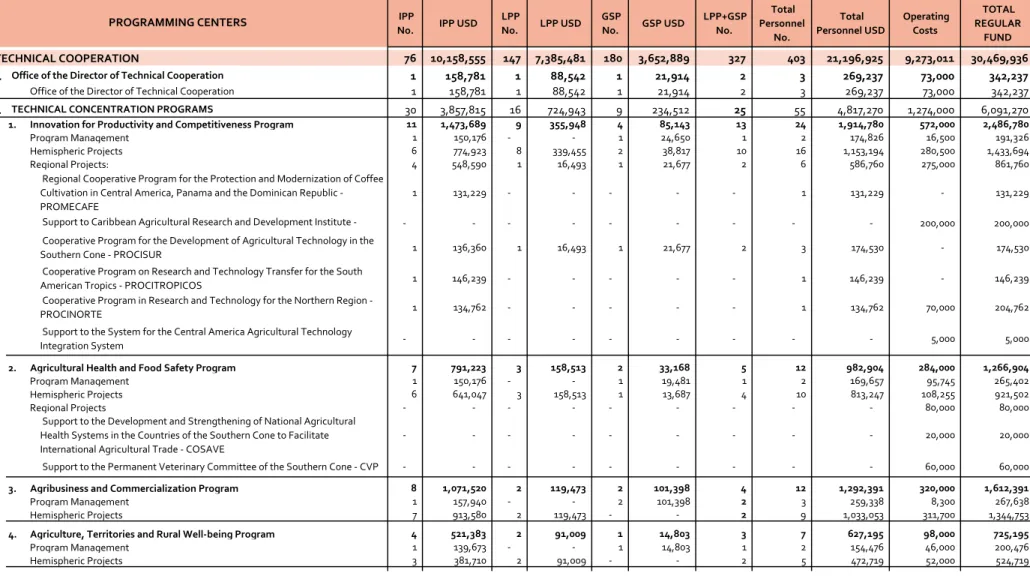
Table No. 4 Budget for Expenditure from the Regular Fund by Programming Center. 2014 (USD)
Table No. 5 Evolution of the Regular Fund in Nominal Values. 1994-2013 and 2014-2015 (in thousands of US dollars)
Table No. 6 Allocation of the Regular Fund by Chapter – 2013 and 2014 (USD)
Table No. 7 Overall Allocation of the Regular Fund: Quotas and Miscellaneous Income (USD and Number of Personnel Positions)
Table No. 8 Structure of the Budget for Expenditure from the Regular Fund by Major Object of Expenditure (in thousands of US dollars and %)
Table No. 9 Relative Weight and Evolution of Major Objects of Expenditure of the Regular Fund. 2013 and 2014 Program Budgets (in thousands of US dollars and %)
Table No. 1
2014 - 2015
Program Budget
2013 2014 REGULAR FUND:
QUOTAS OF MEMBER STATES 27,810.0 27,810.0 MISCELLANEOUS INCOME 6,100.0 6,100.0 TOTAL REGULAR FUND 33,910.0 33,910.0
EXTERNAL RESOURCES FOR PROGRAMS AND PROJECTS* 141,274.6 150,000.0
INSTITUTIONAL NET RATE * 9,628.9 10,650.0
184,813.5
194,560.0
*/ Estimates. Final figures will depend on the agreements signed and executed.
Overall Budget
2013 and 2014 Program Budgets
(USD x 000)
RESOURCES BY SOURCE
Table No. 2
2013
OEA1
TOTAL QUOTAS ASSESSED QUOTA
OVER -
QUOTA TOTAL QUOTAS
ASSESSED QUOTA
OVER-
QUOTA TOTAL QUOTAS
USD USD3 USD3 USD3 USD3 USD3 USD3
Antigua and Barbuda 6,100 0.022 0.022 6,100 0 6,100 0.022 6,100 0 6,100 Argentina 883,300 2.408 2.408 662,400 220,900 883,300 2.408 662,400 220,900 883,300 Bahamas 17,100 0.062 0.062 17,100 0 17,100 0.062 17,100 0 17,100 Barbados 12,400 0.045 0.045 12,400 0 12,400 0.045 12,400 0 12,400 Belize 6,100 0.022 0.022 6,100 0 6,100 0.022 6,100 0 6,100 Bolivia 13,500 0.049 0.049 13,500 0 13,500 0.049 13,500 0 13,500 Brazil 2,734,600 9.941 9.941 2,734,600 0 2,734,600 9.941 2,734,600 0 2,734,600 Canada 3,293,300 11.972 11.972 3,293,300 0 3,293,300 11.972 3,293,300 0 3,293,300 Chile 327,100 1.189 1.189 327,100 0 327,100 1.189 327,100 0 327,100 Colombia 288,600 1.049 1.049 288,600 0 288,600 1.049 288,600 0 288,600 Costa Rica 60,800 0.221 0.221 60,800 0 60,800 0.221 60,800 0 60,800 Dominica 6,100 0.022 0.022 6,100 0 6,100 0.022 6,100 0 6,100 Dominican Republic 70,700 0.257 0.257 70,700 0 70,700 0.257 70,700 0 70,700 Ecuador 71,000 0.258 0.258 71,000 0 71,000 0.258 71,000 0 71,000 El Salvador 34,400 0.114 0.114 31,400 3,000 34,400 0.114 31,400 3,000 34,400 Grenada 6,100 0.022 0.022 6,100 0 6,100 0.022 6,100 0 6,100 Guatemala 51,400 0.168 0.168 46,200 5,200 51,400 0.168 46,200 5,200 51,400 Guyana 6,700 0.022 0.022 6,100 600 6,700 0.022 6,100 600 6,700 Haiti 9,400 0.034 0.034 9,400 0 9,400 0.034 9,400 0 9,400 Honduras 14,000 0.051 0.051 14,000 0 14,000 0.051 14,000 0 14,000 Jamaica 25,600 0.093 0.093 25,600 0 25,600 0.093 25,600 0 25,600 Mexico 2,495,300 8.281 8.281 2,278,000 217,300 2,495,300 8.281 2,278,000 217,300 2,495,300 Nicaragua 9,400 0.034 0.034 9,400 0 9,400 0.034 9,400 0 9,400 Panama 47,600 0.158 0.158 43,500 4,100 47,600 0.158 43,500 4,100 47,600 Paraguay 28,100 0.093 0.093 25,600 2,500 28,100 0.093 25,600 2,500 28,100 Peru 189,300 0.688 0.688 189,300 0 189,300 0.688 189,300 0 189,300 Saint Kitts and Nevis 6,100 0.022 0.022 6,100 0 6,100 0.022 6,100 0 6,100 Saint Lucia 6,100 0.022 0.022 6,100 0 6,100 0.022 6,100 0 6,100 Saint Vincent and the Grenadines 6,100 0.022 0.022 6,100 0 6,100 0.022 6,100 0 6,100 Suriname 9,400 0.034 0.034 9,400 0 9,400 0.034 9,400 0 9,400 Trinidad and Tobago 49,500 0.180 0.180 49,500 0 49,500 0.180 49,500 0 49,500 United States of America 16,359,400 59.470 59.470 16,359,400 0 16,359,400 59.470 16,359,400 0 16,359,400 Uruguay 64,100 0.214 0.214 58,900 5,200 64,100 0.214 58,900 5,200 64,100 Venezuela 601,300 2.186 2.186 601,300 0 601,300 2.186 601,300 0 601,300 SUB TOTAL 27,810,000 99.425 99.425 27,351,200 458,800 27,810,000 99.425 27,351,200 458,800 27,810,000 Cuba 158,200 0.575 0.575 158,200 0 158,200 0.575 158,200 0 158,200 TOTAL QUOTAS 27,968,200 100.000 100.000 27,509,400 458,800 27,968,200 100.000 27,509,400 458,800 27,968,200 MISCELLANEOUS INCOME 2 6,100,000 6,100,000 6,100,000
TOTAL REGULAR FUND4
33,910,000 33,910,000 33,910,000
2014-2015 Programa Budget
Quota Scales of the Member States, Contributions of Over-quotas, and Miscellaneous Income for 2014-2015 (USD)
MEMBER STATES
2013 2014 2015
Notes: 1) The Kingdom of Spain contributes and annual quota of USD 60,000 as an Associate State, as per an agreement reached in the First Plenary Session of the Eleventh Regular Meeting of the Inter-American Board of Agriculture, held on November 26, 2001, in Bávaro, Dominican Republic; 2) The 2013 quotas
IICA IICA IICA
Table No. 3
2014 - 2015
Program Budget
APPROVED
2013 2014 2015 USD % USD %
REGULAR FUND:
QUOTAS OF MEMBER STATES 27,810.0 27,810.0 27,810.0 0.0 0.0% 0.0 0.0% MISCELLANEOUS INCOME 6,100.0 6,100.0 6,100.0 0.0 0.0% 0.0 0.0% TOTAL REGULAR FUND 33,910.0 33,910.0 33,910.0 0.0 0.0% 0.0 0.0%
PROPOSED 2014 - 2013 2015 - 2014 RESOURCES BY SOURCE
Budget for Income from Regular Fund
2013 and 2014 - 2015 Program Budgets
(USD x 000)
Table No. 4
Program Budget
IPP
No. IPP USD LPP No. LPP USD GSP No. GSP USD LPP+GSP No. Total Personnel No. Total Personnel USD Operating Costs TOTAL REGULAR FUND I. TECHNICAL COOPERATION 76 10,158,555 147 7,385,481 180 3,652,889 327 403 21,196,925 9,273,011 30,469,936 A. Office of the Director of Technical Cooperation 1 158,781 1 88,542 1 21,914 2 3 269,237 73,000 342,237
Office of the Director of Technical Cooperation 1 158,781 1 88,542 1 21,914 2 3 269,237 73,000 342,237
B. TECHNICAL CONCENTRATION PROGRAMS 30 3,857,815 16 724,943 9 234,512 25 55 4,817,270 1,274,000 6,091,270 1. Innovation for Productivity and Competitiveness Program 11 1,473,689 9 355,948 4 85,143 13 24 1,914,780 572,000 2,486,780
Program Management 1 150,176 - - 1 24,650 1 2 174,826 16,500 191,326 Hemispheric Projects 6 774,923 8 339,455 2 38,817 10 16 1,153,194 280,500 1,433,694 Regional Projects: 4 548,590 1 16,493 1 21,677 2 6 586,760 275,000 861,760
Regional Cooperative Program for the Protection and Modernization of Coffee Cultivation in Central America, Panama and the Dominican Republic - PROMECAFE
1
131,229 - - - - - 1 131,229 - 131,229 Support to Caribbean Agricultural Research and Development Institute - - - - - - - - - - 200,000 200,000 Cooperative Program for the Development of Agricultural Technology in the
Southern Cone - PROCISUR 1 136,360 1 16,493 1 21,677 2 3 174,530 - 174,530 Cooperative Program on Research and Technology Transfer for the South
American Tropics - PROCITROPICOS 1 146,239 - - - - - 1 146,239 - 146,239 Cooperative Program in Research and Technology for the Northern Region -
PROCINORTE 1 134,762 - - - - - 1 134,762 70,000 204,762 Support to the System for the Central America Agricultural Technology
Integration System - - - - - - - - - 5,000 5,000
2. Agricultural Health and Food Safety Program 7 791,223 3 158,513 2 33,168 5 12 982,904 284,000 1,266,904
Program Management 1 150,176 - - 1 19,481 1 2 169,657 95,745 265,402 Hemispheric Projects 6 641,047 3 158,513 1 13,687 4 10 813,247 108,255 921,502 Regional Projects - - - - - - - - - 80,000 80,000
Support to the Development and Strengthening of National Agricultural Health Systems in the Countries of the Southern Cone to Facilitate International Agricultural Trade - COSAVE
- - - - - - - - 20,000 20,000
Support to the Permanent Veterinary Committee of the Southern Cone - CVP - - - - - - - - - 60,000 60,000
3. Agribusiness and Commercialization Program 8 1,071,520 2 119,473 2 101,398 4 12 1,292,391 320,000 1,612,391
Program Management 1 157,940 - - 2 101,398 2 3 259,338 8,300 267,638 Hemispheric Projects 7 913,580 2 119,473 - - 2 9 1,033,053 311,700 1,344,753
4. Agriculture, Territories and Rural Well-being Program 4 521,383 2 91,009 1 14,803 3 7 627,195 98,000 725,195
Program Management 1 139,673 - - 1 14,803 1 2 154,476 46,000 200,476 Hemispheric Projects 3 381,710 2 91,009 - - 2 5 472,719 52,000 524,719
2014
Budget for Expenditure from the Regular Fund by Programming Center
2014 - USD
Page 2 of 3 IPP
No. IPP USD LPP No. LPP USD GSP No. GSP USD LPP+GSP No. Total Personnel No. Total Personnel USD Operating Costs TOTAL REGULAR FUND PROGRAMMING CENTERS
C. PROGRAMS FOR CROSS-COORDINATION 2 292,845 4 183,315 1 16,991 5 7 493,151 74,000 567,151
1. Agriculture and Food Security 1 150,176 1 44,598 1 16,991 2 3 211,766 30,000 241,766 2. Agriculture, Natural Resource Management and Climate Change 1 142,669 3 138,716 - - 3 4 281,385 44,000 325,385
D. 4 520,143 7 365,710 2 29,034 9 13 914,887 150,539 1,065,426
Management - - - - - - - - - 7,600 7,600 Hemispheric Projects 4 520,143 7 365,710 2 29,034 9 13 914,887 142,939 1,057,826
E. TECHNICAL COOPERATION SUPPORT UNITS 5 664,732 14 690,664 4 87,229 18 23 1,442,624 195,000 1,637,624
1. Project Unit 5 664,732 1 34,542 - - 1 6 699,274 60,000 759,274 Hemispheric Component 2 261,679 1 34,542 - - 1 3 296,221 20,000 316,221 Regional Component 3 403,053 - - - - - 3 403,053 40,000 443,053
2. Inter-American Center for Information and Editorial Production - - 7 301,084 2 40,462 9 9 341,546 40,000 381,546
3. Information and Communication Technologies - - 1 72,775 1 21,150 2 2 93,926 70,000 163,926
4. Center for the Promotion of Technical Capacities and Leadership - - 5 282,262 1 25,616 6 6 307,879 25,000 332,879
F. 30 4,084,336 98 4,997,127 158 3,151,418 256 286 12,232,882 5,114,172 17,347,054 1. Belize 1 126,143 2 89,060 2 38,306 4 5 253,509 70,464 323,973 2. Costa Rica 1 141,620 4 177,390 6 105,517 10 11 424,527 106,782 531,309 3. Guatemala 1 140,626 2 136,206 5 62,112 7 8 338,944 126,923 465,867 4. Honduras 1 141,420 3 139,885 5 46,024 8 9 327,329 121,918 449,247 5. Nicaragua 1 123,157 3 76,124 3 25,822 6 7 225,103 186,379 411,482 6. Panama 1 132,125 3 139,538 4 75,131 7 8 346,794 105,602 452,396 7. El Salvador 1 139,703 3 129,515 6 95,842 9 10 365,060 46,376 411,436 8. Barbados 1 129,254 2 86,024 5 129,924 7 8 345,202 103,814 449,016 9. ECS 1 130,323 6 347,795 10 265,607 16 17 743,725 163,973 907,698 10. Guyana 1 123,757 2 70,919 9 85,223 11 12 279,899 123,919 403,818 11. Haiti 1 150,189 2 80,756 6 96,749 8 9 327,694 170,031 497,725 12. Jamaica 1 131,142 2 101,198 8 124,168 10 11 356,508 139,270 495,778 13. Bahamas 1 126,352 1 37,281 2 53,692 3 4 217,324 68,950 286,274 14. Dominican Republic 1 131,446 5 172,397 8 111,501 13 14 415,344 154,806 570,150 15. Suriname 1 131,182 2 51,049 4 43,683 6 7 225,915 129,965 355,880
16. Trinidad and Tobago 1 132,744 2 101,064 6 148,974 8 9 382,782 162,658 545,440
17. Bolivia 1 133,991 5 228,442 6 93,565 11 12 455,998 89,250 545,248 18. Colombia 1 149,978 1 63,075 8 164,062 9 10 377,115 155,000 532,115 19. Ecuador 1 141,025 5 211,245 7 111,249 12 13 463,519 179,601 643,120 20. Peru 1 149,686 4 219,576 8 176,702 12 13 545,965 132,394 678,359 21. Venezuela 1 161,518 4 230,409 7 135,905 11 12 527,832 110,927 638,759 22. Argentina 1 140,025 7 504,555 7 198,082 14 15 842,662 214,117 1,056,779 23. Brazil 1 171,169 11 803,415 2 85,705 13 14 1,060,289 1,050,242 2,110,531 24. Chile 1 146,160 4 206,528 6 134,428 10 11 487,116 98,873 585,989 25. Paraguay 1 136,555 5 215,354 4 60,183 9 10 412,092 81,090 493,182 26. Uruguay 1 145,460 5 178,666 4 111,600 9 10 435,726 89,705 525,431 27. Canada 1 139,506 - - 2 93,608 2 3 233,114 359,055 592,169
CENTER FOR STRATEGIC ANALYSIS FOR AGRICULTURE
NATIONAL COMPONENT OF TECHNICAL COOPERATION: OFFICES IN THE MEMBER STATES
IPP
No. IPP USD LPP No. LPP USD GSP No. GSP USD LPP+GSP No. Total Personnel No. Total Personnel USD Operating Costs TOTAL REGULAR FUND PROGRAMMING CENTERS
28. United States of America 2 207,427 - - 3 160,900 3 5 368,327 289,900 658,227
29. Mexico 1 130,653 3 199,661 5 117,155 8 9 447,470 282,188 729,658
G. SUPPORT FOR INTEGRATION PROJECTS 3 458,530 6 270,461 4 84,252 10 13 213,630 259,200 472,830
1. Support to Central American Agricultural Council - CAC 1 121,373 - - 1 27,538 1 2 148,911 - 148,911
2. Support to Alliance for Sustainable Development in the Caribbean - - - - - - - - - 100,000 100,000
3. Support to CARICOM - - 1 64,719 - - 1 1 64,719 15,000 79,719
4. Support to the Secretariat of the Agricultural Council of the South - CAS and to
the Agricultural Policy Coordination Network of the South - REDPA - - - - - - - - - 119,200 119,200
5. Support to the Tri-National Council of the Northern Region - - - - - - - - - 25,000 25,000
H. TECHNICAL SUPPORT UNITS AND ACTIONS 3 458,530 6 270,461 4 84,252 10 13 813,243 153,500 966,743
1. Directorate of Management and Regional Integration * 2 302,419 2 75,241 2 43,798 4 6 421,458 65,000 486,458
2. Secretariat of Planning and Evaluation 1 156,111 3 144,089 1 21,723 4 5 321,923 35,000 356,923
3. Language Services Unit - - 1 51,131 1 18,732 2 2 69,863 3,500 73,363
4. Strenghtening of Technical Capabilities - - - - - - - - - 50,000 50,000
I. LINE/ITEM FOR TECHNICAL COOPERATION PROJECTS - - - - - - - - - 979,600 979,600
Line/Item for Technical Cooperation Projects - - - - - - - - - 979,600 979,600
J. CONTRIBUTION TO CATIE - - - - - - - - - 1,000,000 1,000,000
Contribution to CATIE - - - - - - - - - 1,000,000 1,000,000
II. MANAGEMENT UNITS 6 977,026 4 189,607 14 263,391 18 24 1,430,024 232,655 1,662,679
A. Office of the Director General (Chapter II) 3 520,622 - - 1 35,084 1 4 555,706 94,717 650,423 B. Secretariat of Corporate Services (Chapter II) 3 456,404 4 189,607 13 228,307 17 20 874,318 137,938 1,012,256
III. CORPORATE ACTIVITIES - 305,000 - 110,000 - 10,000 - - 425,000 1,352,386 1,777,386
1. Stabilization for loss of purchasing of USD, Funding Cycles for Projects and
Preinvestment - - - 100,000 - - - - 100,000 207,386 307,386
2. Renewal of Equipment and Vehicles - - - - - - - - - 220,000 220,000
3. Governing Bodies - - - - - - - - - 400,000 400,000
4. Insurance - - - - - - - - - 420,000 420,000
5. Pensions Former Directors - 280,000 - - - - - - 280,000 - 280,000
6. Contribution to the Administration of the Retirement and Pension Fund - 25,000 - - - - - - 25,000 - 25,000
7. Contribution to the OAS Administrative Tribunal - - - - - - - - - 25,000 25,000
8. External Audit - - - - - - - - - 80,000 80,000
9. Emergency Assistance Program for Staff - - - 10,000 - 10,000 - - 20,000 - 20,000
82
11,440,581 151 7,685,088 194 3,926,280 345 427 23,051,949 10,858,052 33,910,000
*/ The Permanent Office for Europe is funded with USD 100,000 in INR resources per year.
1994 26,707.5 2,297.3 29,004.8 1995 27,508.7 2,127.5 29,636.2 1996 27,508.7 2,527.2 30,035.9 1997 27,508.7 3,258.1 30,766.8 1998 27,508.7 2,491.3 30,000.0 1999 27,508.7 2,491.3 30,000.0 2000 27,508.7 2,491.3 30,000.0 2001 27,508.7 2,491.3 30,000.0 2002 27,508.7 2,491.3 30,000.0 2003 27,167.6 2,832.4 30,000.0 2004 27,167.6 2,832.4 30,000.0 2005 27,167.6 2,832.4 30,000.0 2006 27,167.6 2,832.4 30,000.0 2007 27,167.6 2,832.4 30,000.0 2008 27,227.8 4,100.0 31,327.8 2009 27,227.8 4,100.0 31,327.8 2010 27,298.2 6,100.0 33,398.2 2011 27,298.2 6,100.0 33,398.2 2012 27,689.6 6,100.0 33,789.6 2013 27,810.0 6,100.0 33,910.0 2014 27,810.0 6,100.0 33,910.0 2015 27,810.0 6,100.0 33,910.0
Note: The Cuban quota was excluded from the quota resources as of 2003.
Table No. 5
2014-2015
Program Budget
PERIOD QUOTAS MISCELLANEOUS REGULAR FUND
Evolution of the Regular Fund in Nominal Values
1994-2013 and 2014-2015 (USD x 000)
Table No. 6
Program Budget
USD USD
CHAPTER I: Direct Technical Cooperation Services 24,630,368 5,801,991 30,432,360 89.7% 24,891,719 5,752,818 30,644,538 90.4%
Innovation for Productivity and Competitiveness Program 7,695,438 1,152,409 8,847,847 29.1% 7,482,392 1,474,454 8,956,846 29.2% Agricultural Health and Food Safety Program 5,887,532 1,669,396 7,556,928 24.8% 6,087,075 1,517,992 7,605,067 24.8% Agribusiness and Commercialization Program 5,865,341 1,668,759 7,534,100 24.8% 6,286,932 1,298,838 7,585,771 24.8% Agriculture, Territories and Rural Well-being Program 5,182,057 1,311,427 6,493,484 21.3% 5,035,320 1,461,534 6,496,854 21.2%
CHAPTER II: Management Costs 1,741,578 67,738 1,809,316 5.3% 1,589,883 68,438 1,658,321 4.9%
Office of the Director General 714,222 17,500 731,722 40.4% 630,423 19,700 650,123 39.2%
Secretariat of Corporate Services 1,027,355 50,238 1,077,593 59.6% 959,460 48,738 1,008,198 60.8%
CHAPTER III: General Cost and Provisions 1,224,681 20,000 1,244,681 3.7% 1,230,000 20,000 1,250,000 3.7%
Governing Bodies 400,000 0 400,000 32.1% 400,000 0 400,000 32.0%
Insurance 391,531 0 391,531 31.5% 420,000 0 420,000 33.6%
Pensions Former Directors 287,650 0 287,650 23.1% 280,000 0 280,000 22.4%
Contribution to the Administration of the Retirement and Pension Fund 25,000 0 25,000 2.0% 25,000 0 25,000 2.0%
Contribution to the OAS Administrative Tribunal 25,000 0 25,000 2.0% 25,000 0 25,000 2.0%
External Audit 95,500 0 95,500 7.7% 80,000 0 80,000 6.4%
Emergency Assistance Program for Staff 0 20,000 20,000 1.6% 0 20,000 20,000 1.6%
CHAPTER IV: Renewal of Infrastructure and Equipment 213,373 210,271 423,644 1.2% 98,398 258,744 357,142 1.1% TOTAL 27,810,000 6,100,000 33,910,000 100.0% 27,810,000 6,100,000 33,910,000 100.0%
Allocation of the Regular Fund by Chapter - 2013 and 2014
(USD)
2014
MISC. REGULAR FUND
% %
MISC. REGULAR FUND QUOTAS CHAPTER
2013 2014
Table No. 7
2014
Program Budget
USD % Class 2014 Class 2014
International Professional Personnel (IPP) 11,440,581 33.7% DG 1 PL5 9
Local Professional Personnel (LPP) 7,685,088 22.7% SDG 1 PL4 36
General Services Personnel (GSP) 3,926,280 11.6% D2 13 PL3 65
Operating Costs (MOE 3 to 9) 10,858,052 32.0% D1 2 PL2 28
Total 33,910,000 100.0% P6 11 PL1 13 P5 54 Total 151 P4 0 P3 0 Class 2014 P2 0 G10 0 P1 0 G9 1 Total 82 G8 10 G7 51 USD % G6 49
Quota Resources 27,810,000 82.0% Total 345 G5 24
Miscellaneous Resources 6,100,000 18.0% G4 29
G3 16
Total 33,910,000 100.0% G2 10
G1 4
Total 194
Overall Allocation of the Regular Fund: Quotas and Miscellaneous Income
(USD and Number of Personnel Positions)
Number of Positions
Summary by Object of Expenditure 2014 Summary IPP Summary LPP
Summary GSP
Source of Funds 2014
Table No. 8
Program Budget
1 International Professional Personnel 11,440.6 100.0%
Salaries 5,148.3 45.0%
Benefits and Other Costs of International Personnel 6,292.3 55.0%
2 Local Professional and General Services Personnel 11,611.4 100.0%
Salaries 8,128.0 70.0%
Benefits and Other Costs of National Personnel 3,483.4 30.0%
3 Training and Technical Events 1,618.9 100.0%
Training for Personnel 97.1 6.0% Technical Events 1,457.0 90.0% Didactic Material 64.8 4.0%
4 Official Travel 1,231.0 100.0%
International Per Diems 640.1 52.0% International Transportation 455.5 37.0% National Per Diems 86.2 7.0% National Transportation 49.2 4.0%
5 Documents and Materials and Supplies 851.7 100.0%
Publications and Documents 264.0 31.0% Office Materials and Supplies 545.1 64.0% Materials for IICA Projects 42.6 5.0%
6 Plant, Equipment and Furniture 357.1 100.0%
Improvements to Land, Buildings and Immoveable Assets 17.9 5.0% Acquisition of Equipment and Furnishings 160.7 45.0% Acquisition of Vehicles 178.6 50.0%
7 General Services 2,922.4 100.0%
Communications 584.5 20.0% Public Services 204.6 7.0% Repairs and Maintenance 935.2 32.0%
Fuel 190.0 6.5%
Rents 803.7 27.5%
Guard and Janitorial Contracts 204.6 7.0%
8 Performance Contracts and Transfers 3,014.8 100.0%
International Technical Consulting Services 241.2 8.0% National Technical Consulting Services 1,025.0 34.0% Support Services 572.8 19.0% External Auditing 75.4 2.5% Transfers to Third Parties 1,100.4 36.5%
9 Other Costs 862.2 100.0%
Insurance 629.4 73.0%
Official Hospitality 77.6 9.0% Ceremonies and Awards 17.2 2.0% Financial Expenses 120.7 14.0%
2014
Structure of the Major Objects of Expenditure of the Regular Fund
(USD x 000 and %)
Table No. 9
USD x 000 % USD x 000 % USD x 000 %
1 International Professional Personnel 11,802.8 34.8% 11,440.6 33.7% -362.3 -3.1%
2 Local Professional and General Services Personnel 11,495.9 33.9% 11,611.4 34.2% 115.5 1.0%
23,298.7 68.7% 23,051.9 68.0% -246.8 -1.1%
3 Training and Technical Events 1,171.0 3.5% 1,618.9 4.8% 447.9 38.2%
4 Official Travel 1,234.9 3.6% 1,231.0 3.6% -3.9 -0.3%
5 Documents and Materials and Supplies 914.7 2.7% 851.7 2.5% -63.0 -6.9%
6 Plant, Equipment and Furniture 423.6 1.2% 357.1 1.1% -66.5 -15.7%
7 General Services 2,856.2 8.4% 2,922.4 8.6% 66.2 2.3%
8 Performance Contracts and Transfers 3,188.6 9.4% 3,014.8 8.9% -173.8 -5.4%
9 Other Costs 822.3 2.4% 862.2 2.5% 39.9 4.9%
10,611.3 31.3% 10,858.1 32.0% 246.8 2.3% 33,910.0 100.0% 33,910.0 100.0% (0.0) 0.0% SUBTOTAL PERSONNEL COSTS
SUBTOTAL OPERATING COSTS GRAND TOTAL
Major Object of Expenditure 2013 2014 2014-2013
VARIATIONS
2014
Program Budget
Relative Weight and Evolution of the Major Objects of Expenditure of the Regular Fund
2013 and 2014 Program Budgets
(USD x 000 and %)
Table No. 10
1992 - 2014 Program Budgets
YEAR IPP LPP GSP TOTAL
1992 134 82 346 562 1993 134 79 344 557 1994 132 80 349 561 1995 132 81 312 525 1996 121 87 289 497 1997 117 95 285 497 1998 110 98 249 457 1999 103 101 247 451 2000 99 97 251 447 2001 99 97 251 447 2002 96 101 238 435 2003 93 120 221 434 2004 94 126 230 450 2005 94 126 230 450 2006 94 131 237 462 2007 94 131 227 452 2008 94 135 227 456 2009 94 135 227 456 2010 95 152 213 460 2011 93 157 213 463 2012 88 151 208 447 2013 88 151 208 447 2014 82 151 194 427
IPP: International Professional Personnel LPP: Local Professional Personnel