HAL Id: hal-01847798
https://hal.archives-ouvertes.fr/hal-01847798
Submitted on 11 Jan 2019
HAL is a multi-disciplinary open access
archive for the deposit and dissemination of
sci-entific research documents, whether they are
pub-lished or not. The documents may come from
teaching and research institutions in France or
abroad, or from public or private research centers.
L’archive ouverte pluridisciplinaire HAL, est
destinée au dépôt et à la diffusion de documents
scientifiques de niveau recherche, publiés ou non,
émanant des établissements d’enseignement et de
recherche français ou étrangers, des laboratoires
publics ou privés.
Modelling of the thermokinetic behaviour and the
phases transitions of a carbon/polymeric composite
submitted to high heating rate ramps
Christophe Paris, Philippe Olivier, Gérard Bernhart
To cite this version:
Christophe Paris, Philippe Olivier, Gérard Bernhart. Modelling of the thermokinetic behaviour and
the phases transitions of a carbon/polymeric composite submitted to high heating rate ramps.
Inter-national Journal of Material Forming, Springer Verlag, 2010, 3 (Suppl. 1), p.639-642.
�10.1007/s12289-010-0851-8�. �hal-01847798�
____________________
* Christophe PARIS
ICA, Ecole des Mines d’Albi Carmaux, Campus Jarlard, Route de Teillet, 81013 ALBI CEDEX 09 - France Phone: +33 – 5 63 49 31 10
MODELLING OF THE THERMOKINETIC BEHAVIOUR AND THE
PHASES TRANSITIONS OF A CARBON/POLYMERIC COMPOSITE
SUBMITTED TO HIGH HEATING RATE RAMPS
C. Paris
1,2*, P.A. Olivier
1, G. Bernhart
2(1) Université de Toulouse ; INSA, UPS, Mines Albi, ISAE; ICA (Institut Clément Ader),133C
Avenue de Rangueil, B.P. 67701, F-31077 Toulouse – France – philippe.olivier@iut-tlse3.fr
URL: http://www.institut-clement-ader.fr/
(2) Ecole des Mines Albi - Campus Jarlard, Route de Teillet - 81013 ALBI CEDEX 09 – France –
christophe.paris@mines-albi.fr, gerard.bernhart@mines-albi.fr
URL: http://www.institut-clement-ader.fr/
ABSTRACT: Our on-going work focuses on curing time reduction owing to the Roctool Cage System® on
aeronautical prepregs. Our very first aim is thus to define the limits of this process in order to get the shortest cure cycles (objective function) while respecting some constrained functions such as: no degradation of the polymeric matrix and final degree of cure a and Tg at least equal to those obtained on the autoclave-cured material according to the cure
cycle recommended by the prepreg manufacturer. The prepreg investigated here is the Hexply M21/35%/268/T700GC carbon/polymeric matrix produced by Hexcel Composites France. The presence of thermoplastics enhances the risk of
matrix degradation during curing. Effectively, in these kinds of polymers blends (when thermoplastic content > 10 wt %) phase separation may occur and modify the reaction rates. Beside the determination of the prepreg cure kinetics (studied by DSC), a Time Temperature Transformation diagram was settled. Consequently, the M21 matrix degradation was studied from room temperature up to 600 °C by TGA for heating rates ranging from 1 up to 100°C/min.
KEYWORDS: Carbon/epoxy prepreg, out of autoclave process, quick cure, kinetic caracterization, Time Temperature
Transformation diagrams
1 INTRODUCTION
When manufacturing composite structures (carbon fibres reinforced polymeric matrix) careful attention must be paid to processing parameters. Those later must be selected to ensure that both quality and costs are acceptable. Until now autoclave curing remains the mainstay method for processing high-quality laminates in aerospace industry, depending on temperature and pressure control during the curing step. In the autoclave manufacturing process, the main cost drivers can be easily identified: ply collation, autoclave investment, maintenance and working. Nevertheless, the autoclave process uses cycles composed of low heating rates (1-3°C/min) and isotherms which implies a monopolization of the installations for long periods. The first attempts to reduce curing duration of laminates were proposed by G.M. Martinez [1] and J.S. Kim [2] and showed that time reduction can be obtained with non-linear heating ramps or succession of heating and cooling ramps during the manufacturing cycle. Our work is focused on the reduction of the duration of manufacturing cycle thanks to the Roctool Cage System process based on induction heating system and water channel cooling.
2 POSITION OF THE PROBLEM
The high heating capacities of the Roctool Cage Sysytem® (theoretically up to 200°C/min) let us expect good perspectives, but such heating rates could involve important transformations in the polymeric matrix. Indeed, transitions as vitrification and gelation imply slow transformations to obtain a complete chains organisation [3, 4]. In this way, the material investigated has to be characterised in order to obtain a complete modelling of the phase transitions for the different cycle schemes, through Time Temperature Transformation diagrams [4, 5]. So the main issue is to ensure that the fast of curing a structural composite material with the Roctool process will not induce decreases in laminates strength end toughness.
3 MATERIAL
The material used for this study is the carbon/epoxy prepreg Hexply M21/35%/268/T700GC from Hexcel Composites France. The polymeric matrix is a
improve the material toughness.The reinforcement fibres are the T700GC. During the crosslinking of the thermosetting system, a phase separation can occur and nodules of thermoplastics appear. The difference in the hardness of the two phases involves a significant increase of the toughness through the reduction of fracture propagation [6]. Of course, many parameters can influence the size and the nodules spatial distribution. Those two later parameters have a great influence upon the mechanical properties (e.g. fracture toughness) of the cured material. The heating rate, as well as the curing temperature have to be controlled in regards with the melting temperature of the thermoplastic phase (i.e. particles or nodules). Moreover,
even if the impact of nodules formation or melting has not been observed, this kinetic aspect has to be considered for the future cycle optimisation [3, 7].
4 RESIN CHARACTERIZATION
In the aim to get a full modelling of M21 polymeric matrix behaviour during curing, several experimental characterisations were carried out. It is important to note that in spite that the main weight fraction of M21 is made of a thermosetting system a specific attention has been paid to the behaviour of the thermoplastic phase (i.e. particles).
4.1 DSC EXPERIMENTS
The resin M21 is first caracterized by Differencial Scanning Calorimetry, thanks to a TA Instrument Q100 MDSC. The measurements were carried out with a heating rate of 10°C/min, on resin samples (unreinforced) of about 5-10mg weight.
-3 -2 -1 0 1 2 3 4 5 -50 0 50 100 150 200 250 300 350 Temperature (°C) H ea t f lo w ( W /g ) 0 5 10 15 20 25 30 35 40 45 T im e (m in )
Figure 1 DSC heating rate of 10°C/min of the resin M21
The thermogram depicted on Figure 1 (exo. up) shows clearly a glass transition at 1.29°C. This glass transition is related to the initial state of the thermosetting part of the M21 resin. A melting peak is observed at 190°C, traducing the melting of a thermoplastic part of the matrix. As this endothermical phenomenon occurs at the beginning of the polymerisation, the calculation of the total enthalpy of polymerization remains difficult. For this reason, the endothermic (or melting) peak was removed from the heat flow curve in order to preserve the total energy of reaction. Finally, the mean enthalpy (named total heat of reaction and denoted by Htot) was
found to be 424.5 J/g for these operating conditions (10°C/min).
4.2 THERMOKINETICS
The thermo-kinetic characterization of the resin is based on the study of the epoxy/amine system. Several works on resin characterization have been found in the bibliography, as Ivankovic [8].
4.2.1 Isothermal scanning
Considering that the material supplier recommends a cure cycle with a 2 hours stage at 180°C for a complete curing of the material, the resin samples were heated at 160, 170, 180, 190, 200 and 210°C for several hours. At isotherms ends (when no more changes in the heat flow were detected by the MDSC) the samples were cooled back to -50°C and then submitted to a 10°C/min heating ramp up to 350°C. This procedure enables the residual heat of reaction, i.e. the part which has not reacted
during the isotherm (Hresid) to be determined. Comparing
this value to Htot, enables to get the degree of cure (a): tot resid H H / 1-=
a
(1)Gathering the results from the different isothermal scanning enables to build a surface describing the changes in matrix degree of cure as function of time and temperature (Figure 2).
Figure 2: Degree of cure as functions of time and temperature.
4.2.2 Dynamic scanning
The samples were submitted to various heating ramps in order to assess the effect of heating rates on curing. Rates of 5, 10, 20 and 50°C/min were studied. Some measurements were also performed at 100°C/min because the Roctool process theoretical enables such heating rates, but this heating rate is on the limits of the DSC analyser.
4.3 CHANGES IN ONSET OF VITRIFICATION
During the polymerization reaction, the changes in the glass temperature is a function of the degree of cure α [3]. By fitting the parameters of the Di Benedetto [9] equation (2), a good correlation with the experimental measurments was observed.
• (2)
In equation (2), l is a parameter to be determined by fitting of experimental results and Tg• is the maximum
glass transition temperature of the thermosetting system. To this end M21 resin samples were heated up 180°C
α λ λα ) 1 ( 1 0 0 − − = − − ∞ Tg Tg Tg Tg
and kept at this temperature for various durations. Then, the samples were cooled down to room temperature and heated again at 10°C/min up to 600°C. This enabled to get the residual heat of reaction and the matrix Tg.
Nevertheless, the presence of melting peak at 190°C (Figure 1) hinders to follow the vitrification for high conversion degrees. This is why other measurements were carried out with samples heated at 210°C, above the melting temperature. Obtained results are given in table 1.
Table 1 Equation (2) parameters Di Benedetto
parameters Isotherms at 180°C Isotherms at 210°C
Tg0 1.29°C 1.29°C
Tg• Tmelting 185°C
λ 0.2 0.3
4.4 MATRIX DEGRADATION
One other issue with high heating rates such as those we would like to use in the Roctool curing process is that they can induce some temperature overshoots and therefore matrix degradation. Thermogravimetric analyses (heating ramps and isotherms) performed on a Perkin-Elmer TGA7 were carried out from room temperature up to 350°C. M21 resin samples were submitted to ramps with rates ranging from 1°C/min to 100°C/min. The ramps were stopped when an important weigh loss was observed (> 90% of the initial weigth). Isothermal measurements were carried out at 200°C, 250°C, 300°C and 350°C. Under these isothermal conditions, the first matrix degradation was recorded for times too much long (> 24 hours) to be considered for cure cycle duration. At the end of this set of experiments, matrix degradation was described as functions of time and temperature on eq.(3). Tdegrad is the
degradation temperature (°C) and R the heating rate (°C/min).
17
.
343
)
(
592
.
19
deg=
¥
Ln
R
+
T
rad (3)4.5 CHANGES IN THE ONSET OF GELATION
The gelation was studied thanks to a Haake Mars II rheometer. Parallel plates measurements were carried out, with different heating rates (from 1 to 50°C/min) and several isotherms from 160°C to 210°C. We assume that the gel occurs when the viscosity reaches 10000Pa.s (when G’=G”). The obtained results are reported in a TTT diagram (Figure 3).
5 KINETIC MODEL
Various kinetic models were tested for the prediction of M21 resin degree of cure. Among the existing models, the phenomenological aproach of the Kamal and Sourour [10] eq. (4) gives interesting results with the material studied here.
( )
n m k k dt da
a
-a
+ = 1 2 1 (4)Moreover excellent experimental fitting was obtained with the Bailleul’s model [11]. Based on a polynomial interpolation of the DSC results, a 5th degree function
gives excellent results.
) ( ) ( a a K T G dt d = ¥ (5)
For eq. (4) and (5) parameters please report to refs [10] and [11].
6 TIME-
TEMPARATURE-TRANSFORMATION (TTT)
DIAGRAMS
The results of the resin rheological characterization are depicted in TTT diagrams (Figures 3 and 4), and coupled with isoconversion maps (curves obtained from eq. (5)).
6.1 ISOTHERMAL TTT DIAGRAM
This TTT diagram was built according to the work of Enns and Gillam [4] on epoxy resin.
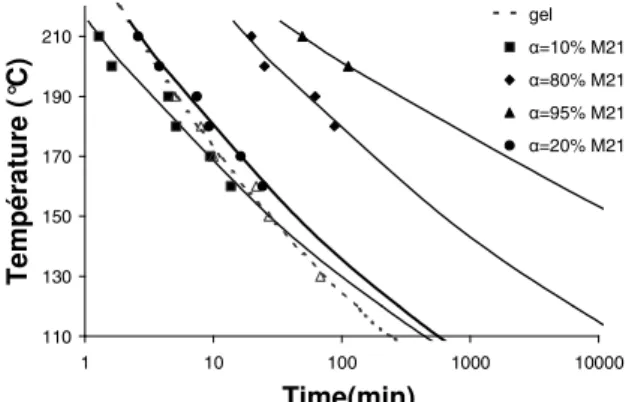
110 130 150 170 190 210 1 10 100 1000 10000 Time(min) T em p ér at u re ( °C) gel α=10% M21 α=80% M21 α=95% M21 α=20% M21
Figure 3: Isothermal TTT diagram of the M21 resin.
In figure 3, the onsets of M21 resin gelation and vitrification are plotted in continuous grey lines. Dots (squares, circles, etc.) and their fittings refer to M21matrices degree of cure a (isoconversion curves). When comparing with literature results [4] it can be noticed that the a = 10% curve (black squares) crosses the gelation curve after 27 minutes. At first sight this can be a very surprising result since a higher conversion degree (about 60%) is expected at the onset of gelation. In fact this is because the M21 resin was supplied as used in the prepreg. This means that the resin is in a ‘B’ (pre-cured stage) and its initial real degree of cure is not a=0. The main problem is that the initial degree of conversion of M21 system cannot be determined in no ways.
×
×
6.2 DYNAMICAL TTT 0 50 100 150 200 250 300 350 400 450 500 0.1 1Time (min)10 100 1000 T em pé ra tu re ( °C ) α=10% α=50% α=70% α=90% α=100% gel degradation 10 0° C /mi n 1° C /mi n 5° C /mi n 10 °C /mi n 20 °C /mi n 50 °C /mi n
Figure 4: Dynamical TTT diagram of the M21
The TTT dynamical diagram plotted in Figure 4 , also called Continuous Heating Transformation diagram by Wisanrakkit and Gillham [5]. This diagram enables to see the onsets of gelation and matrix degradation under dynamical conditions (heating ramps). On the one hand when considering the temperature scale, it can be seen that both the onset of gelation and the beginning of degradation increase with increasing the heating rates. On the other hand (time scale) the more the heating rate the quickest the gelation and the degradation.
7 CONCLUSIONS AND PERSPECTIVES
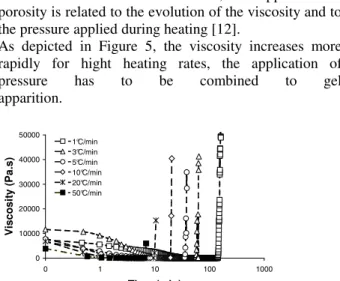
The polymeric resin M21 has been characterised and Time-Temperature-Transformation and Continuous Heating Transformation have been settled. The various parameters to consider for quick polymerizations have been highlighted. The obtained results (especially Figs. 3 and 4) constitute charts that help cure cycles with Roctool process to be designed. Nevertheless, some uncertainties such as the apparition and growth of porosity (voids) and residual stress development during the curing step do remain and have to be studied in our future work. As a matter of fact, the apparition of porosity is related to the evolution of the viscosity and to the pressure applied during heating [12].
As depicted in Figure 5, the viscosity increases more rapidly for hight heating rates, the application of pressure has to be combined to gel apparition. 0 10000 20000 30000 40000 50000 0 1 10 100 1000 Time (min) Vi sc o si ty ( P a. s) 1°C/min 3°C/min 5°C/min 10°C/min 20°C/min 50°C/min
Figure 5: Changes in the M21 resin viscosity a function of heating rate.
Heating quickly at important temperatures implies important temperature gradients. As mentionned in the bibliography [13] cooling control prevent apparition of
residual curing stress. The problem with the Roctool process may concern the cooling rates that could as heating rates be very fast and thus induce high levels of residual stresses. Finally, we have shown that quick curing put in relieve important perspective in manufacturing time reduction. But different aspects as porosity, residual stress, and degradation are still important technological locks. On going work is also focused on the impact of dynamical ramps on nodule size and repartition and their consequences on mechanical properties.
REFERENCES
[1] Martinez G.M. Fast cures for thick laminated organic matrix composites. Chemical Engineering Science, 46(2): 439-450, 1991.
[2] Kim J.S. and Lee D.G. Development of an autoclave cure cycle with cooling and reheating steps for thick thermoset composite laminates. Journal of Composite Materials, 31(22): 2264-2282, 1997.
[3] Pascault J.-P., and al.: Thermosetting Polymers. 2002.
[4] Enns J.B. and Gillham J.K. Time-Temperature-Transformation (TTT) cure diagram: Modeling the cure behavior of thermosets. Journal of Applied Polymer Science, 28: 2567-2591, 1983.
[5] Wisanrakkit G. and Gillham J.K. Continuous heating transformation (CHT) cure diagram of an aromatic amine/epoxy system at constant heating rates. Journal of Applied Polymer Science, 42(9): 2453-2463, 1991. [6] Bucknall C.B. and Gilbert A.H. Toughening
tetrafunctional epoxy resins using polyetherimide. Polymer, 30, 1989.
[7] Bonnet A., and al. Epoxy-diamine thermoset/thermoplastic blends. 1. Rates of reactions before and after phase separation. Macromolecules, 32: 8517-8523, 1999.
[8] Ivankovic M., and al. Curing kinetics and chemorheology of epoxy/anhydride system. Journal of Applied Polymer Science, 90: 3012-3019, 2003. [9] Dibenedetto A.T. Prediction of the glass transition
temperature of polymers: a model based on the principle of corresponding states. Journal of Polymer Science:Part B, 25: 1949-1969, 1987.
[10] Sourour S. and Kamal M.R. Differential scanning calorimetry of epoxy cure: isothermal cure kinetics. Thermochimica Acta, 14: 41-59, 1976.
[11] Bailleul J.L., and al. Inverse algorithm for optimal processing of composite materials. Composites Part A: Applied Science and Manufacturing, 34(8): 695-708, 2003.
[12] Olivier P., Cottu J.P., and Ferret B. Effects of cure cycle pressure and voids on some mechanical properties of carbon/epoxy laminates. Composites, 26(7): 509-515, 1995.
[13] Olivier P. and Cottu J.P. Optimisation of the co-curing of two different composites with the aim of minimising residual curing stress levels. Composites Science and Technology, 58(5): 645-651, 1998.