HAL Id: hal-01197335
https://hal.archives-ouvertes.fr/hal-01197335
Submitted on 11 Sep 2015
HAL is a multi-disciplinary open access
archive for the deposit and dissemination of
sci-entific research documents, whether they are
pub-lished or not. The documents may come from
teaching and research institutions in France or
abroad, or from public or private research centers.
L’archive ouverte pluridisciplinaire HAL, est
destinée au dépôt et à la diffusion de documents
scientifiques de niveau recherche, publiés ou non,
émanant des établissements d’enseignement et de
recherche français ou étrangers, des laboratoires
publics ou privés.
GRAPMAN: Gradual Power Manager for Consistent
Throughput of Energy Harvesting Wireless Sensor
Nodes
Fayçal Ait Aoudia, Matthieu Gautier, Olivier Berder
To cite this version:
Fayçal Ait Aoudia, Matthieu Gautier, Olivier Berder. GRAPMAN: Gradual Power Manager for
Consistent Throughput of Energy Harvesting Wireless Sensor Nodes. IEEE International Symposium
on Personal, Indoor, and Mobile Radio Communications, Aug 2015, Hong Kong, China. pp.6.
�hal-01197335�
GRAPMAN: Gradual Power Manager for Consistent
Throughput of Energy Harvesting Wireless Sensor
Nodes
Fayçal Ait Aoudia, Matthieu Gautier, Olivier Berder
University of Rennes 1, IRISA
Email: {faycal.ait-aoudia, matthieu.gautier, olivier.berder}@irisa.fr
Abstract—In this work, Wireless Sensor Network (WSN) applications that require long-term sustainability are considered. Energy harvesting forms a promising technology to address this challenge, by allowing each node to be entirely powered by energy harvested from its environment. To be sustainable, each node must dynamically adapt its Quality of Service (QoS), regarding the harvested energy using a power management strategy. This strategy is implemented on each node by the Power Manager (PM). In this paper, GRAPMAN (GRAdual Power MANager) is proposed, a novel PM for Energy-Harvesting WSN (EH-WSN) powered by pseudo-periodic energy sources. Unlike most state of the art PMs, GRAPMAN aims to achieve high average throughput while maintaining consistent QoS, i.e. with low fluctuations with respect to time, by looking for the highest throughput that can be supplied by the node over a finite time horizon while remaining sustainable. We show through extensive trace-driven network simulations that GRAPMAN outperforms state of the art PMs in both average throughput and throughput consistency.
I. INTRODUCTION
WSNs play an important role in many military, industrial and consumer applications such as battlefield monitoring, ma-chine health monitoring and home automation. Typical WSN nodes are powered by individual batteries that provide a finite amount of energy which limits the lifetime of the network. For many long-term applications, replacing the batteries of each node is not a feasible solution if they are deployed in a harsh environment or if the network size is large. A promising approach to tackle this problem is to enable the nodes to be entirely powered by the energy harvested in their environments [1]–[5]. In an EH-WSN, each node is equipped with at least one energy harvester and one or more energy storage devices. The purpose of the storage devices is to buffer energy in order to allow the nodes to survive periods during which the harvested energy is not enough to power the node.
While energy management schemes targeting battery-powered WSN aim to maximize the network lifetime, the challenge is substantially different when regarding EH-WSN. In the latter case, the purpose of the power management policies is to attain long-term sustainability, which is achieved when over long time periods the harvested energy is greater than or equal to the consumed energy, an operating mode called Energy Neutral Operation(ENO) [1].
Energy management policies are implemented on each node by a PM responsible for dynamically adjusting nodes performance according to the harvested energy. In this paper,
we present a novel power manager for EH-WSN that, unlike most state of the art PMs, considers QoS consistency as a main design goal. GRAPMAN enables EH-WSN nodes to achieve long-term sustainability while maximizing the QoS, which is evaluated as the throughput in this paper. Moreover, GRAP-MAN achieves a consistent QoS, i.e. that does not fluctuate strongly with time. Reducing the QoS variance is an important consideration, e.g. in the cases of multihop WSNs [4] or surveillance applications [6]. To reach this goal, GRAPMAN estimates the highest invariable QoS that can be supplied by the node over a finite time horizon. Our contributions to the research on EH-WSN are the following:
‚ Designing GRAPMAN, a novel PM for EH-WSN nodes powered by pseudo-periodic sources that achieves remarkable performance.
‚ Designing a new light power trace model to allow the evaluation of the PMs in different energy harvesting conditions. This model can produce different power profiles depending on parameters set by the user. ‚ Implementing and evaluating GRAPMAN and three
other state of the art PMs using extensive network simulations. Moreover, we have also evaluated the PMs using a real power light trace from [7].
The remainder of this paper is structured as follows. Section II discusses related works. Section III introduces our energetic model and the process of calculating the storage device capacity. Section IV presents GRAPMAN. The power trace model and the simulations results are presented in Sec-tion V. Finally, SecSec-tion VI concludes this paper and discusses future works.
II. RELATEDWORKS
The first dynamic duty-cycling scheme was proposed by Kansal et al. in their seminal work on energy harvesting theory [1]. In their approach, the energy source is assumed to be periodic and a single period is discretized into slots of equal duration. As the energy input is expected to be similar to the energy input at the same time on previous periods, the expected energy generation for each slot is learned using an Exponentially Weighted Moving Average (EWMA) of recorded harvested energy inputs for a given slot on past periods. Then, each slot duty-cycle is computed by taking into account the difference between predicted and observed energy inputs. The main drawbacks of this approach come from the
limited accuracy of the predicted energy computation and the high duty-cycle variability incurred by the adaptation scheme. With LQ-Tracker [2], Vigorito et al. proposed to use Linear-Quadratic Tracking, a technique from adaptive control theory, to adapt the duty-cycle considering only the battery State-of-Charge (SoC). It aims to keep the SoC at a predefined value, and thus maintain the node in ENO state. Similarly, Le et al. [5] proposed to use a Proportional Integral Derivative (PID) controller. These approaches are model-free, i.e. do not make any assumptions about the energy source.
In [3], Castagnetti et al. introduced two PMs, the Open-Loop PM (OL-PM) and the Closed-Open-Loop PM (CL-PM). The former one takes into account only the harvested energy in its power management strategy, which aims to maintain the node in the ENO state by keeping the SoC constant over time. The harvested energy is approximated by a function of the light intensity measured using a luminance sensor. CL-PM is more sophisticated and uses two distinct power management strategies, one for periods during which environmental energy is available, and one for periods during which the harvested energy is below a fixed threshold, referred to as Zero Energy Interval (ZEI). The power management strategy uses an esti-mation of the ZEI duration and adjusts the duty-cycle so that the node will not run into a power outage before the end of the non-energy harvesting interval. When environmental energy is available, the same energy neutral power management strategy as for OL-PM is used. Therefore, only a small amount of the harvested energy is saved for the ZEI, leading to low QoS and power outages when there are no harvested energy available.
Le et al. proposed the Wake up Variation Reduction PM (WVR-PM) in [4], an improvement of CL-PM. The idea is that when environmental energy is available, the PM does not try to maintain the SoC at a constant value, but instead saves some of the harvested energy for the non-energy harvesting interval. Moreover, this PM does not need an additional sensor in order to approximate the harvested energy. WVR-PM aims to achieve similar QoS during ZEI as when environmental energy is available. It uses a quantizer to reduce the duty-cycle variance, which can lower the performance significantly.
Like WVR-PM, GRAPMAN considers QoS consistency as a main design goal. While WVR-PM uses a quantizer to reduce the QoS variance, GRAPMAN uses a novel approach by finding the highest invariable QoS that can be supplied by the node over a finite time horizon. This new approach produces significant reduction of the throughput variance while achieving high average throughput.
III. ENERGETIC MODEL AND STORAGE DEVICE DIMENSIONING
A. Energetic model
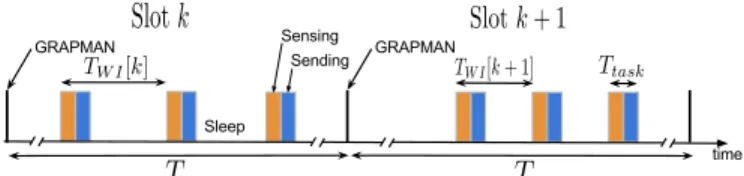
A current method to reduce the energy consumption of WSNs is duty-cycling [8]. As communication is usually the most energy consuming task, the idea of duty-cycling is to allow the nodes to turn their radio off ("sleep state") and on periodically according to a schedule. The time interval between two consecutive activations of the radio is called the wake up interval. In the proposed model, the time is divided into equal length slots of duration T . GRAPMAN intends to compute for each slot k the wake up interval TW Irks that a node can use
Fig. 1: Dynamic adaptation of the wake up interval.
while remaining sustainable. Thus, GRAPMAN is executed at the beginning of every slot. At each wake up, a node performs a measurement and sends the so obtained value. Fig. 1 illustrates this operating model. Therefore, the throughput of a node for the slot k is defined by the packet rate Rprks:
Rprks “
1 TW Irks
. (1)
For any cycle k, energy conservation for a node leads to:
eSrk ` 1s “ eSrks ` eHrks ´
1
ηPCpTW Irksq T ´ PLT, (2) where PCpTW Irksq is the power consumed by a node when
the wake up interval is set to TW Irks, eSrks is the SoC at
the beginning of the cycle k, eHrks is the energy harvested
over the cycle k, PL is the leakage power assumed to be
constant and the factor η Ps0; 1s takes into account the power efficiency caused by the power conversion. Moreover, the storage capacity is supposed to be finite, meaning that the SoC is subject to the following constraint:
@k, eSrks ď ECă `8, (3)
where EC is the storage capacity.
B. Storage device dimensioning
Let us suppose that in order to preserve the required QoS, the wake up interval should be TW I. If TN Emax is the longest
period of non-harvesting energy, estimated by modeling the energy source, then the storage device capacity ECmust fulfill
the following constraint:
ECě
1
ηPCpTW Iq T
max
N E ` PLTN Emax` EM IN` M, (4)
where EM IN is the minimum charge level necessary for the
node to operate, and M is a safety margin used to prevent predictor errors (see Section IV-A).
In our simulation setup, the energy buffer is a superca-pacitor of capacitance C. We denote VM AX the maximum
charge voltage of the supercapacitor, and VM IN is such that
EM IN “ 12CVM IN2 . Therefore, the required capacitance can
be computed as follows: C ě 2 1 ηPCpTW IqTN Emax` PLTN Emax` M V2 M AX´ V 2 M IN . (5)
IV. GRADUALPOWERMANAGEMENT
A. Harvested energy predictor
The energy source is assumed to be pseudo-periodic with a period H, such that H “ N ˆ T . GRAPMAN computes at the beginning of each time slot a wake-up interval that the node can use while remaining sustainable on a time horizon equal to the energy source period. As we are not aware of the future harvested energy, a predictor is used to estimate it. The predicted harvested energy over the slot k is denoted exHrks.
The predictor must be able to estimate the harvested energy over the next source period. The predictor from [1] is used, which works by assuming that the energy input at a given slot will be similar to the energy inputs at the same slot on previous periods. The expected energy generation is learned using an EWMA filter:
x
eHrk ` N s “ αexHrks ` p1 ´ αqeHrks, (6) where eHrks is the observed harvested energy for the slot k
and α P r0, 1s is the filter weight.
However, the EWMA predictor suffers from a low accu-racy in situations where harvested energy fluctuates strongly. Therefore, a correction factor βrks, computed for each cycle k, similar to the adjustment factor defined in [9] is used. The idea is to use the recent observations of the harvested energy in order to adjust the predictions of the EWMA filter. βrks is defined as follows: βrks “ řNC i“1eHrk ´ is řNC i“1exHrk ´ is , (7)
where NCis the observation window size. Using the predicted
harvested energy, (2) can be rewritten in a slightly modified form:
eSrk`1s “ eSrks`βrksexHrks´ 1
ηPCpTW Irksq T ´PLT. (8)
B. Dynamic performance adaptation
A wake up interval TW I is said to be sustainable for the
next N time slots if when used for the next N slots, the following constraint is satisfied:
@i P t0, . . . , N ´ 1u, eSrk ` is ě EM IN ` M, (9)
where k is the current time slot and M is a safety margin used to prevent predictor errors. The Algorithm 1 is used to determine if a wake up interval is sustainable.
The wake up interval adaptation mechanism works as follows. At the beginning of each time slot, GRAPMAN tests the wake up interval used at the previous slot using the Algorithm 1. If the wake up interval is not sustainable, then it is increased. Otherwise, it is decreased only if the so obtained wake up interval is sustainable. The Algorithm 2 shows this procedure. In this algorithm, ∆TW I is the wake up interval
adjustment step. GRAPMAN thus works by gradually adapting the wake up interval. At each time slot, the wake up interval either stays the same, or is incremented by ˘∆TW I.
Algorithm 1 Determines if a wake up TW I is sustainable over
the next N time slots.
function ISSUSTAINABLE(TW I, eSrks, βrks,exHrks . . .exHrk` N ´ 1s) sustainable Ð True i Ð 0 e Ð eSrks loop e Ð e ` βrksexHrk ` is ´ 1 ηPCpTW IqT ´ PLT if e ą EC then e Ð EC if e ă EM IN` M then sustainable Ð False break if i “ N ´ 1 then break i Ð i ` 1 return sustainable
Algorithm 2 GRAPMAN main algorithm Input: TW I, eSrks,exHrks . . . exHrk ` N ´ 1s
survive Ð ISSUSTAINABLEpTW I, eSrks, βrks,exHrks . . .exHrk` N ´ 1sq
if survive “ True then
TW IÐ mintTW I´ ∆TW I, Minimum wake up intervalu
survive Ð ISSUSTAINABLEpTW I, eSrks, βrks,exHrks . . .exHrk` N ´ 1sq
if survive “ False then
TW I Ð Previous value of TW I
else
TW IÐ maxtTW I` ∆TW I, Maximum wake up intervalu
C. Complexity and memory footprint
The complexity of the proposed algorithm is OpN q corre-sponding to the calls to IsSustainable in the Algorithm 2. At least one call to IsSustainable is required, two if the first call returns True.
The memory footprint is also OpN q because the prediction algorithm requires N memory words to store the harvested energy estimationsexHrks, . . . ,exHrk ` N ´ 1s.
As N is usually small (e.g. if H “ 24 hours and T “ 30 min then N “ 48) GRAPMAN incurs few computation and memory overhead, and therefore is well-adapted to WSN nodes.
V. PERFORMANCEEVALUATION
A. Trace generation
The Algorithm 3 is used to generate light power traces. The time granularity is one second. The purpose of the trace generator is to allow the evaluation of the PMs in regard to energy source characteristics that influence significantly their behaviors, and which can be set by the user using input parameters in the proposed model. These characteristics are the average harvested power during daytime, the difference of harvested power from one day to another and the night-to-day duration ratio. The input parameters allow the user to set up these characteristics. More precisely, PEN V is the average
power harvested during daytime and ϕ P r0, 1s is the night-to-day duration ratio. The difference of harvested power from one day to another is simulated using a coefficient (m in the Algorithm 3) that follows a normal distribution with a mean equal to one and a variance of σD2. Moreover, L is the trace length in seconds, and small disturbances of the harvested energy are considered as noise (n in the Algorithm 3) and are simulated using a normal distribution with a zero mean and a variance of σ2N. Also, in real power traces, these variations do not occur as fast as every second. Therefore, we use the parameter NW to set the duration between two variations of
the noise variable.
Algorithm 3 Trace generation Input: L, PEN V, ϕ, σD, σN, NW
Trace Ð Empty Trace t Ð 0 loop d Ð t % H if d “ 0 then m Ð RandomGaussp1, σDq if d ă p1 ´ ϕqH then if t % NW “ 0 then n Ð RandomGaussp0, σNq y Ð mPEN V ´ sin ´ πd T p1´ϕq ¯ ` n ¯ if y ă 0 then y Ð 0 else y Ð 0 Trace[t] Ð y t Ð t ` 1 if t “ L then break
In our simulation, we set ϕ “ 0.5, σN “ 0.1 and
NW “ 1800 s (half an hour). Moreover, all the simulations
last 50 days and thus L “ 50 ˆ 24 ˆ 3600 s. We generated different power traces using different values of PEN V and σD
in order to evaluate the PMs in different harvesting conditions. Fig. 2 shows three generated traces using the Algorithm 3 with different values of PEN V and σD.
B. Simulation setup
We compare our approach with several state of the art PMs. In particular, we implemented the schemes from Kansal et al. [1] (KAN-PM), WVR-PM [4] and LQ-Tracker [2] in GreenCastalia [10], an open-source energy-harvesting simu-lation framework for the Castalia/OMNeT++ simulator [11]. The simulated network consists of a star network with one sink that uses batteries as energy supply, and four nodes that are powered using solar cells. For each node (except the sink), the solar panel area is set to 30 cm2and the panel efficiency to 20%, which is a realistic value regarding current photovoltaic technologies [12]. Moreover, each node (except the sink) is equipped with a supercapacitor. The simulated hardware platform is PowWow [13] which has a power conversion efficiency η equal to 0.85 and a leakage power of 73 µW. Also, PowWow embeds a TI CC2420 that consumes 62.0 mW in active state and 1.4 mW in sleep state. Finally, simulations
0 100000 200000 300000 400000 500000 600000 Time (s) 0 10 20 30 40 50 60 Power (mW)
PENV=10 mW, σD=0.1 PENV=10 mW, σD=0.4 PENV=30 mW, σD=0.4
Fig. 2: Examples of generated power traces using the Algorithm 3 with different values of PEN V and σD.
0 50 100 150 200 TWI (s) 1 2 3 4 5 6 7 8 9 10 PC (m W )
CSMA/CA simulated CSMA/CA analytical TMAC simulated
Fig. 3: Power consumed as a function of the wake up interval. The energy consumption was obtained using the GreenCastalia simulator.
were done using both energy traces generated using the model presented in Section V-A and a real trace from [7] (more precisely, the setup F).
Consumed power model and MAC Protocol: The proposed model in Section III supposes that the power consumed by a node as a function of the wake up interval PCpTW Iq is
known and decreases. Castalia proposes an implementation of the well known TMAC protocol [14]. The power consumed by a node using TMAC is shown on Fig. 3. Using simulation, we have found that TMAC consumes too much energy for the kind of hardware we target, even when the throughput is low, i.e. TW I is high. Indeed, as TMAC is a synchronized
protocol, it requires frequent periodic radio activity even when the nodes have nothing to send. Thus, we implemented a simple CSMA/CA [14] protocol in Castalia without RTS/CTS handshaking. Transmission errors are handled with acknowl-edgment and resending (the maximum number of retries is fixed to 3). The power consumption of a node using CSMA/CA is shown on Fig. 3.
The average power consumed by a node is modeled by: PCpTW Iq “ PS`
Ttask
TW I
where PS is the power consumed in sleep state, PA is the
power consumed in active state, and Ttask is the time required
to perform a single measurement and to send the so obtained data, as shown on Fig. 1. This model has shown to be sufficient in the case of EH-WSN because of the low throughput and thus the infrequent collisions. Using the least squares method, the value of these parameters were estimated to be 62.0 mW, 1.4mW and 134.4ms respectively for PA, PS and Ttask. Fig. 3
shows the accuracy of the so obtained model, which was used in the implementation of GRAPMAN.
From Fig. 3, the wake up interval was bounded to the interval r1, 100s s as the power consumption barely decreases when the wake up interval is greater than 100 s. Furthermore, the capacitance of the supercapactiors which equipped the nodes were set to 15F, with VM AX “ 5.2V and VM IN “ 1.8V.
Calculation using (5) shows that this value is enough to ensure nodes sustainability when power consumption equals 2 mW, safety margin M is set to 10 J and night lasts for 14 hours.
Evaluation metrics: The following metrics were used to compare the PMs:
‚ The downtime ratio, denoted DR, corresponding to
the ratio of time spent in the power failure state. ‚ The average wake up interval denoted ĘTW I.
‚ The standard deviation of the wake up interval, de-noted σpTW Iq. This metric is used to measure the
throughput consistency. C. Results
GRAPMAN was implemented with α “ 0.5 as recom-mended in [1], NC “ 2, T “ 1800 s, ∆TW I “ 5 s and
M “ 10 J. Using simulation, we found that these values are appropriate. For the three other PMs, the parameters indicated in the reference papers were used. Simulations were run for multiple values of PEN V and σD. Each run last for 50 days
(simulated time). The metrics presented in the Section V-B are computed by averaging the metrics values obtained for each node.
Fig. 4 and Fig. 5 show the downtime ratio DRwhen PEN V
and σDvary respectively. As we can see, only GRAPMAN and
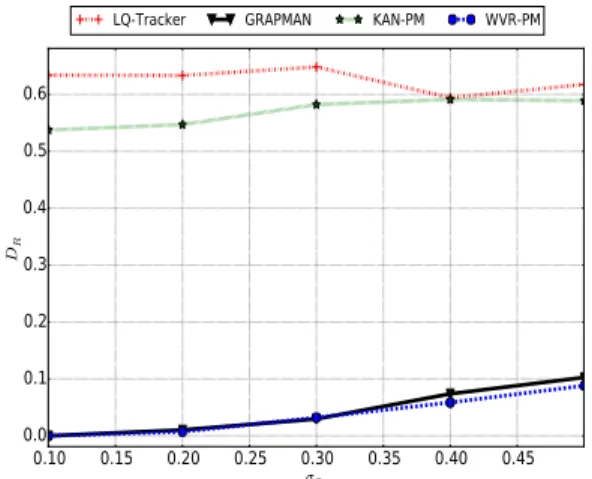
WVR-PM achieve downtime ratio lower than 10%. KAN-PM power outages can be explained by its slow response to varia-tions of energy harvesting rate due to its predictor. Moreover, the power management strategy of KAN-PM does not take into account the SoC. LQ-Tracker considers only the SoC but not the harvested power in its power management scheme. Thus it reacts slowly to variations of the harvested power, which explains the power failures. Considering these results, we only focus on WVR-PM and GRAPMAN thereafter.
Fig. 6 exposes the impact of PEN V and σDon the average
wake up interval when GRAPMAN and WVR-PM are used. The average wake up interval is significantly lower when GRAPMAN is used than when WVR-PM is used, which implies from (1) that the throughput is higher. Moreover, it is not surprising to notice that the greater PEN V is, the
lower TW I is due to higher energy harvesting rates. When
GRAPMAN is used, the wake up interval stops decreasing when PEN V exceeds 20 mW because the finite energy buffer
storage prevents the nodes from taking advantage of all the
10 20 30 40 50 60 70 80 90 PENV(mW) 0.0 0.1 0.2 0.3 0.4 0.5 DR
LQ-Tracker GRAPMAN KAN-PM WVR-PM
Fig. 4: DRas a function of PEN V. σD is set to 0.4.
0.10 0.15 0.20 0.25 0.30 0.35 0.40 0.45 σD 0.0 0.1 0.2 0.3 0.4 0.5 0.6 DR
LQ-Tracker GRAPMAN KAN-PM WVR-PM
Fig. 5: DR as a function of σD. PEN V is set to 10 mW.
harvested energy. The surplus of harvested energy is thus “wasted”. Furthermore, we observe that for low values of PEN V, the impact of σD on the throughput is significant .
For high values of PEN V, the variations of harvested energy
from one day to another have less effects on the throughput. Fig. 7 shows the impact of PEN V and σD on the
stan-dard deviation of the wake up interval σpTW Iq. GRAPMAN
incurs significantly lower variations of the wake up interval, and thus the throughput, than WVR-PM. Furthermore, the standard deviation of the wake up interval decreases when PEN V increases. In the case of GRAPMAN, the variations
of the throughput become almost null when PEN V exceeds
40 mW. Moreover, we can observe that higher variations of the harvested energy from one day to another incur higher variations of the wake up interval for low values of PEN V.
This is because the PM must adapt the wake up interval to the harvested energy in order to avoid power failures, and these changes are more substantial when the harvested power is low. Finally, Table I presents the evaluations of GRAPMAN and WVR-PM using a real power trace from [7] over 50 days of simulation (simulated time). As we can see, GRAPMAN outperforms WVR-PM in both average wake up interval and wake up interval consistency. Furthermore, the downtime ratio are similar for both PMs. These results are similar to the
10 20 30 40 50 60 70 80 90 PENV(mW) 10 15 20 25 30
¯
TW I ( s ) GRAPMAN WVR-PM σD=0.4 σD=0.3 σD=0.2 σD=0.1 GRAPMAN WVR-PMFig. 6: ĘTW Ias a function of PEN V for different values of σD.
10 20 30 40 50 60 70 80 90 PENV(mW) 0 5 10 15 20 25 30 35 σ (TW I )( s) GRAPMAN WVR-PM σD=0.4 σD=0.3 σD=0.2 σD=0.1 GRAPMAN WVR-PM
Fig. 7: σpTW Iq as a function of PEN V for different values of σD.
ones obtained when generated power traces were used, which supports the previously exposed results.
VI. CONCLUSION
This paper presents the design of GRAPMAN, a power manager for EH-WSN. GRAPMAN is able to supply high average throughput while maintaining a low throughput vari-ability with respect to time. GRAPMAN computes for each slot the wake up interval, i.e. throughput, that a node can use in order to remain sustainable. Moreover, this work presents the evaluations of GRAPMAN when compared to three other state of the art PMs using extensive trace-driven simulation. Results
PMs GRAPMAN WVR-PM
Metrics TĘW I(s) σpTW Iq(s) DR TĘW I(s) σpTW Iq(s) DR
Results 12.33 20.35 0.056 26.58 33.88 0.040
TABLE I: Evaluation of GRAPMAN and WVR-PM using a real power trace.
show that GRAPMAN and WVR-PM outperform KAN-PM and LQ-Tracker in terms of downtime ratio. Furthermore, GRAPMAN outperforms WVR-PM in terms of both average throughput and throughput consistency, while having the same downtime ratio. In our future work we intend to implement GRAPMAN on real hardware platforms.
REFERENCES
[1] A. Kansal, J. Hsu, S. Zahedi, and M. B. Srivastava, “Power management in energy harvesting sensor networks,” ACM Trans. Embed. Comput. Syst., vol. 6, no. 4, Sep. 2007. [Online]. Available: http://doi.acm.org/10.1145/1274858.1274870
[2] C. Vigorito, D. Ganesan, and A. Barto, “Adaptive control of duty cycling in energy-harvesting wireless sensor networks,” in 4th Annual IEEE Communications Society Conference on Sensor, Mesh and Ad Hoc Communications and Networks, SECON, June 2007, pp. 21–30. [3] P. Hurni and T. Braun, “Maxmac: A maximally traffic-adaptive mac
protocol for wireless sensor networks,” in Wireless Sensor Networks, ser. Lecture Notes in Computer Science, J. Silva, B. Krishnamachari, and F. Boavida, Eds. Springer Berlin Heidelberg, 2010, vol. 5970, pp. 289–305. [Online]. Available: http://dx.doi.org/10.1007/ 978-3-642-11917-0_19
[4] T. N. Le, “Global power management system for self-powered autonomous wireless sensor node,” Ph.D. dissertation, 2014, under the supervision of Olivier Sentieys and Olivier Berder. University of Rennes 1. [Online]. Available: http://www.theses.fr/2014REN1S048 [5] T. N. Le, O. Sentieys, O. Berder, A. Pegatoquet, and C. Belleudy,
“Power manager with pid controller in energy harvesting wireless sensor networks,” in IEEE International Conference on Green Computing and Communications (GreenCom), Nov 2012, pp. 668–670.
[6] T. He, P. Vicaire, T. Yan, L. Luo, L. Gu, G. Zhou, R. Stoleru, Q. Cao, J. Stankovic, and T. Abdelzaher, “Achieving real-time target tracking usingwireless sensor networks,” in Proceedings of the 12th IEEE in Real-Time and Embedded Technology and Applications Symposium., April 2006, pp. 37–48.
[7] “Irradiance Datasets,” http://enhants.ee.columbia.edu/ indoor-irradiance-meas/, 2014, [Online; accessed December-2014]. [8] G. Anastasi, M. Conti, M. D. Francesco, and A. Passarella, “Energy
conservation in wireless sensor networks: A survey,” Ad Hoc Networks, vol. 7, no. 3, pp. 537 – 568, 2009. [Online]. Available: http://www.sciencedirect.com/science/article/pii/S1570870508000954 [9] B. Buchli, F. Sutton, J. Beutel, and L. Thiele, “Dynamic power
management for long-term energy neutral operation of solar energy harvesting systems,” in Proceedings of the 12th ACM Conference on Embedded Network Sensor Systems (SenSys), 2014, pp. 31–45. [Online]. Available: http://doi.acm.org/10.1145/2668332.2668333 [10] D. Benedetti, C. Petrioli, and D. Spenza, “Greencastalia: An
energy-harvesting-enabled framework for the castalia simulator,” in Proceedings of the 1st International Workshop on Energy Neutral Sensing Systems (ENSSys), 2013, pp. 7:1–7:6. [Online]. Available: http://doi.acm.org/10.1145/2534208.2534215
[11] A. Boulis, “Castalia: Revealing pitfalls in designing distributed algorithms in wsn,” in Proceedings of the 5th International Conference on Embedded Networked Sensor Systems (SenSys), 2007, pp. 407–408. [Online]. Available: http://doi.acm.org/10.1145/1322263.1322318 [12] M. A. Green, K. Emery, Y. Hishikawa, W. Warta, and E. D. Dunlop,
“Solar cell efficiency tables (version 45),” Progress in Photovoltaics: Research and Applications, vol. 23, no. 1, pp. 1–9, 2015. [Online]. Available: http://dx.doi.org/10.1002/pip.2573
[13] “PowWow: Power Optimized Hardware and Software FrameWork for Wireless Motes,” http://powwow.gforge.inria.fr/, 2014, [Online; ac-cessed December-2014].
[14] P. Huang, L. Xiao, S. Soltani, M. Mutka, and N. Xi, “The evolution of mac protocols in wireless sensor networks: A survey,” IEEE Commu-nications Surveys Tutorials, vol. 15, no. 1, pp. 101–120, First 2013.