HAL Id: tel-03118382
https://tel.archives-ouvertes.fr/tel-03118382
Submitted on 22 Jan 2021
HAL is a multi-disciplinary open access
archive for the deposit and dissemination of
sci-entific research documents, whether they are
pub-lished or not. The documents may come from
teaching and research institutions in France or
L’archive ouverte pluridisciplinaire HAL, est
destinée au dépôt et à la diffusion de documents
scientifiques de niveau recherche, publiés ou non,
émanant des établissements d’enseignement et de
recherche français ou étrangers, des laboratoires
forecasting
Colin Leverger
To cite this version:
Colin Leverger. Investigation of a framework for seasonal time series forecasting. Machine Learning
[cs.LG]. Université Rennes 1, 2020. English. �NNT : 2020REN1S033�. �tel-03118382�
T
HÈSE DE DOCTORAT DE
ÉCOLEDOCTORALENO601
Mathématiques et Sciences et Technologies
de l’Information et de la Communication
Spécialité : Informatique
Par
« Colin LEVERGER »
« Investigation of a framework for
seasonal time series forecasting »
Thèse présentée et soutenue à « IRISA Rennes », le « 16 novembre 2020 » Unité de recherche : UMR 6074 IRISA
Thèse No :
Rapporteurs avant soutenance :
Anthony BAGNALL Professeur, University of East Anglia
Antoine CORNUEJOLS Professeur, AgroParisTech
Composition du Jury :
Président : Béatrice DUVAL Professeure, Université d’Angers
Examinateurs : Usue MORI Maître de Conférences, Université Basque
Themis PALPANAS Professeur, Université de Paris
Simon MALINOWSKI Maître de Conférences, Université de Rennes 1
Thomas GUYET Maître de Conférences, Institut Agro/IRISA Rennes
Dir. de thèse : Alexandre TERMIER Professeur, Université de Rennes 1
Invité(s) :
Laurence ROZÉ Maître de Conférences, INSA Rennes
Vincent LEMAIRE Chercheur, Orange Labs Lannion
R
EMERCIEMENTS
Cela fait six ans que je travaille chez Orange. J’ai débuté comme apprenti ingénieur logiciel et à la fin de mon cursus, lorsque le monde commençait à être habitué à l’intelligence artificielle, j’ai eu l’opportunité de continuer mon expérience avec cette thèse en Data Science, dont voici le manuscrit. Trois années mouvementées où j’ai eu l’occasion d’apprendre la recherche, le machine learning et tant d’autres choses encore. Ce qui est sûr, c’est que j’étais loin de me douter de ce qui m’attendait lors de ces trois années ; cette expérience, riche, mais intense, n’aurait pas été possible sans l’aide de différentes personnes et sur différents plans (techniques comme personnels). Ces quatre pages de remerciements leur sont dédiées. Pour entrer directement dans le vif du sujet de ma thèse, je vous invite à aller à la page 21 pour l’introduction.
Tout d’abord, je remercie l’entreprise Orange pour l’opportunité donnée lors de cette thèse : confier un projet de recherche de cette envergure à un apprenti non formé à la recherche était un pari risqué, que j’ai eu le plaisir de relever en étant bien accompagné. Je remercie Régis MARGUERIE pour avoir cru en moi lors de la création du sujet et pour toute l’aide apportée lors de ces trois années, pour chaque réunion mensuelle et chaque point de synchronisation. Je remercie Frédéric JAY pour la gestion du projet PerForecast et pour son aide lors des deux dernières années de la thèse, ainsi que l’équipe des métrologues et des experts pour ces six années de bonne ambiance et de formation continue et bienveillante. Vous allez me manquer (Stéphane avec son légendaire optimisme, David avec ses coding games, Laurence avec ses bons conseils, Bello pour son enthousiasme et sa grande gentillesse. . . et tout le monde !).
Lors de la thèse, j’ai eu la chance de pouvoir profiter d’une mobilité internationale en officiant comme chercheur détaché pendant trois mois à Tokyo au Japon. Cette expérience n’aurait pas été possible sans l’aide de Régine ANGOUJARD MIET (Orange), Jean-Luc TAGLIAMONTE (Orange), Caroline SURQUAIN (INRIA), que je remercie très chaleureusement. Nous en avons passé des heures, à nous battre avec le NDA. . . mais nous avons réussi ! Par la même occasion, je remercie l’Institut National d’Informatique (NII) à Tokyo pour leur accueil, ainsi que Ryota KOBAYASHI : thank you very much
for your support and welcoming for those three perfect months at NII labs at Tokyo—hope to see you soon. Je remercie aussi l’Université de Bretagne Loire-Atlantique et le Conseil Régional de Bretagne pour
l’obtention d’une bourse de mobilité qui m’a permis de financer ce séjour de recherche. Enfin, je remercie chaleureusement Sawako TERMIER pour son aide lors de l’apprentissage du japonais : dans un laps de temps aussi court, avec mes recherches en parallèle, j’ai été capable grâce à toi de lire quelques Kanjis et de me présenter en japonais. Avec du recul, mon programme d’apprentissage de la langue était très (trop) ambitieux. . . mais c’était un plaisir de préparer ce séjour avec ton aide.
Je remercie Vincent LEMAIRE d’avoir su m’orienter lors des questions techniques de recherche et bien sûr pour toutes les réunions mensuelles et les idées que tu as pu me suggérer en temps opportuns. Tu te plais à dire que tu n’as été qu’un « aiguilleur et donneur d’avis » lors de cette expérience, je te confirme
belles rencontres et de collaborer avec des talents du groupe pour ma recherche, c’était un atout pour l’avancement des travaux (merci à Bruno KAUFFMANN et ses équipes pour l’accueil !).
Je remercie tout particulièrement Alexis BONDU (Orange) pour son accompagnement lors de l’établissement de l’état de l’art et dans ma recherche d’une direction. Ta participation et ton aide à ce moment charnière dans la thèse ont été comme une bouée de sauvetage pour moi, qui était dans le brouillard le plus profond à ce moment précis1. Tu m’as réellement aidé à construire un projet de recherche concret sur lequel expérimenter, me lancer, et cela nous a permis ensuite de faire deux publications (et une troisième à venir) avec un contenu de recherche intéressant et de surcroît avec de bons résultats. Cette aide a énormément compté pour moi et je t’en remercie encore. Par ailleurs, c’est toujours un réel plaisir de collaborer avec toi — au plaisir de continuer dans le futur :-)
Ces trois années de thèse ont été l’occasion pour moi de découvrir le monde de la recherche, notamment en étant immergé la majeure partie du temps au laboratoire IRISA/INRIA dans l’équipe LACODAM. J’ai partagé mon bureau avec Kevin, Yichang et Raphael, que je remercie pour la bonne ambiance et pour leur sympathie. Nos sujets étaient tous différents, mais nos discussions techniques ont pu faire émerger de nouvelles idées et aider la correction de certains problèmes. Je remercie également affectueusement l’équipe des doctorants (dans l’ordre d’apparition à LACODAM : Yann, Clément, Mael[s], Alban, Johanne, Heng, Grégory, Camille, Josie, Julien) ainsi que Luis (qui s’est infiltré dans la « team des jeunes » assez rapidement à son arrivée ;-)) — nous avons pu nous soutenir lors des moments difficiles, prendre des cafés et faire des soirées pour fêter les papiers, aller en conférence ensemble. . . et ce ne sont que de supers souvenirs. Évidemment, je remercie l’équipe LACODAM plus largement (en incluant la « team des vieux ») pour tous les conseils, la bienveillance et la bonne ambiance. Nous avons la chance d’être dans une équipe dynamique, avec plein d’horizons différents et avec toujours de bonnes discussions — à la fois en recherche, mais aussi dans un cadre plus détendu à TAHITI par exemple. Merci à tous et au plaisir de collaborer dans le futur pour continuer de faire vivre la recherche ensemble. Je remercie plus particulièrement Gaelle, pour m’avoir aidé à organiser mes séjours de conférence, ainsi que la soutenance de thèse : ton aide était indispensable pour aborder ces événements sereinement.
Pour faire ma recherche, j’ai été accompagné par de super encadrants le long de ces trois ans. Tout d’abord, merci à Alexandre TERMIER, directeur de la thèse, pour ton support. C’était un plaisir de partager avec toi toutes les réunions mensuelles (avec ces fameuses illustrations corporate dont tu es si empreint), c’était aussi très enrichissant d’apprendre à ton contact à mener la recherche, trouver de nouvelles pistes et à penser stratégie. Tu m’as aussi permis d’organiser le séjour au Japon (je me souviens encore du deuxième jour de ma thèse ou je suis allé te voir en te demandant comment on pouvait travailler pour ce séjour, que j’avais planifié avant même le début de la thèse), cela a rendu l’expérience de thèse encore plus forte. Je remercie chaudement Laurence ROZE, pour ta participation à toutes les réunions hebdomadaires. Tu as toujours été très positive et rassurante lors de cette expérience et cela m’a permis plus d’une fois de reprendre confiance lors des moments difficiles, merci. Je remercie chaleureusement
Simon MALINOWSKI, pour le suivi plus technique des algorithmes en R et bien sûr pour l’encadrement de la thèse. Je me souviens particulièrement de notre soirée à Nice où nous avons pu profiter de bonnes bières avant le séminaire séries temporelles à Orange (bien que le déroulement même de la soirée me semble encore aujourd’hui assez flou) ; ta patience, ta pédagogie et ton calme placide m’ont inspiré dans mon apprentissage d’une posture plus posée, merci pour cela. Un énorme merci pour Thomas GUYET pour la gestion de la majorité de la thèse (sur le plan organisationnel, administratif, recherche, développement). C’est sûr, sans ton aide, je ne serai pas arrivé aussi loin. Merci de m’avoir répété 15 fois de générer des données (la quinzième fois fut la bonne), de m’avoir donné tant de conseils sur les présentations et sur les objectifs de telle ou telle piste, de m’avoir soutenu lors de mes moments difficiles pour mes problèmes de santé, et merci d’avoir massivement contribué à la qualité du code de recherche pour la dernière année. Nous avons tous deux appris à travailler ensemble ces trois dernières années et cela commence à devenir bien huilé — dommage que ça se termine si tôt (?!) ;-). Évidemment, je remercie mes quatre encadrants pour l’aide à la rédaction d’articles, pour la structuration et rédaction de la thèse et pour leurs remarques qui ont toutes eu leur importance.
Je remercie Dominique GAY ainsi que Themis PALPANAS pour leur participation au comité de suivi de thèse. Je remercie le jury de la thèse pour leur participation à la soutenance et à la relecture du manuscrit, ainsi que pour les échanges que nous avons pu avoir avant, pendant ou après la soutenance (Anthony BAGNALL, Antoine CORNUEJOLS, Béatrice DUVAL, Usue MORI, Themis PALPANAS).
Ma thèse s’est inscrite dans un moment charnière de ma vie : je venais de terminer mes études d’ingénieur, je me demandais quelle voie suivre pour ma carrière et je venais en plus de me découvrir une condition de santé relativement compliquée à gérer, spécialement lors d’un travail de recherche aussi intense qu’une thèse. Pour affronter ces moments parfois difficiles, mes proches et ma famille ont étés particulièrement importants pour moi. Je remercie tout d’abord Djo et Mel, pour toutes ces soirées et repas organisés rue de la pinterie, où il fait décidément bon vivre (« Quelle vue, les gars ! »). Djo, ton rôle a été primordial, notre amitié et notre projet musical commun m’ont vraiment aidé à souffler et à prendre l’air au long de ces années. Cela a certainement insufflé de nouvelles idées et directions pour toute ma recherche : encore merci et pourvu que notre projet continue de grandir tel qu’il le fait déjà. Merci à Ladjez de nous avoir rejoints dans l’aventure musicale, perfectionnant encore cette soupape d’évacuation de la pression qu’était la musique. Merci à Joss, Lilie, Victor, Elé, Paulo, Marie, Fanch, pour votre écoute et pour votre franche camaraderie, pour toutes nos soirées passées à siroter de la liqueur en refaisant le monde : là encore un exutoire nécessaire pour continuer ma recherche sereinement.
Merci à Ninon et Léonie, mes très chères sœurs, pour votre soutien durant ces trois années. Nous sommes tous trois à nouveau diplômés au cours de ces quelques années passées, je suis fier de nous :-)
Big up particulier à Ninon et Ivan pour leur accueil à Birmingham lors de ma conférence IDEAL2019,
c’était un plaisir de voir comment vous vivez de l’autre côté de la Manche. Merci à Valérie, pour ton soutien inconditionnel et pour ton aide pour mettre au clair mes idées dans les temps difficiles ; tu as su me donner ton goût du travail bien fait et tu as su sincèrement et réellement supporter chacune de mes décisions depuis toutes ces années (bonnes ou mauvaises — après tout, l’expérience est une lanterne qui n’éclaire que le chemin parcouru. . . ), et je t’en remercie encore mille fois. Ce cheminement et ces 8 années
talent de vulgarisateur qui m’a été de grandes utilités ces derniers temps, pour les merveilleux petits plats du dimanche midi en famille, mais aussi pour le bricolage étiopathique que tu as su me prodiguer tout au long de la thèse et depuis l’émergence de mes soucis de santé. Sans toi, c’est sûr, je serai encore en train de boiter, sourd comme un pot, et ma recherche aurait sans aucun doute été plus difficile encore à mener. . . Mille mercis (et encore plus) pour tout cet amour familial qui m’a toujours porté vers l’avant.
Je remercie du fond du cœur Ketsia, qui partage ma vie depuis le début de mes études supérieures. La période de la thèse n’était pas la plus simple pour toi : tu as du supporter mes changements d’humeurs liés à une recherche si imprévisible. La seconde année de la thèse ayant vraiment été difficile, tu as du mérite, de m’avoir supporté – et de m’avoir aidé à continuer d’y croire. Merci, pour tous tes conseils, pour toutes les répétitions de présentation auxquelles tu as gentiment participé, pour toutes les relectures, pour ton accueil à Paris pendant la moitié de la thèse. Merci aussi d’avoir été là pour me soutenir lors des moments incertains et d’avoir été là pour célébrer les moments de joie. Merci, pour tous les petits plats de chef que nous avons partagé, confinés que nous étions, lors de la rédaction de la thèse. Et merci de m’avoir appris à réfléchir autrement, à remettre en question les choses, à prendre du recul. . . et pour tant d’autre chose encore ! Je te dois beaucoup pour tout cela.
Last but not least, je dédie cette thèse à mes grands-parents Papé et Mamé, qui m’ont accompagné,
tout au long de ma vie, mais aussi lors de la rédaction finale du manuscrit — la dernière semaine passée à Brett’, bercé par les vagues, a permis à bien des tournures de phrases de se conclure et à la rédaction de la thèse de se terminer (. . . enfin ! après ces 9 semaines de rédaction intenses !). Merci pour votre enthousiasme sur mon sujet, pour votre fierté d’avoir un docteur dans la famille et pour la quantité impressionnante de gentillesse distillée çà et là au grès de ma vie : cette thèse, elle résulte de tout cela, vous en êtes aussi les auteurs, car vous m’avez aidé à devenir la personne que je suis aujourd’hui.
«La prédiction est un art difficile, surtout lorsqu’elle concerne l’avenir.»
R
ÉSUMÉ EN FRANÇAIS
Les logiciels et les applications web font partie intégrante de notre vie quotidienne. Il est en effet difficile d’imaginer un monde sans Internet : nous vivons à une époque connectée, où même les services essentiels (tels que les systèmes de santé, les systèmes gouvernementaux, les systèmes militaires et de sécurité, les systèmes financiers, etc.) sont hébergés sur des milliers de serveurs à travers le monde. Par exemple, il est estimé que l’entreprise Google dispose d’environ 1 million de serveurs pour supporter ses services.2 Si les serveurs viennent à manquer, les applications deviennent lentes et difficiles à utiliser.
Au contraire, s’ils sont trop nombreux, les performances sont meilleures, mais les coûts induits3 pour la gestion des serveurs superflus ne sont pas négligeables et devraient être réduits dans le meilleur des cas. La maintenance des infrastructures, assurée par les entreprises ou les institutions, n’est pas une tâche aisée. Les serveurs informatiques sont nombreux, les applications de plus en plus complexes, les technologies évoluent rapidement et le nombre d’utilisateurs est en constante augmentation. Le défi consiste à offrir le meilleur service au public à tout moment et en toutes circonstances.
Pour répondre au défi de la gestion des infrastructures, il est nécessaire de planifier les capacités requises à leur bon fonctionnement. Le planning capacitaire représente la façon dont une entreprise gère, met à jour, ajoute ou retire des serveurs physiques et virtualisés de son infrastructure. Un bon planning capacitaire réduit les coûts opérationnels et améliore la qualité des services fournis. Ses tâches et ses objectifs dépendent fortement du type d’infrastructure (baies de serveurs, ou infrastructure cloud), du type d’application hébergée (applications critiques ou avec moins de contraintes), des objectifs de l’entreprise et du budget alloué.
Les différents services proposés par Orange (accès internet grand public, réseau 4G, applications entre entreprises, etc.) sont hébergés sur des milliers de serveurs et la qualité du service est primordiale pour proposer la meilleure expérience aux clients. Cet opérateur téléphonique français historique est l’une des marques internationales majeures dans le domaine des télécommunications. Le groupe Orange est présent dans 29 pays à travers le monde et concentre ses activités sur la téléphonie et la vente d’accès à Internet – avec pour objectif principal d’offrir une qualité de service sans faille.
Au sein d’Orange, les infrastructures sont gérées par des gestionnaires de projet et des experts, via des directives de planification des capacités majoritairement manuelles. Cette approche est dispendieuse pour l’entreprise : afin d’éviter les interruptions d’activité, elle tend à surestimer les besoins. Elle est également coûteuse en maintenance : plus le système est complexe, plus il est difficile de le gérer manuellement. Ainsi, le développement d’outils aidant les ingénieurs à anticiper les besoins futurs est en pleine expansion. Bodik et al. [Bod+09] montrent que l’analyse de données d’indicateurs de performance des infrastructures (comme le nombre d’utilisateurs, l’utilisation du CPU ou de la RAM) peut être utilisée pour améliorer la planification des capacités. En effet, les données générées par les serveurs, sous forme de série temporelle (données numériques ordonnées dans le temps), pourraient être de précieuses sources d’information. Chez
2. Voir estimation: https://www.quora.com/How-many-servers-does-Google-have-1 3. En termes d’argent dépensé, mais aussi d’énergie utilisée, etc.
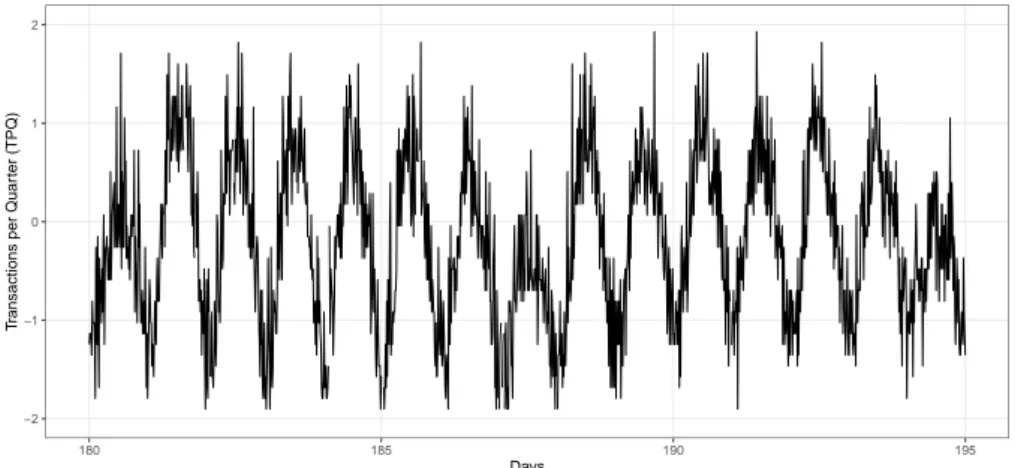
−2 −1 0 1 2 180 185 190 195 Days T
ransactions per Quar
ter (TPQ)
Figure 1: Exemple de métriques fonctionnelles, transactions financières par quinzaine de minutes
pour un projet Orange (Orange Money).
Un des enjeux majeurs de l’analyse est de prévoir l’évolution des données dans le temps. L’anticipation du comportement futur des consommateurs est une application importante en matière de marketing, mais aussi pour la gestion des serveurs. Plus les prévisions sont précises, plus les décisions concernant la planification des capacités seront éclairées : des calculs fiables permettent par exemple de décider quel système mettre à niveau. Les prévisions de séries temporelles sont particulièrement utiles lorsque l’on dispose de peu de connaissances sur le processus de génération des données, ou lorsqu’il n’existe pas de modèle explicatif satisfaisant qui relie la variable à prédire à d’autres variables explicatives [Zha03]. Les approches statistiques les plus populaires sont les processus autorégressifs [Aka98], les modèles ARIMA [Box+15] ou le lissage exponentiel type Holt-Winters [Win60].
De nombreuses séries temporelles, notamment celles liées aux activités humaines ou aux phénomènes naturels, présentent un caractère saisonnier : leurs valeurs sont périodiques et régulières. Les comporte-ments liés à l’activité humaine présentent souvent une saisonnalité quotidienne et hebdomadaire. C’est particulièrement vrai pour les ensembles de données de planification des capacités Orange. Sur la Fig. 1 ci-dessus, la saison quotidienne est très nette. Elle est due à l’objectif de l’application, qui est de transférer de l’argent entre les utilisateurs, et il y a naturellement plus de transferts le jour que la nuit, les transferts ayant lieu entre des populations situées sur les mêmes fuseaux horaires.
Il est essentiel de connaître le caractère saisonnier d’une série, car cela peut restreindre l’espace de recherche de son modèle mathématique. STL [Cle+90] est l’approche classique pour traiter de la saisonnalité ; elle construit un modèle en tenant compte de trois composantes : la saisonnalité, la tendance (évolution à long terme de la série temporelle : augmentation ou diminution) et les résidus (écart par rapport aux tendances et à la saisonnalité). Il est alors supposé que la série temporelle ne présente qu’un seul comportement périodique (ex : périodicité quotidienne des températures). Les modèles Holt-Winters et ARIMA ont été étendus pour traiter de la saisonnalité, sous condition d’un comportement périodique unique et clair. Cependant, cette hypothèse est en pratique peu fréquemment vérifiée. Considérons la
Figure 2: Exemple de série temporelle saisonnière (source: [Hyn11]). Deux semaines de données
sur le trafic internet (en bits) provenant d’un fournisseur d’accès privé ayant des centres dans
11 villes européennes. L’ensemble des données correspond à une liaison transatlantique et a été
collecté de 6 h 57 le 7 juin à 11 h 17 le 31 juillet 2005. La série temporelle est évidemment
saisonnière, mais l’hypothèse d’un schéma périodique unique ne semble pas appropriée dans ce
cas.
série temporelle de la Fig. 2, qui montre une mesure du trafic Internet pendant deux semaines. S’il existe effectivement une périodicité quotidienne, il existe également deux types de comportements quotidiens : les comportements en semaine et les comportements en week-end. Le cadre de la STL et les méthodes statistiques associées ne permettent pas de bien saisir ces caractéristiques.
Cette thèse étudie ce problème de prévision des séries temporelles saisonnières dans le contexte de la planification des capacités à Orange. Techniquement parlant, les séries temporelles vont être découpées, groupées, puis il va s’agir de s’aider des séries temporelles et des groupes pour apprendre à prédire le groupe de la saison suivante. Enfin, une série temporelle représentant au mieux le groupe prédit va être utilisée pour produire la prévision.
Un framework de prévisions de séries saisonnières
Dans cette thèse, un framework consacré aux séries temporelles saisonnières est proposé. Ce framework est basé sur la combinaison d’algorithmes de clustering et de classification pour produire des prévisions déterministes et probabilistes. Trois instanciations en seront étudiées.
La Fig. 3 explicite les différents blocs qui composent le framework. Les séries temporelles sont d’abord séparées en un ensemble d’apprentissage et un ensemble de test, et les saisons composant les séries sont extraites (la longueur d’une saison peut être connue de l’utilisateur ou trouvée automatiquement par un algorithme). Ensuite, les différentes saisons composant l’ensemble d’apprentissage sont groupées selon leurs ressemblances – à l’aide d’un algorithme de clustering ou de coclustering. L’étape suivante consiste en l’apprentissage du type de groupe de la saison à venir grâce aux données d’une ou de plusieurs saisons précédentes – à l’aide d’un classifieur par exemple. Enfin, le classifieur et les informations des saisons de l’ensemble de test sont utilisés pour effectuer les prédictions. Ces dernières sont créées en utilisant une combinaison d’une ou plusieurs séries temporelles représentatives des groupes prédits.
(clustering ou coclustering) APPRENDRE GROUPE SAISON SUIVANTE (classification) PRÉDICTION GROUPES DE SAISONS PRÉDICTEUR DE SAISON SUIVANTE Série temporelle 85% 15% PRÉDIRE LA PROCHAINE SAISON MODÈLE
Figure 3: Vue simplifie du framework proposé, avec en gris l’apprentissage du modèle, et en bleu
l’utilisation du modèle pour créer les prévisions.
Contributions et organisation du manuscrit
Les contributions de cette thèse sont les suivantes.— Le premier chapitre présente le contexte dans lequel cette thèse s’inscrit. Plus particulièrement, les notions de performances, de planification des capacités et de prévisions de séries temporelles pour la planification des capacités sont abordées ;
— Le second chapitre donne un état de l’art de la prévision des séries temporelles et introduit les définitions formelles nécessaires pour aborder le reste de la thèse ;
— Le troisième chapitre présente un framework de prévisions de séries temporelles saisonnières. Seuls les concepts, la formalisation et les idées générales sont introduits. Toutes les notions utilisées avec le framework sont définies, car les trois instanciations proposées suivent toutes les mêmes principes et le même formalisme ;
— Ensuite, trois instanciations du framework sont présentées.
— Le quatrième chapitre présente une première implémentation déterministe. Il utilise le
clustering K-means ainsi que des Chaines de Markov pour créer des prévisions déterministes.
Le choix des K-means et des modèles de Markov est naturel, car ils sont tous deux bien connus de la communauté des chercheurs et constituent des étalons, ce qui est utile pour évaluer les hypothèses. Cette première implémentation a été introduite dans la publication [Lev+18]. — Le cinquième chapitre introduit la seconde implémentation déterministe. Le framework
de référence est élargi grâce à l’utilisation de plusieurs algorithmes de clustering (K-means, K-shape, GAK et MODL), et les chaînes de Markov sont remplacées par des classifieurs
(classifieurs naïfs bayésiens, arbres de décisions, forêt aléatoire et régression logistique). Cette seconde implémentation a été introduite dans la publication [Lev+19].
— Le sixième chapitre présente une dernière implémentation basée sur le coclustering et la
classification probabiliste pour produire des prévisions probabilistes. L’expérimentation avec
divers algorithmes et diverses combinaisons était primordiale, en particulier pour introduire un framework en portfolio qui s’adapterait à chaque topologie de données, de manière à avoir des algorithmes pilotés par les données. Les prévisions probabilistes sont en principe intéressantes dans un contexte où l’incertitude est grande, comme dans les problèmes de planning capacitaire.
— L’utilisation pratique du framework est illustrée sur un cas d’utilisation concret dans le septième
chapitre, en utilisant un ensemble de données fourni par la société Orange issue de l’application
Orange Money. Ce cas d’utilisation est utile pour explorer les résultats des différentes parties du
framework (e.g. clustering, prévisions, etc.).
Expérimentations
Le Tableau 1 explicite comment le framework peut être instancié en fonction des paradigmes choisis. Globalement, les deux différences fondamentales entre l’implémentation déterministe et l’implémentation probabiliste résident dans l’utilisation du clustering ou du coclustering pour créer les groupes de jours, et dans l’utilisation des centroïdes/medoïdes ou des densités pour créer les prévisions.
Dans l’étape A) (Clustering), différents algorithmes de clustering peuvent être utilisés, notamment K-means, K-shape, GAK et MODL. Dans l’étape B) (Classification), différents algorithmes de classification peuvent être utilisés, tant qu’ils sont capables de donner des prévisions probabilistes, notamment classifieurs naïf bayésiens, arbres de décisions, forêt aléatoire et régression logistique. Différentes combinaisons de ces algorithmes de clustering et de classification sont testées lors des expériences menées dans cette thèse.
Table 1: Configuration du framework proposé.
Forecasts déterministes Forecasts probabilistes
Processus
A) Clustering
Clustering
Coclustering
d’apprentissage B) Classifieur
Classification
Processus
C) Prototypes
Centroïde ou medoïde
Densité
de prévision
D) Prévision
Hard ou Soft
Lors des expériences, l’erreur de prédiction est quantifiée en calculant la Mean Absolute Error (MAE) entre les valeurs prédites et les valeurs réelles. Chaque série temporelle est divisée chronologiquement en trois parties : 70% des données sont utilisées comme données d’entraînement, 15% comme données de validation et 15% comme données de test. Les données utilisées pour les expérimentations sont présentées de manière exhaustive dans un tableau en annexe 7.2. Notez que les ensembles de données présentés sont utilisés tout au long de la thèse pour toutes les expérimentations. Il y a 49 séries temporelles utilisées au moment des expérimentations, provenant de diverses sources telles que la bibliothèque TSDL [Hyn11], deux ensembles de données proviennent des projets Orange Money (ceux-ci seront étudiés plus en profondeur
Enfin, l’ensemble du code du framework a été développé en Python 3.5. Pour le développement des algorithmes de clustering, la bibliothèque tslearn [Tav+20] a été utilisée. Elle constitue un ensemble d’outils utiles pour le traitement des données temporelles. Pour développer la classification, la bibliothèque
sklearn [Ped+11] a été utilisée. Pour le développement de l’algorithme de coclustering, Khiops [Bou16] a
été utilisé.
Résultats principaux
Le framework proposé est implémenté en trois versions. Deux versions produisent des prévisions déterministes (voir Chap. 4 et Chap. 5), une version produit des prévisions probabilistes (voir Chap. 6). Les performances des trois versions du framework sont comparées aux performances d’opposants de l’état de l’art. En résumé,
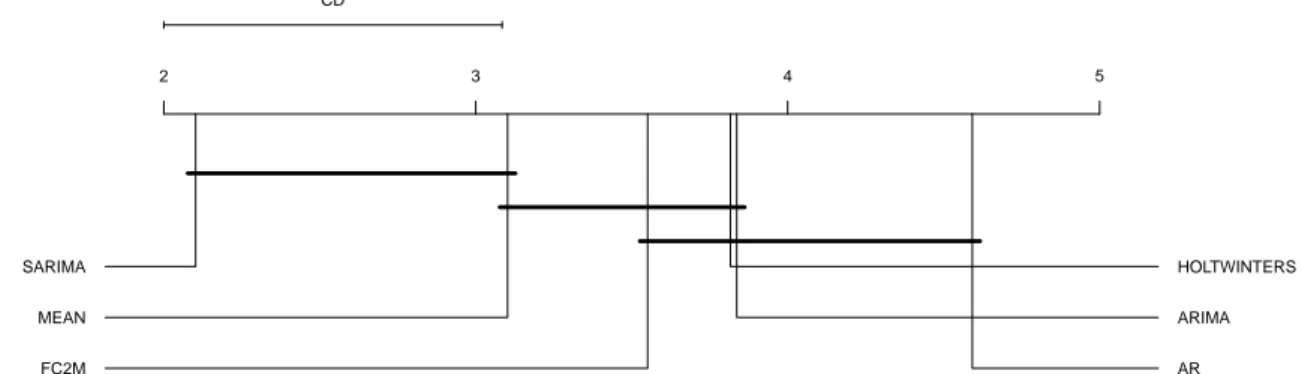
— Les performances de la première base déterministe FC2M présentée dans le Chap. 4 sont satisfaisantes contre des opposants non spécialisés dans les séries temporelles saisonnières (ARIMA, AR, Holt Winters), mais en dessous d’une méthode purement saisonnière (SARIMA) – voir Fig. 4.
— Les performances de la seconde version déterministe F2C présentée dans le Chap. 5 sont meilleures que tous les opposants déterministes utilisés pour les comparaisons – voir Fig. 5. L’influence du nombre de saisons utilisé lors de l’apprentissage des classifieur (paramètre γ) est étudiée et utiliser plus d’historique permet d’avoir de meilleures prévisions.
— Les performances de la version probabiliste présentée dans le Chap. 6 sont satisfaisantes: la création de prévisions probabilistes visuellement intéressante (e.g. qui suivent bien les vraies données – voir Fig. 6) est constatée, et la méthode PF2C utilisée en portfolio arrive en troisième position – voir Fig. 5. 2 3 4 5 CD SARIMA MEAN FC2M HOLTWINTERS ARIMA AR
Figure 4: Classement global pour la méthode FC2M contre quatre opposants (AR, ARIMA,
SARIMA, Holt Winters) et une méthode baseline (MEAN) en utilisant la MAE.
3 4 5 6 7 8 CD F2C_2 SARIMA PORTFOLIO PF2C_1 PF2C_1 MEAN HOLTWINTERS PROPHET FC2M_1 ARIMA AR
Figure 5: Classement global des différentes approches de prédiction pour différentes valeurs de
γ ∈[1, 2] (ex: F2C_γ)
0 50 100 150 200 250 300 350 2 1 0 1 2 3 4 5 0:00 12:00 0:00 12:00 0:00 12:00 0:00 12:00 DAY 1 DAY 2 DAY 3 DAY 4time (forecasted)
val
5
Figure 6: Un exemple de prévision probabiliste. En bleu, les trois jours utilisés pour alimenter le
classificateur, en rouge la distribution de probabilités associée. Dans ce cas particulier, la plupart
des valeurs bleues se trouvent dans les zones ayant de fortes valeurs de probabilités.
T
ABLE OF
C
ONTENTS
Introduction 21
1 Data driven capacity planning 25
1.1 Context . . . 25
1.1.1 Problems of infrastructure maintenance . . . 25
1.1.2 Performances and tests . . . 27
1.1.3 Wrap up . . . 28
1.2 Capacity planning . . . 29
1.2.1 Definition . . . 29
1.2.2 Capacity planning for two types of infrastructure . . . 29
1.2.3 Wrap up . . . 30
1.3 Toward data-driven capacity planning tool . . . 30
1.3.1 Industrial problem and datasets . . . 31
1.3.2 Data exploration . . . 32
1.3.3 Nature of the data and hypothesis . . . 34
1.4 Data driven algorithms . . . 35
1.4.1 Forecasts and capacity planning . . . 35
1.4.2 What could be done? . . . 36
1.4.3 Wrap up . . . 38
1.5 Wrap up and objectives . . . 39
2 Time series and forecasting models 41 2.1 Time series . . . 41
2.1.1 Definitions . . . 42
2.1.2 Machine learning tasks for time series . . . 45
2.2 Deterministic vs probabilistic forecast . . . 48
2.3 Deterministic forecasting . . . 48
2.3.1 Autoregressive models . . . 49
2.3.2 Seasonal models . . . 51
2.3.3 Neural networks models . . . 52
2.3.4 Ensemble and combination models . . . 52
2.4 Probabilistic forecasting . . . 53
2.4.1 Interval forecasts . . . 54
2.4.2 Density forecasts . . . 54
2.5 Exogenous data . . . 54
3 Conceptual view of the framework 57
3.1 Problem statement . . . 57
3.2 Model for seasonal time series . . . 59
3.3 Framework for seasonal TS forecasting . . . 61
3.3.1 Learning process . . . 61
3.3.2 Forecasting process . . . 62
3.4 Data used for experiments . . . 63
3.5 Metrics and performances assessment . . . 63
3.5.1 Typical setup for performance assessment . . . 64
3.5.2 Metrics for deterministic forecasts: MSE, MAE . . . 64
3.5.3 Metric for probabilistic forecasting: CRPS . . . 65
3.5.4 Critical diagram . . . 66
3.5.5 Win lose diagram . . . 67
3.6 Wrap up . . . 67
4 Baseline deterministic approach 69 4.1 The FC2M implementation . . . 69 4.1.1 Learning process . . . 69 4.1.2 Forecasting process . . . 71 4.2 Experiments . . . 71 4.2.1 Opponents . . . 72 4.2.2 Results . . . 72 4.3 Discussion . . . 73 4.4 Wrap up . . . 74 5 Deterministic approach 75 5.1 The F2C implementation . . . 75 5.1.1 Learning process . . . 75 5.1.2 Forecasting process . . . 78 5.2 Experiments . . . 78
5.2.1 Best parameters for F2C method . . . 79
5.2.2 Comparison against competitors . . . 81
5.2.3 Results with various γ . . . . 82
5.3 Wrap up . . . 82
6 Probabilistic approach 85 6.1 Probabilistic seasonal time series forecasting . . . 85
6.1.1 The stakes of probabilistic time series forecasting . . . 85
6.1.2 Coclustering of time series: a probabilistic model . . . 86
6.2 The PF2C Framework . . . 88
6.2.1 Learning process . . . 89
6.2.2 Forecasting process . . . 89
TABLE OF CONTENTS
6.4 Experiments . . . 90
6.4.1 Protocol . . . 90
6.4.2 Experiments with synthetic datasets . . . 90
6.4.3 Best parameters for PF2C method . . . 94
6.4.4 PF2C vs opponents . . . 95
6.4.5 Portfolio approach . . . 96
6.5 Wrap up . . . 96
7 Orange Money Transactions per Quarter Use Case 99 7.1 Case study on Orange Money dataset . . . 99
7.1.1 Orange Money TPQ dataset . . . 99
7.1.2 Relevance of using seasons for forecasting . . . 101
7.1.3 Forecast study: examples of deterministic vs probabilistic forecasts . . . 102
7.2 Wrap up . . . 102
Conclusion 105
Bibliography 109
I
NTRODUCTION
Undoubtedly, computing, software and web applications are part of our everyday life. It is hard to imagine a world without the Internet: we live in a hyper-connected era, full of social networks, shopping websites, and even critical services (such as health care systems, government systems, military and security systems, finance systems, etc.) are hosted on thousands of servers across the globe. For example, it is estimated that the Google company has approximately 1 million servers to support its services.4 If there is not enough severs deployed, the applications become slow and difficult to use. On the contrary, if there are too many servers, performances are better, but the costs incurred5 for managing superfluous servers are not negligible and should be reduced in the best-case scenario. The maintenance of the infrastructure is done by companies or institutions providing digital services, and is not an easy task. Servers are numerous, applications more and more complex, technologies are evolving fast and, furthermore, the number of users is constantly increasing. The challenge is to offer the best service for the public at any time and under any circumstances.
Capacity planning is a major preoccupation for companies of the digital economy in order to address this challenge. Capacity planning is the way an IT service manages, updates, adds or removes physical/vir-tualised servers from its infrastructure. A well-made capacity planning helps to reduce operational costs, and improves the quality of provided services. Capacity planning tasks and objectives highly depend on the type of infrastructure (e.g. bare metal servers or cloud-enabled infrastructure), the type of application hosted (e.g. critical applications or more relaxed environment), the goals of the company and the budget allocated. In this thesis, we are not directly interested in optimising resource usage but on forecasting the demand to have more time to deploy in advance an optimal infrastructure.
The various services offered by Orange (e.g. general public internet access, 4G network, business to business applications, etc.) are hosted on thousands of servers, and the quality of service is paramount for proposing the best experience to the clients. This historic French telephone operator is one of the major brands in the telecommunications field. In 2019, it was the thirteenth-largest company in the world in this field, with a global turnover of 43.7 billion euros. Orange Group operates in 29 countries around the world and focuses its business on telephony and on the sale of internet access – with a big concern on the quality of the services offered.
At Orange, project owners, managers and experts often apply manual capacity planning guidelines to manage their infrastructure. This approach is cumbersome and to prevent from any business interruptions, the server capacity is often overestimated. The more complex the system, the more difficult for engineers to set it up manually. Thus, there are more and more interest in developing tools to support engineers on part of the capacity planning problem. Bodik et al. [Bod+09] show that data analytics on datacenters Key Performance Indicators (KPI, e.g., capacity planning, number of users, RAM) may be used to improve capacity planning. Indeed, the data generated by servers or user activity could be valuable sources of
4. See estimate: https://www.quora.com/How-many-servers-does-Google-have-1 5. In terms of money spent and in terms of energy used, for example.
information. The KPI data is often collected in the form of time series datasets (numerical data ordered by time). KPI are classified in two categories: the functional KPI measures the level of activity of service; they depend on hosted services and user behaviour (the number of people on a given website) but is not related to hardware, whereas the technical KPI measure resource consumption in the infrastructure itself (evolution of CPU use). An example of a functional KPI may be found in Fig. 7: each wave represents
one day in the activity of the Orange Money project.
−2 −1 0 1 2 180 185 190 195 Days T
ransactions per Quar
ter (TPQ)
Figure 7: Example of functional metric transactions per quarter for one Orange project (Orange
Money).
One particular data analytic task that may help resource managers in the daily activity is to forecast the evolution of the KPI. Having a view on the future evolution of a system could be very valuable for systems managers. Important applications are to forecast future consumer behaviour in marketing, as well as also servers load for popular applications. The more accurate are forecasted the KPI, the more informed will be the management decisions regarding capacity planning. The objective is to provide accurate pieces of information to anticipate resources needs. Reliable forecasts enable for example to take decision of which system to upgrade, in order to seamlessly operate the maintenance.
Forecasting the evolution of a temporal process is a critical research topic with many challenging applications. This modelling approach is particularly useful when little knowledge is available on the underlying data generating process or when there is no satisfactory explanatory model that relates the prediction variable to other explanatory variables [Zha03]. In addition, having information on future evolution of a given system is important for making useful decisions at the right time, regardless of the application studied.
The most popular time series forecasting methods come from statistics, and are the following: Autoregressive [Aka98], ARIMA [Box+15] or Holt-Winters [Win60]. These methods build a mathematical model of time series. This model is then applied on new time series to predict future values. Recently, in many approaches coming from machine learning [BTL12], new methods emerged. Neural networks have for example been used extensively [ZQ05], often in conjunction with ARIMA statistical models [Zha03]. Some probabilistic forecasting toolsets have also been proposed (Prophet [TL18] or GluonTS [Ale+19]) and they often propose a way of configuring complex models more automatically.
Introduction
Figure 8: Seasonal time series example borrowed from [Hyn11]. Two weeks of the internet traffic
data (in bits) from a private ISP with centres in 11 European cities. The whole data corresponds
to a transatlantic link and was collected from 6:57 a.m. on 7 June to 11:17 on 31 July 2005.
The time series is obviously seasonal, but the assumption of having one unique periodic pattern
seems not suitable in this case.
Many time series, especially those related to human activities or natural phenomena, exhibit seasonality. This means that there is some periodic regularity in the values of time series. Human activity behaviours often exhibit daily and weekly seasonality. This is particularly true in Orange capacity planning datasets. As seen in Fig. 7 above, the daily season is very clear: every day, the activity grows up until noon and then it decreases. It is due to the application purpose, which is to transfer money between users, and there are naturally more transfers at daytime than at night-time. Most transfers are made between populations at the same time zones.
Knowing or discovering that a time series is seasonal is a valuable information for forecasts, as it can restrict the search space for the mathematical model of the time series. The classical approach to deal with seasonality is called STL [Cle+90], it builds a model while taking into account three components: seasonality, trends (long-term evolution of the time series: increase or decrease) and residual (deviation from trends and seasonality). It assumes that the time series exhibits a single periodic behaviour (ex: daily periodicity of temperatures).
Using time series seasonality in the capacity planning process could enable the study of the seasons (e.g. detecting several season types such as ‘normal season’ or ‘season that will cause a problem’). Then, being able to forecast several future seasons of a time series and discovering that one of them is a problematic season can allow managers to act proactively and to anticipate the problem.
Holt-Winters and ARIMA models have been extended to deal with seasonality. But they also assume a single and clear periodic behaviour. We distinguish here periodicity and seasonality. One concern with the method concerning periodic behaviour is that it is often violated in practical cases. Consider the time series in Fig. 8, which shows an internet traffic measurement for two weeks. While there is indeed a daily periodicity, there are two types of daily patterns: weekday patterns and weekend patterns. This cannot be well captured by the STL framework and the associated statistical methods.
This thesis studies this problem of seasonal time series forecasting in the context of capacity planning at Orange. The objective is to exploit the idea of having different types of season to make the forecast accurate. Technically speaking, time series are split in multiple seasons, similar seasons are grouped together in order to identify typical seasons, and then the time series and groups are used to learn how to predict the next season’s group. Finally, a time series that best represents the predicted groups yields the
forecast. This original way of doing tie series forecasting is the sketch of the generic framework investigated in this thesis to state whether it can help to improve capacity planning procedures.
Contributions and outlines
In this thesis, a framework dedicated to seasonal time series is proposed. The framework is based on the combination of clustering and classification algorithms for producing both deterministic and probabilistic forecasts, and three instantiations of the framework are studied.
The contributions of this thesis are the following.
— Chap. 1 introduces the context in which this thesis will take place. More especially, the notions of performances, capacity planning and time series forecasts for capacity planning are discussed. — Chap. 2 gives a state of the art of time series forecasting and all the formal definitions needed to
approach the rest of the thesis.
— Chap. 3 introduces a framework for seasonal time series forecasting. The framework proposed aims at producing the seasonal forecast in only one shot for the entire season. Only concepts, formalisation and general ideas are introduced. All the notions used with the framework are defined, because the three implementations proposed all follow the same principles and same formalism. The Chap. 3 first formalises the problem of seasonal time series forecasting, then presents the learning steps of the model, then the forecasting step and finally introduces the experimental setup followed during the entire thesis.
— Then, three implementations of the framework are depicted.
— Chap. 4 introduces the baseline deterministic implementation. It uses K-means clustering
algorithms alongside with Markov Chains for creating deterministic forecasts. The choice of
K-means and Markov Models is natural because they are both well known by the research community and can give a first assessment on the interest of the approach. This first implementation was introduced in the publication [Lev+18].
— Chap. 5 introduces the second deterministic implementation. The baseline framework is extended with the use of several clustering algorithms (K-means, K-shape, GAK and MODL), and the Markov Chains are replaced by classifiers (logistic regression, naive-bayes, decision trees and random forests). This second implementation was introduced in the publication [Lev+19].
— Chap. 6 introduces a last implementation based on probabilistic coclustering and classifiers for producing probabilistic forecasts. Experimenting with various algorithms and various combinations is paramount, especially to introduce a portfolio framework that would adapt to each data topology in a data-driven way. Probabilistic forecasting is interesting to handle uncertainty, like in capacity planning problems.
— The practical use of those frameworks is illustrated on one main use case in Chap. 7, using one dataset provided by Orange company, collected on servers deployed for the Orange Money project. This use case is used to evaluate qualitatively the various parts of the framework (e.g. clustering, forecasting, etc.)
Chapter 1
D
ATA DRIVEN CAPACITY PLANNING
Applications, and more especially online services, are often under pressure while more and more people are adopting them. The performances of servers and infrastructure are closely related to the workload. The more people using a service, the more requests and computations for the infrastructure, thus the higher the workload. The workload is not only related to CPU usage, but also to other technical features such as RAM usage, network capacity or IO access, etc. There is a complex relation between the number of people using a service and the overall use of servers. This relation is not straightforward and managing infrastructure efficiently according to the load is not an easy problem. The management of servers is made using capacity planning techniques, that help infrastructure managers in the decision-making process.
In this chapter, the goal is to clarify the technical and industrial notions used in this thesis, and to motivate choices made for a focused research direction. Concepts such as performances, capacity planning and forecasting algorithm are introduced.
Section 1.1 explicits the problems behind infrastructure maintenance, and why it is necessary to have good capacity plans for a company. Capacity planning is introduced in the Sec. 1.2, which also exhibits the main challenges of capacity planning and gives details about the technical challenges of such solutions. Section 1.3 motivates the data driven approach introduced in the thesis. Section 1.4 finally gives an overview of lots of possible solutions that could have been explored during the thesis and exhibits the selected direction.
1.1
Context
In this section, the problems faced and solutions adopted by companies while dealing with a massive infrastructure are introduced. Sec. 1.1.1 gives an idea of some major problems common in infrastructure management. Then, Sec. 1.1.2 gives an overview of how the performances of infrastructure are assessed with tests. Test data may also be used to configure the capacity of infrastructure, and therefore are useable for capacity planning tasks.
1.1.1
Problems of infrastructure maintenance
During its lifecycle, an application will hopefully meet a certain success and the number of users will gradually increase over time. Servers and infrastructure are configured to support a maximum number of users simultaneously, and may show long response time or even crash over this limit. When a service is under a high workload, it is important to ensure that there will be no operating problems (such as machines overutilized, or not enough machines to answer user requests, etc.) [All08].
Problems for consumers
As an example, think about the Christmas period, where a lot of people would like to buy presents on the internet. Imagine you are one of these buyers. And imagine that, after hours of browsing and seeking on your favourite website, you have found the best gift card for your old aunt. It is now time to pay, you have finally entered the three security digits of your faithful credit card, and suddenly: the website is not answering anymore. After a while, a pop-up eventually appears, showing that the website is currently under maintenance, due to an unpredicted number of people using it at the same time (well, it’s Christmas for everyone...). You still have questions on your mind: is your payment finalised? Will you receive this gift – will Aunty be happy at Christmas Day? Those unanswered questions mostly cause frustration and anxiety, which can make you churn (change of website/provider). Meanwhile, all engineers are working on the rush to re-establish the services: infrastructure has to be fixed, the sooner the better. Those kinds of situations are often stressful for technical crews, and technicians only wished to have taken their holidays right before Christmas...
Now imagine that you are a fan of the famous ‘Game of Thrones’ series. Imagine that a website is actually providing a VOD service which includes access to ‘Game of Thrones’. As you know, this show is very popular, and because you love it, you are eager to watch the new episodes as soon as possible so you can debrief with your friends and colleagues the next day at a coffee break. If all of your (many) friends and a fortiori all the fans of this show think this way, and if there is only one provider for the show at the television, there will be a massive peak of people that will connect at the very same moment using their TV and laptops to watch the episode. And if the infrastructure is not well calibrated, it could have consequences on the quality of the diffusion. As a fan, you will probably not be happy with lags and outages occurring between two crucial scenes! Ultimately, you could even show your unhappiness on social networks of any kind. The project owner does not like such a bad buzz about his project on the internet. It is known that it can be long and costly to order, install and configure new servers (several months and thousands of dollars). This is why she/he may be interested to have a more precise idea of when to buy new servers – when is the next season of ‘Game of Thrones’?
Problems for companies
Undeniably, for the manager of operational teams and its infrastructure engineers, one of the worst scenarios that could append is a problem that would put the service down. It could have dramatic impacts on any company. Indeed, people are not buying things on websites that are down. In many companies, the cost of one hour of downtime is estimated and it is often more than hundreds of thousands dollars. For example, during the famous Amazon Prime Days in 2018, the shopping website was down for more than one hour and it has cost to the company several millions1.
Always having oversized servers could be a good solution. Although, companies usually don’t make this kind of bet, because larger and faster servers are more expensive. Every resource not consumed because of a low activity is wasted and that waste has a cost. P. Bodik models peaks and workload in [Bod+10] and uses the analogy between high user peaks and earthquakes to show that it is not reasonable to systematically over estimate capacity: it is way too expensive to have very strong buildings ready to
1. See: https://bit.ly/2lIIhBI, a webpage from Businessinsider that agues that the one-hour downtime cost 100 million USD to Amazon.
1.1. Context
face every situation (even the one pretty improbable, say, disastrous earthquakes in a non-volcanic area), in analogy with huge, oversized servers, ready to welcome thousands of users. But serving a website with too few servers, which are not powerful enough to answer in a reasonable delay to user requests, is not a good scenario either. Users are not inclined to wait too long until results to their queries are shown. As stated in [Nie94], a user starts noticing delays after 1 second waiting time and lose attention after more than 10 secondes. Competition is hard and buyers can change their mind (and their providers) in no time.
Some cloud management softwares are able to automatically balance the use of servers so that there is less underused servers. The applications hosted are automatically transferred to unused servers depending on the needs. It allows doing some overallocation of resources [XSC12] where the software hypervisor takes profit of inactivity in some applications to reduce the overall number of servers used. Although, it can be dangerous if all the applications become very active at the same moment.
Using cloud infrastructure is more flexible: resources might be adjusted on demand, sometimes even automatically. But even if using cloud infrastructure allows to automatically adjust the architecture of an application by making its resources growing at peaks, it cannot grow indefinitely, and it has an impact on the application price. In theory, companies can pay as they grow, as long as they are able to afford costs induced by improvements.
1.1.2
Performances and tests
Computers, smartphones and tablets with an internet connection are becoming cheaper day after day, and every aspect of the customers modern lives is web-connected. It means that there are more devices browsing web services. This revolution of use has started more than a decade ago. Internet giants have then been developing technologies to cope with the always-increasing number of online consumers. Their goal is to maintain good performances. This section is dedicated to the presentation of the infrastructure testing and the various techniques used.
What is infrastructure performance?
Tech leaders have a great interest in the performances of applications. There exists several ways of assessing them. One of them is to test the applications and infrastructure. Infrastructure is being tested to ensure that it is correctly calibrated, to check the quality and robustness of the application. The goal is to validate that it could be deployed to the real world in front of real people.
Testers are specialists who bench and stress the infrastructure to ensure that they behave as expected under pressure. They use tools to simulate users browsing a website, create complex test scenarios to ensure that servers can handle in typical conditions. Tests are usually executed on a complete replica of the infrastructure, because it is not recommended to stress the production servers as they will suffer and might crash during tests, causing an unwanted unavailability. Test data is often gathered and analysed offline, because test procedures are to be distinguished of monitoring activities. In the latest, the aim is to fix problems in real time rather than preparing the infrastructure for any situation.
The load tests give the light on what can be addressed on the application infrastructure, regarding the customers’ usage. With limit tests, testers try to find the limits (in terms of data flow, number of users, etc.) of the application. Testers could also benchmark the platforms during hours with long tests, to assess whether infrastructure can last long when stressed.
Part of the tester’s job is to define test scenarios. Plausible situations which can occur in real life are simulated. Behaviour of potential customers that browse the website in a very specific way is modelled, reproduced and ultimately replayed. Scenarios can be very long and complex, can be randomised to introduce variability in the process, and are run using sometimes thousands of users at the same time. Of course, being exhaustive in scenarios is not possible: some users will find a way to use the website not exactly as planned.
One of the first indicators studied during analysis of tests results is the response time. It represents the time spent by the servers and infrastructure to reply to a user’s query and to send responses (which can be HTML, or of any other type). At a second hand, the overall availability of the servers represents the duration where the servers operate normally. System with a high availability label will theoretically be up 99.99% of the time [GS91]. The robustness of a server represents the capacity of the server not to bug and not to lose data. Finally, the scalability of the systems defines how well the servers and infrastructure react to a sudden rise of activity, and specifies the response times for different numbers of users.
How to achieve good performances?
First of all, it is important that the infrastructure containing the application is well dimensioned [Tia09]. Dimensions of infrastructure is linked both to the number of servers available (that is highly dependant on the architecture and use of the application), but also to the quality of the servers available (servers with lots of CPUs and RAM are more efficient).
Secondly, the configuration of the servers is very important, as a bad configuration can dramatically impact the behaviour of servers under high load [Eil+06]. A well-dimensioned infrastructure but with a poor configuration is sometimes unable to handle several users simultaneously, because of the overconsumption of resources that are being wasted. On the other hand, the reverse is also true, and a small infrastructure but very well tuned/configured may handle more load.
Finally, data flows between servers play an important role [Bal+11]. Indeed, the footprint of data is huge: network links have to be adapted in the infrastructure, servers have to be ready to process the massive incoming data flows (for storage, running algorithms, etc.). Data centre architects should also take into account that data flows might change over time, according to many factors (for example, launch of a new product, sudden increase in the interest of one item, etc.).
1.1.3
Wrap up
The necessity of having the best infrastructure management systems to prevent problems on services is not to be proven. Such systems will be able to ensure that servers are enough and well calibrated, that users don’t experience any latency, that networks are operating fine... And any problem will rise notifications which will help infrastructure managers to fix problems, proactively if possible. A good start for configuring infrastructure is performance testing, which is useful to configure brand new servers before production.
1.2. Capacity planning
1.2
Capacity planning
Capacity planning is the way servers are managed once they are on set. The goal is to maintain performances on the long term and not to ensure at one given instant in time that performances are sufficient.
In this section, the definition of capacity planning is given on Sec. 1.2.1. A view on how capacity planning may be applied on two different infrastructure architectures is depicted on Sec. 1.2.2.
1.2.1
Definition
Capacity Planning (CP) consists in managing running infrastructure and servers for the purpose of
reducing latency, enhancing the overall service quality and avoiding problems on servers during production. The goal is to determine the production capacity needed to meet changing demands. Some concrete examples of CP tasks are to find the right number of servers for an application, to find the size of some network links, to detect poor configuration on servers, etc.
Data from tests is often used to grade capacity models. For example, tests can reveal that systems cannot go above 10 transactions per seconds and 10 people connected to the database is the maximum. That information is to be used to enhance capacity plans. Those two processes are independent but infrastructure is often tested before creating capacity plans.
CP relies on the study of a particular set of monitored information. They assess the global health of a given system at a certain instant in time. Capacity is a very wide concept: network bandwidth, hard drive or CPU use, number of transactions per seconds, etc. CP can be done in various ways, depending on the target infrastructure and whether it is cloud enabled or not.
1.2.2
Capacity planning for two types of infrastructure
Bare metal and legacy infrastructure
In the early ages of computer science, services were deployed on huge bare metal servers [Moo+05]. Systems maintenance was mainly manual as the servers had to be ordered and installed by humans. If a threshold of users browsing a service was reached, it was difficult to react rapidly and anticipation was an important asset to ensure the stability of a service. On another hand, fewer people were browsing services at this time, which made the scaling process less dangerous.
CP analysts were collecting data, sometimes manually on legacy monitoring systems, and taking actions about anticipated flaws. They were asking questions such as ‘will my system support the load for the next month?’ and answering them by manipulating the datasets and creating experts models [Sne02]. Models were condensed of human expertise, mostly because applications managers knew very well their behaviour. Experts were aware that every year, during certain religious events, people traditionally has a different use of the application. For example, it is known that people tend to buy more goods than usual during a few weeks before Christmas. It has to be anticipated for systems hosting merchant websites not to crash.
Finally, capacity reports were produced every day/week to keep a track of every action and decision and have an overall view of the system health.
Legacy infrastructure and systems are still present in companies, for different reasons. At Orange, some critical systems have been up and running for decades, and are sometimes too critical to be shut down. For systems that run telecommunications services, it is indeed tricky to even think about a possible downtime. Those servers are proof-tested, and some mainframes used to host those old (but critical) applications sometimes could cost thousands or even millions of euros.
Cloud infrastructure
Nowadays, a lot of companies are using fully cloud-enabled infrastructure. The management of those is easier. Adding or deleting new machines is doable in minutes from a web interface for most cloud providers, whereas it could take months with traditional servers that should be installed manually by human operators. It is simple to reduce the anticipation time needed to scale up a service, and decisions can be taken in real time. There is less focus on the solid infrastructure than before, because cloud infrastructure is offering numerous interesting properties by design (e.g. replicated services, automatic virtual machines backups, etc. – see [MG+11]).
The maintenance of the real infrastructure is often on the cloud provider side, which is not necessarily the one deploying the application. More broadly, the objective of capacity planners is still to anticipate the future activity of servers and application but the horizon is shorter because everything goes faster.
Some advanced CP software sometimes manage the infrastructure in autonomy, by using some mechanisms such as auto scaling [MH11]. This technique allows the software that manages the cloud hardware to pop new virtual machines automatically if it feels that the performances are too low, based on some parameters defined by engineers. It also enables the optimisation of the number of servers in real time: if one server is not used at all for a certain amount of time, it could be removed and re-created when the need arises [DWS12].
Migrating legacy solutions to the cloud can take a lot of resources. The transition is not always fast. Orange already owns many bare metal infrastructure that are easier to exploit than clouds infrastructure. Teams are already trained and used to those paradigms, and more efficient. Therefore, most of the cloud CP techniques (auto scalability, real-time placement of virtual machines, etc.) are easier to implement in companies that are less dependant to massive, already in place bare metal infrastructure.
1.2.3
Wrap up
In this section, the concept of CP has been introduced, and its application to two different types of infrastructure explained (namely bare metal and cloud infrastructure). For those two types of infrastructure, the challenge is to anticipate the need for more resources in order to ease their management.
This thesis aims in developing some machine learning (ML) algorithms for improving the CP at Orange. A special interest is shown about forecasting algorithms. Next Sec. 1.3 gives a view on a possible data-driven CP tool for Orange needs.
1.3
Toward data-driven capacity planning tool
The solution to a fully automated and complete infrastructure management software is certainly not straightforward. Many different directions might be followed in the path of improving the CP toolset at


![Figure 2.4: Difference between Euclidean and DTW measures. Image borrowed from [Cas+12].](https://thumb-eu.123doks.com/thumbv2/123doknet/8066460.270456/48.892.267.659.183.486/figure-difference-euclidean-dtw-measures-image-borrowed-cas.webp)
