HAL Id: hal-01008528
https://hal.archives-ouvertes.fr/hal-01008528
Submitted on 20 Nov 2018
HAL is a multi-disciplinary open access
archive for the deposit and dissemination of sci-entific research documents, whether they are pub-lished or not. The documents may come from
L’archive ouverte pluridisciplinaire HAL, est destinée au dépôt et à la diffusion de documents scientifiques de niveau recherche, publiés ou non, émanant des établissements d’enseignement et de
Non local damage models with evolving internal length:
motivations and applications to coupled problems
Gilles Pijaudier-Cabot, Khalil Haidar, Mirvat Omar, Ahmed Loukili
To cite this version:
Gilles Pijaudier-Cabot, Khalil Haidar, Mirvat Omar, Ahmed Loukili. Non local damage models with evolving internal length: motivations and applications to coupled problems. Fifth International Con-ference on Fracture Mechanics of Concrete and Concrete Structures, 2004, Vail, Colorado, United States. �hal-01008528�
1 INTRODUCTION
In quasi-brittle materials, fracture exhibits a finite size process zone. Macro-cracking is the result of progressive material damage in which micro-cracks appear first in a rather diffuse way and then coalescence occurs in order to form the crack. The size of the resulting fracture process zone (FPZ) is not dependent on the structural size, provided it does not interfere with the boundaries of the considered body. It is controlled by local heterogeneity, and by the state of stress as well. From the modelling point of view, the description of the FPZ has to involve the introduction of an internal length in the governing equations. It can be in the form of a characteristic length which is related to the length of the process zone, or in the form of an internal length in non local constitutive relations.
In most existing proposals, the internal length is a constant parameter. Still, there are some theoretical indications that suggest that the internal length should change in the course of the fracture process: with the help of micromechanics, Bazant (1994) arrived at the conclusion that when the interactions between cracks and voids develops in the course of failure, the weight function entering in the calculation of the non local variable controlling damage should change as well. Recent
experiments carried out at R&DO on model cementitious materials with controlled initial porosity, i.e. initial damage, have shown that the size of the fracture process zone changes with the amount of voids in the material. Acoustic emission (AE) analyses exhibit clearly an increase of the fracture process zone with initial damage.
The aim of this contribution is firstly to examine the correlation between the width of the fracture process zone observed with AE and the internal length in non local constitutive relations. Secondly our purpose is to consolidate these experimental observations in a modified non local damage model with evolving internal length. The correlation between the width of the FPZ and the internal length of the material obtained from inverse analysis of size effect tests is discussed. The consequences on the inception of strain localisation are also considered. The width of the localisation zone increases with damage and is stabilised, as opposed to the original model where it decreases.
Finally, extensions of this model to ageing resulting from an increase of material porosity, to creep-damage interaction, and to hydromechanical effects are discussed.
Non local damage model with evolving internal length:
motivations and applications coupled problems
Gilles Pijaudier-Cabot, Khalil Haidar, Mirvat Omar, and Ahmed Loukili
R&DO, Institut de recherches en Génie civil et Mécanique, Ecole Centrale de Nantes, BP 92101, F-44321 Nantes cedex 3, France
ABSTRACT: In most existing proposals, the internal length in non local damage models is a constant parameter. Still, there are some theoretical indications that suggest that the internal length should change in the course of the fracture process. The aim of this contribution is firstly to examine the correlation between the width of the fracture process zone observed with acoustic emission and the internal length, and secondly to consolidate these experimental observations in a modified non local damage model with evolving internal length. Extensions of this model to ageing resulting from an increase of material porosity, to creep-damage interaction, and to hydro-mechanical effects are discussed in the closure.
2 EXPERIMENTS ON MODEL MATERIALS The experimental program has been designed in order to measure the mechanical characteristics of mortar specimens with a controlled microstructure (Haidar et al., 2003). This control was achieved by
adding inclusions of weak mechanical
characteristics (polystyrene beads) in a mortar matrix.
All test specimens were made with a mix which consists of ordinary Portland cement CPA-CEMI 52.5, polystyrene beads, normal density fine sand with a maximum size of 2 mm, a superplasticizing agent (Glenium 51) and water. Expanded polystyrene spheres of 3 – 7 mm mean diameter were used as aggregate in the mix design. Expanded polystyrene consists essentially of air. Four different mixes of densities 2.0 – 1.8 – 1.6 and 1.4, having polystyrene content g of 13 22 -31 and 39 % respectively, were achieved in addition to the reference material (mortar without inclusions). All mixes have a cement/sand ratio of 0.46 and a water/cement ratio of 0.4. For the bending tests, four different sizes of geometrically notched concrete specimens were used. The depths were D = 40 , 80 , 160 and 320 mm while the thickness was kept constant for all the specimens b = 40 mm. The length to depth ratio was L/D = 8:3 and the span to depth ratio was l/D = 2.5 for all specimens. One notch of depth D/6 and thickness 1.5 mm (same for all dimensions) was placed in each bending specimen by putting steel plates in the moulds before casting.
2.1 Size effect tests
The size effect tests followed the guidelines established by RILEM (1990). The tests were notch opening controlled with a constant CMOD rate of 0.1 µm/s for D = 40 – 80 mm, 0.20 µm/s for
D = 160 mm, and 0.25 µm/s for D = 320 mm.
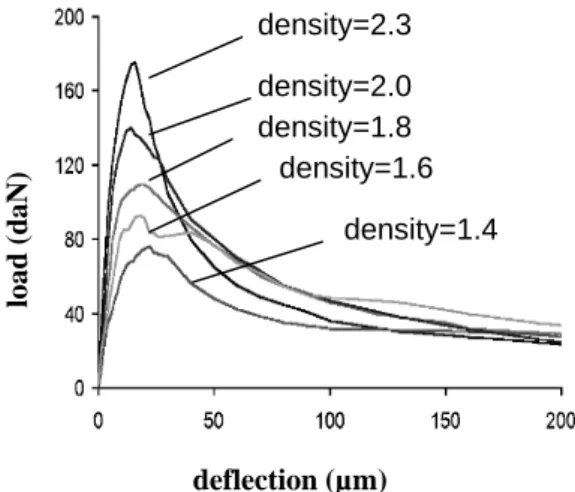
Figure 1 shows the response of medium size specimens (D=40mm) for each material density. Note that the deflection at peak is almost independent from the density of the material. The material density influences still the mechanical behaviour of beams; the lower the density, the lower the stiffness and the peak load.
These data are going to be interpreted with the help of Bazant’s size effect law (Bazant and Planas, 1998). This theory is here restricted to the dependence of the nominal stress at failure σN on
the characteristic dimension D of 2D geometrically similar specimens. This dependence is described by the approximate formula:
0 / with 1 D d Bft N = + = β β σ (1)
where ft is the tensile strength of the material, a0 is
a characteristic size that corresponds to a change of mechanisms between plasticity phenomena and fracture mechanics, and B is a material parameter which is a function of the geometry of the specimen and applied load.
Figure 1. Influence of density on structural behavior, average load-deflection curves for different material density on 40 × 40
× 107 mm3 beams.
σN is calculated according to the classical formula
for a beam of unit thickness :
2 83 . 0 2 3 D FL N = σ (2)
whereFis the maximal load and L is the length between supports. The fracture energy Gf, defined
as the energy release rate required for crack growth in an infinitely large specimen, is also calculated (see Bazant and Planas, 1998).
It is found that the fracture energy Gf shifts
from the value 88.5 N/m for the reference material to 52.30 N/m for the material density 1.4, a decrease of 41%. In figure 2, size effect results are presented in a log-log diagram only for the two extreme densities (1.4 and 2.3) for more clarity. The larger the beam, the lower the relative strength. It can be noticed that the failure of the beams with polystyrene (density = 1.4) tends to adhere more to strength of material than to fracture
density=2.3 density=2.0 density=1.8 density=1.6 density=1.4 lo a d ( d a N ) deflection (µm)
mechanics, since the corresponding data shift right on the size effect plot. It means that the material becomes more ductile as the density decreases (increasing porosity).
Figure 2. Bazant’s size effect curve: calibration for material density 2.3 and 1.4.
2.2 Acoustic emission analysis
AE analysis was performed on specimens of size (40×160×428 mm3) and for three different material densities (2.3, 2.0 and 1.8). Three piezoelectric transducers (resonant frequency of 150 kHz) were used. Transducers were placed around the expected location of the process zone to minimize errors in the AE event localisation program. The accuracy of the technique ranged from ±4mm for the reference mortar to ±10mm for the lighter material tested (density 1.8).
The cumulated locations of acoustic events throughout a test are shown in Figure 3: the plotted points indicate the detected AE sources over a window of observation, centered at the notch, of width 130 mm and covering the beam depth. In the same figure, we have plotted the observed crack path that appeared after the test on the lateral surface of the specimen.
The major aim of the AE analysis is to obtain an experimental characterisation of the FPZ. More specifically, it is the width of the FPZ which is the quantity of interest since it is related to the internal length in continuum models (see e.g. Mazars and Pijaudier-Cabot 1996) and to the parameter d0 obtained from Bazant’s size effect analysis (Le Bellégo et al. 2003). An useful approach, well suited to measure the crack band width, is to divide the specimen into an array of rectangular elements and to count the AE events located within each element. A grid of size 1×1 cmis used here. The
cumulative number of events, i.e. the sum over the entire record during the experiment, is plotted as a function of its horizontal position x for various vertical positions y over the depth of the specimen. Then, the crack band width is defined as the length of the segment of a horizontal straight line placed at 20% of the maximum number of counts (Nbmax), which intersects the average distribution of AE events (see Haidar et al. 2003 for more details). These values are about 50, 67 and 85 mm for the material densities 2.3, 2.0 and 1.8 respectively.
Figure 3. Cumulative location of AE events (material density 2.3).
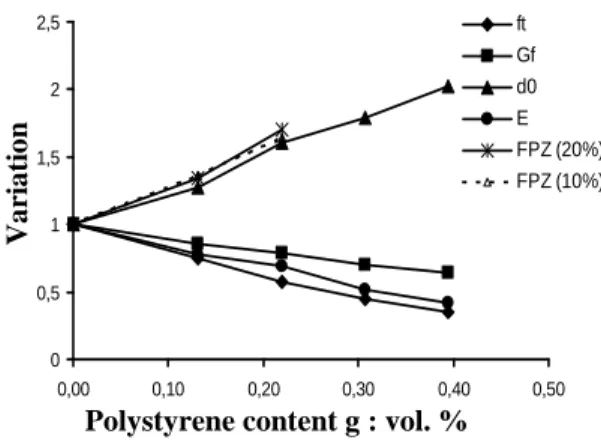
We have also studied the case where the horizontal straight line intersects the vertical axis at the value = 10 % of Nbmax, and we have observed that the evolution of the width of the FPZ, as a function of the polystyrene content g, is the same.
Figure 4. Evolution of fracture properties with polystyrene content. -0,30 -0,24 -0,18 -0,12 -0,06 0,00 -1,2 -0,8 -0,4 0,0 0,4 density = 2,3 density = 1,40 log (D/d0) lo g (σσσσ /B ft )
Polystyrene content g : vol. %
V a ri a ti o n 0 0,5 1 1,5 2 2,5 0,00 0,10 0,20 0,30 0,40 0,50 ft Gf d0 E FPZ (20%) FPZ (10%)
Figure 4 shows the evolution of the width of the FPZ defined according to this criterion with the mass density of the specimens. On the same graph, the evolution of d0, of the fracture energy Gf, of the
tensile strength ft, and of the Young’s modulus E
are also plotted. Note that there is a very good agreement between the evolution of d0 and the evolution of the width of the FPZ.
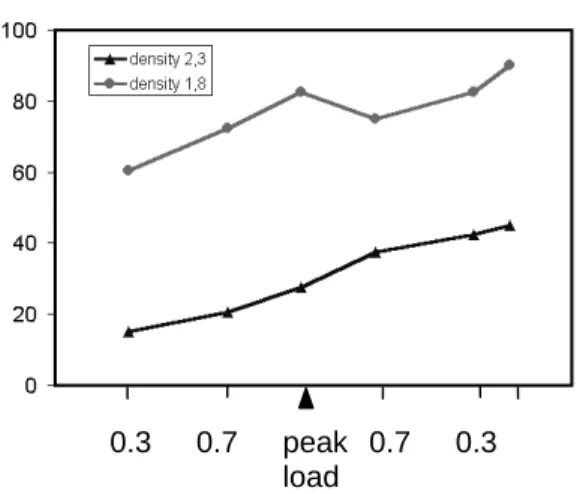
This technique allows the determination of the shape of fracture process zone in its final stage, but incremental counts (in between two loading stages) provide also the evolution of the FPZ as the failure process develops. Such an evolution of the width of the FPZ is shown in figure 5. The width of the FPZ enlarges in the course of damage progression. Furthermore, the width is larger for the porous material compared to the reference one (without inclusions).
Figure 5. Evolution of the width of the fracture process zone v.s. the applied load for the two material densities. The load on the horizontal axis is increasing and then decreasing in the post peak regime.
2.3 Correlation with the internal length
We are going now to compare the experimental quantities determined in the previous section, namely the width of the FPZ and the parameter d0,
with the internal length in a continuum model. The non local version of the isotropic damage model is used (see for instance Mazars and Pijaudier-Cabot, 1996). lc is the internal length of the non local
continuum.
This internal length is obtained with the help of inverse finite element analysis, following the procedure described by Le Bellégo et al. (2003). The calibration procedure is based on a
simultaneous fit of the numerical and experimental load deflection curves for the four sizes of specimens.
Figure 6. Prediction of the response of mortar beam with the material density 2.3.
Figure 6 shows the fits obtained for the reference material. The internal lengths and the others model parameters obtained as a result of these fits are reported in Table 1 for all the mass densities.
density lc (mm) κ0 At Bt
2.3 34.4 4.61 10-5 0.79 9836
1.8 51.5 4.66 10-5 0.65 9220
1.4 64.2 4.79 10-5 0.52 7893
Table 1. Set of model parameters resulting from optimised fits.
Figure 7. Evolution of d0, FPZ (experimental), FPZ (numerical)
and lc with polystyrene content.
Deflexion (mm) 0 200 400 600 800 1000 0 0.04 0.08 0.12 0.16 0.3 0.7 peak load Width of FPZ (mm) 0.3 0.7
Polystyrene content g : vol. %
V a ri a ti o n 0,5 1,0 1,5 2,0 2,5 0,0 0,1 0,2 0,3 0,4 0,5 d0 FPZ (exp.) FPZ (num.) lc
Same as for the acoustic emission tests we also measured the width of the FPZ obtained in the numerical analyses. It is 75 mm for the reference material, 120 mm for material density 1.8, and 139 mm for the lowest material density. These values are 40 percent greater than the experimental ones but the ratio between the computed and measured widths of the FPZ is constant whatever the mass density of the material as shown in Fig. 7. In the same figure, we have plotted also the evolution of Bazant’s size effect parameter d0 and of the internal length with the mass density of the specimens. The respective variations of these parameters are very similar, which is quite remarkable. This is also in good agreement with the result obtained by Bazant and Pijaudier-Cabot (1988), where the width of the zone of localized damage was shown to be proportional to the internal length of the material.
3 SIMPLIFIED MICROMECHANICS
The objective of the foregoing simplified analysis is to obtain qualitative expressions of non local effects induced by the presence of cracks in an elastic, homogeneous material (for more details see Pijaudier-Cabot et al. 2003).
Consider an infinite isotropic two-dimensional solid subjected to a remote uniform stress field σ∞.
Our purpose is qualitative and we shallconsider for more simplicity σ∞ as isotropic. Under this
simplification, the considered problem is
essentially one-dimensional, the strain and stress being volumetric. This solid contains microcracks caused by the loading history that are distributed in the material arbitrarily. Each crack induces a modification of the local stress and strain fields. In order to evaluate this perturbation, we assume that the microcracks are far enough from each others. Under this assumption, the induced remote stress and strain fields due to a crack are similar to those generated by a circular void. Therefore, cracks are going to be replaced by circular voids in the foregoing derivations. The calculation of the perturbation stresses and strains between the voids uses the superposition theorem. Note that cracks or voids are far from each others and that the perturbation stresses are computed far from them. We look at a material that has been slightly damaged only.
We may decompose this problem into two sub-problems:
• Sub-problem I: the solid is considered without any inclusion. It is subjected to the remote tensile volumetric stress σ∞.
• Sub-problem II: inside each void, a
distribution of normal pressures is applied. Superposition of these two sub-problems provides the distribution of the stress inside the medium containing voids. In the n problems of a circular void Si (i = 1 – n) of diameter ai in an
elastic matrix, the remote traction σ∞ is
transformed into distributed normal forces Pi =
-(σ∞ . ni) acting inside each void where ni is the
outward normal vector to the inner void surface Γi. The effect of the pressure inside the voids Sj on
void Si is written as the sum of the pij (i ≠ j), where
pij represents the normal pressure at the imaginary
location of Si produced by Sj: 2 2 ij j j ij r a P p ∝− × (3) ij
r being the distance between the centers of void i
and void j. Since the voids are sufficiently far from each others, we have:
ij j ij n i j j ij i i r a l l P P ≈ + = ≠ = with 1 ) ( 1 2 (4)
On each contour Γi of each voids we define:
i i =−P
σ (5)
where σi is the volumetric stress that equilibrates
the normal pressure applied inside void i, to which the effect of interaction is added in order to equilibrate the remote stressσ∞on the void surface.
Let us now evaluate the stress acting in the material, between the voids. According to the superposition scheme, the resulting local stress field at each point xk of the isotropic medium is
the sum of the contributions due to each internal pressure inside each void plus the remote field:
) ( ) ( ) ( 2 i i ik k k x l x x ≈σ∞ + σ∞ σ (6)
This equation is typically non local and the voids produce a stress amplification. At each material point, this amplification depends on the distance to the void considered, on the remote stress, and on the square of the radius of the void ai. Eq. (6) is
very similar to the one derived by Bazant (1994), with a more simple influence function here.
We are going now to derive the local strain field with a view to the expression that controls the growth of damage locally. Because the material in between the voids is elastic, we have:
+ = = ∞ ∞ i i ik k k k K x l K x K x x ) ( ) ( ) ( ) ( σ σ 2 σ ε (7)
where K is the bulk stiffness of the isotropic elastic medium. We can see here that the strain in the material is modified due to the voids. Same as for the stress, there is a non local amplification. Our goal is to recover an expression of the strain that is similar to the quantity that controls damage in continuum relations. For this, we need first to define such a constitutive relation. We use again the isotropic damage model:
(
1 ( ))
( ))
(xk K d xk ∞ xk
∞ = − ε
σ (8)
Substitution in Eq. (7) yields:
(
)
(
)
∞ ∞ − + − = i i i ik k k k x x d l x x d x ) ( ) ( 1 ) ( ) ( 1 ) ( 2 ε ε ε (9)It may be interesting to further modify Eq. (9) in order to exhibit the correction to the remote strain due to the presence of the voids. For this, we divide Eq. (9) by (1−d), which is possible because damage is small. We obtain after some simplifications:
( )
(
)
∞ ∞ ∞ + = i i ik i k k x r x f x x ) ( ) ( ) ( ε ε 2 ε ε (10)Non local effects appear only when voids are present. They should grow when the number of voids increases. Function f(ε∝
)
is a monotonically increasing function of the local strain, or on the local value of damage (see Pijaudier-Cabot et al. 2003).4 MODIFIED NON LOCAL MODEL
In the original non local damage model, the width of the FPZ is related to the internal length. According to bifurcation analyses (see e.g. Mazars and Pijaudier-Cabot, 1996) it is proportional to the internal length. The experimental data presented in
section 2 show that the internal length should increase in the course of damage. Furthermore, micromechanics shows that non local effects increase with damage. That can be captured considering that the internal length should increase in a non local model. Before modifying the original non local damage model accordingly, let us first recall the main equations. The stress – strain relation is:
kl ijkl
ij d ε
σ =(1− )Λ (11)
where σijand εij are the components of the stress
and strain tensors respectively (i, j, k, l ∈ [1, 3]),
ijkl
Λ are the initial stiffness moduli, and d is the
scalar damage variable. For the purpose of defining damage growth, the equivalent strain is introduced:
= + = 3 1 2 ~ i i ε ε (12)
where .+ is the Macauley bracket and εi are the
principal strains. In the non-local damage model, the variable ε which enters in the equations governing damage growth is:
Ω Ω − = − = ds s x x V ds s s x x V x r r ) ( ) ( with ) ( ~ ) ( ) ( 1 ) ( ψ ε ψ ε (13)
where
Ω
is the volume of the structure, Vr(x) is the representative volume at point x, and ψ(x−s) is the weight function:− − = − 2 2 4 exp ) ( c l s x s x ψ (14) c
l is the internal length of the non local continuum. We look now for an enhancement of this model which accounts for the main characteristics of Eq.(10) of the micromechanical model. According to Eq. (10) and at a given point x, the non local influence of a void located in its neighbourhood at coordinate z depends on the value of the scalar function f(ε(z)). It vanishes if there is no void, when damage is zero andf(ε(z))= 0, and it increases afterwards. In a continuum model, the
non local contribution to the equivalent strain ε(x) of the local equivalent strain ε~(z) at point z in Eq. (13) should be weighted following the same principle. There are several possibilities for capturing such an effect in the above non local model. One is to modify the value of the internal length in the weight function directly in order to capture the increase of the weight:
− − = − )) ( ~ ( 4 exp )) ( ~ , ( 2 2 s l s x s s x c ε ε ψ (15) with: 0 ) ~ ( . ) ~ ( c c f l l ε =α ε + (16)
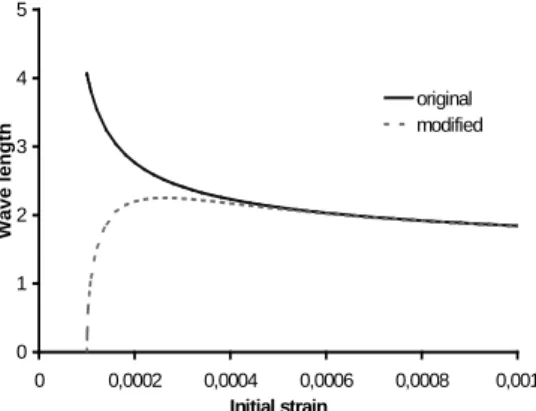
A one dimensional bifurcation analysis has
been performed taking into account this
modification of the non local model. The variation of the wavelength of localised modes is shown in Fig. 8.
Figure 8. Variation of the admissible wavelength (mm) of the localised modes according to the original and enhanced damage models.
On this plot, it can be observed that the width of the localised modes is increasing, at least in a first regime where the damage zone forms. This is consistent with the experimental observations in Fig. 5, as opposed to the results obtained with the original model with fixed internal length.
5 CLOSURE - APPLICATIONS TO COUPLED
PROBLEMS
A first application to coupled problems deals with the chemo-mechanical case. More precisely, we intend to investigate the case of calcium leaching which produces an increase of porosity of the
material, assuming that it is homogeneous, made of a single phase, which is a rather crude simplification of cement paste and mortar. The micromechanical model can be adapted in order to account for the initial porosity of the material. Eq. (6) becomes: ) ( ) ( ) ( ) ( j 2 2 j jk i i ik k k x l x l x x ∞ ∞ ∞ + + ≈ σ σ σ σ (17)
where the last term is the perturbation stress due to each initial void j. The derivation of the continuum model follows the same steps as in section 3, under the same assumptions and considering that the initial voids in the model material are sufficiently far from each others. The continuum constitutive relation which accounts for the initial porosity is chosen as σ=(1−d)(1−V)Kε where V is damage due to the initial porosity. This model is similar to the one devised by Gérard et al. (1998) among others,
for chemo-mechanical damage. The strain
governing damage growth (Eq. 10) becomes:
( )
(
)
∞ ∞ ∞ ∞ + + = j j jk j i i ik i k k x r x V x r x f x x ) ( ) ( ) ( ) ( ) ( 2 2 ε ε ε ε ε (18)An enhanced non local model can again be devised for materials with an initial distribution of voids such as those used in the experiments in section 2. One possibility is a subsequent modification of the weight function: 0 ) ~ ( . ) , ~ ( c c V f V l l ε =α ε +β + (19)
where β is an additional constant which accounts for the variation of internal length due to the initial material porosity. We can see here that an increase of the internal length is expected. This is consistent with experimental observations on model materials with controlled porosity (Fig. 7).
A second application is hydro-mechanical problems. Here, the voids or cracks are assumed to be filled with water. The water pressure is superimposed to the stress inside the voids and the interaction between voids is modified. Eq. (6) may be rewritten as: 0 1 2 3 4 5 0 0,0002 0,0004 0,0006 0,0008 0,001 Initial strain W a v e l e n g th original modified
( ) ( )
(
+)
+ ≈ ∞ ∞ i ik i i k k x l x px x ) ' ( ) ' ( ' σ 2 σ σ (20)Note that the stress σ' is now the effective stress. The fluid pressure contributes to a part of the total applied stress and, in addition, it increases the interactions between voids. Eq.(10) becomes
( ) ( )
(
= +)
∞ ∞ ∞ i i ik i i k k x r x p x f x x ) ( , ) ( ) ( 2 ε ε ε ε (21)and one can devise a corresponding non local continuum model in which the internal length is a function of internal pressure:
0 ) ( ) ~ ( . ) , ~ ( c c p f g p l l ε =α ε +β + (22)
Function g(p) is positive and increases with increasing pressure.
A third application is the case of creep-damage interaction. Eq. (6) remains unchanged but the local constitutive relation is time dependent:
(
1 ( ))
( ) ) ( ) (xk K t d xk ∞ xk ∞ = − ε σ (23)The bulk modulus K(t) is a secant modulus that can be computed from visco-elastic relations. Eq. (10) becomes
( )
(
=)
+ ∞ ∞ ∞ i k i i ik i k k x x t K x t K r x f x x ) ( ) , ( ) , ( ) ( ) ( 2 ε ε ε ε (24)and one can see that the interactions depends on the ratio between the secant moduli at each point. If the rate of loading is larger at point xk than at point
xi, then it is expected that this ratio is less than 1
and the interaction decreases. Consequently, an apparent decrease of the internal length is expected. The corresponding non local model with evolving internal length remains to be devised. One may think about a rate effect on the evolution of lc
as suggested by size effect tests (see Bazant and Planas, 1998).
Finally, let us stress that the above qualitative discussion about the influence of porosity, internal pressure, and creep on the internal length has to be
correlated with experimental results and probably with a less simplistic micromechanical analysis before a proper evolution of the internal length is implemented. Experimental data for the
chemo-mechanical case are available from the
experiments presented in this paper, with a model material only. Other type of experiments exhibiting the variation of the FPZ due to creep, internal fluid pressure, or chemo-mechanical effects remain to be performed.
6 ACKNOWLEDGMENTS
Financial support from the french ministry of research under the ACI Jeunes Chercheurs and from the partnership between Electricité de France and the R&DO group through the MECEN project are gratefully acknowledged.
7 REFERENCES
Bazant Z.P., 1994. Nonlocal Damage Theory based on Micromechanics of Crack Interactions, ASCE Journal of Engineering Mechanics, 120, pp. 593 – 617.
Bazant Z.P. and Planas J., 1998, Fracture and size effect in concrete and other quasibrittle materials ", CRC press, Boca Raton and London, 1998.
Bazant Z.P. and Pijaudier-Cabot G., 1988. Nonlocal Continuum Damage, Localization Instability and Convergence, Journal of Applied Mechanics, ASME, 55, pp. 287-294.
Gérard B., Pijaudier-Cabot G. and La Borderie C., 1998. Coupled Diffusion-Damage Modelling and the Implications on Failure Due to Strain-Softening, Int. J. Solids and Structures, 35, pp. 4107-4120.
Haidar K., Pijaudier-Cabot G., Dubé J.F. and Loukili A., 2003. Correlation Between the Internal Length, the Fracture Process Zone and Size Effect in Mortar and Model Materials. Submitted for publication to Concrete Science and Engineering.
Le Bellégo C., Dubé J.F., Pijaudier-Cabot G., and Gérard B., 2003, Calibration of Non Local Damage Model from Size Effect Tests, Eur. J. of Mechanics A/Solids, 22, pp. 33 – 46.
Mazars J. and Pijaudier-Cabot G., 1996. From damage to fracture mechanics and conversely: a combined approach, Int. J. Solids. Struct., 33, 3327-3342.
Pijaudier-Cabot G., Haidar K., and Dubé J.F., 2003, Non Local Damage Model with Evolving Internal Length, Int. J. Num. Anal. Meths. Geomech., in press.
RILEM Draft Recommendations, 1990. Size effect method for determining fracture energy and process zone size of concrete, 23, 461-465.