HAL Id: hal-00918733
https://hal.archives-ouvertes.fr/hal-00918733
Submitted on 21 Feb 2014
HAL is a multi-disciplinary open access
archive for the deposit and dissemination of
sci-entific research documents, whether they are
pub-lished or not. The documents may come from
teaching and research institutions in France or
abroad, or from public or private research centers.
L’archive ouverte pluridisciplinaire HAL, est
destinée au dépôt et à la diffusion de documents
scientifiques de niveau recherche, publiés ou non,
émanant des établissements d’enseignement et de
recherche français ou étrangers, des laboratoires
publics ou privés.
LiTL: Lightweight Trace Library
Roman Iakymchuk, François Trahay
To cite this version:
Roman Iakymchuk, François Trahay. LiTL: Lightweight Trace Library. [Technical Report] INF
-Département Informatique. 2013. �hal-00918733�
LiTL: Lightweight Trace Library
Roman Iakymchuk and François Trahay
Institut Mines-Télécom – Télécom SudParis 9 Rue Charles Fourier
91000 Évry France
Email: {roman.iakymchuk, francois.trahay}@telecom-sudparis.eu
Abstract—In order to design parallel applications that exploit efficiently modern supercomputers with their complex architec-ture, it is required to apply a variety of programming models and techniques. The development of such applications as well as their tuning to achieve the optimal performance is practically impossible without performance analysis tools.
In this paper, we present a scalable binary trace library – Lightweight Trace Library (LiTL). LiTL aims at providing performance analysis tools with a low-overhead event recording service. In order to enhance the scalability and the performance of such tools, we implement various optimization strategies and techniques in LiTL. The experiments on a suite of synthetic and standard computation kernels show that the overhead caused by LiTL in conjunction with EZTrace remains low. Furthermore, LiTL often performs better than the existing event recording libraries, saving up to 88 % of the CPU time and up to 68 % of the disk space. Finally, LiTL is a generic library that can be used in conjunction with a wide range of performance analysis tools.
Keywords—Performance analysis, binary trace library, multi-threaded applications, hybrid programming models
I. INTRODUCTION
High-performance computing (HPC) is no longer a topic related only to Computer Science. Scientists from many other disciplines such as Physics, Geodesy, and Biology rely more often on parallel computing for their experiments. In general, HPC clusters permit to run larger simulations and/or obtain results in a rather short time. However, due to the complexity in hardware – multi-core processors, NUMA architectures, GPUs accelerators – as well as the hybrid programming models that mix MPI, OpenMP, and/or CUDA, the development of a scalable application that exploits efficiently HPC platforms is a difficult task.
Performance analysis tools provide a great help during the development, tuning, and optimization of parallel applications. The purpose of such tools is to depict the application behavior in order to find performance bottlenecks and improve the ap-plications performance. Those tools are usually used to gather the information about the program execution for immediate or further performance analysis. One way of gathering such information is to store time-stamped events in a trace file. Those events represent the important phases of the application execution such as calls to MPI communication primitives and synchronization among threads. Collecting this data requires to intercept the calls to the corresponding functions and to record events in a trace file.
In order to depict accurately the behavior of an application, it is crucial that the performance analysis tool does not disturb
the program execution: the overhead of such tool should be as small as possible. Previously, we presented a lightweight mechanism for instrumenting functions [1]. Once functions have been intercepted, the performance analysis tool needs to record events in a trace file with the lowest overhead possible. In this paper, we focus on the second important component of performance analysis tools: the event recording mechanism.
We present LiTL – a lightweight binary trace library. LiTL aims at providing performance analysis tools with a scalable event recording mechanism that utilizes minimum resources of the CPU and memory. In order to efficiently analyze modern HPC applications that combine OpenMP (or Pthread) threads and MPI processes, we design and implement various mechanisms to ensure the scalability of LiTL for a large number of both threads and processes. Although LiTL is a generic library that can be used in conjunction with many performance analysis tools, here we integrate it in the EZTrace framework as a replacement for FxT [2] – the current event recording library. The evaluation shows that LiTL performs better than FxT for multi-threaded applications. LiTL permits to analyze larger MPI jobs. Moreover, trace files that are generated by LiTL are smaller in size than the ones created by FxT.
The rest of the paper is organized as follows. Section II provides literature overview of existing performance analysis tools as well as trace libraries. Section III presents the EZTrace framework and its core components including the current event recording library. The main features of the new scalable binary trace library are introduced in Sections IV to VI. We evaluate LiTL in conjunction with EZTrace and compare it with FxT in Section VII. Finally, Section VIII discusses conclusions and the future work.
II. LITERATUREOVERVIEW
When developing high-performance or parallel applica-tions, a big concern is put on the communication between threads/processes/nodes and also the performance optimiza-tion. In order to create scalable software with the optimal execution time, software developer often rely on performance analysis tools. Numerous research has been conducted on this topic. As a result, many tools were designed for tracing the execution of parallel applications to better understand their behavior as well as to find performance bottlenecks. Some tools are dedicated to a specific programming model or library, such as MPI Parallel Environment (MPE) [3] that targets MPI applications; POSIX Thread Trace Toolkit (PTT) [4] aims at Pthread-based applications; OMPtrace [5] instruments OpenMP applications. Other performance analysis tools cover
multiple models and can track calls to multiple libraries on various architectures, for instance VampirTrace [6], TAU [7], Paraver [8] or Scalasca [9]. These tools can be used for instrumenting custom libraries or applications through manual or automatic instrumentation of their code.
The performance analysis tools that generate execution traces rely on tracing libraries dedicated to a specific trace format. Some formats are limited to a particular programming model. For instance, the Open Trace Format (OTF) [10] focuses on MPI events and function entry/exit. OTF2 [11] is an extension of OTF that adds support for OpenMP events. Some other trace formats are self-defining, allowing to depict any event in a more generic way. For instance, the Pajé file format [12] and the Pablo self-defining data format. The concept of the other trace formats is to store data in a raw format within a trace file. The application that reads the trace file is then in charge of adding meaning to the recorded events. The FxT [2] library create traces using the raw format.
Additionally to the optimization applied in file formats, some libraries – such as OTF or OTF2 – use a compression mechanism to reduce the file size. This is done by using a general purpose compression library like zlib. The main draw-back of file compression is that it causes an additional overhead when writing the traces to the disk. We do not consider the trace compression here, however adding the compression phase before writing traces to the disk is rather straightforward.
III. EZTRACE
EZTrace is a general framework for analyzing high-performance and parallel applications. EZTrace relies on a tracing mechanism that aims at executing an application once in order to record its execution trace. After the execution of the application, EZTrace analyzes the resulting trace and extracts various statistics. Furthermore, EZTrace provides a function-ality to generate trace files in different formats. These files can be visualized with tools such as Vampir [6], ViTE [13], or Triva [14].
EZTraceis shipped with modules for the main libraries that are used in parallel programming, e.g. MPI and OpenMP, and it allows third-party developers to create modules that instrument their own functions [15]. For instance, the PLASMA [16] linear algebra solver integrates an EZTrace module that permits to visualize the tasks scheduling operated by PLASMA.
For recording trace files, EZTrace modifies the binary of the application on-the-fly and inserts probes before and after functions of interest [1]. Then, the program is executed in the regular way. When the program enters one of the instrumented functions, e.g. MPI_Send, EZTrace records an event (MPI_SEND_ENTRY), executes the actual function (MPI_Send), and records another event that marks the exit of the function (MPI_SEND_EXIT). Each event consists of a timestamp, an event code, a thread identifier, and addi-tional data depending on the event type. In case of the MPI_SEND_ENTRY event, EZTrace records the destination process, the message length, and the message tag as the additional data. At the end of the application execution, events are written into trace files.
After the recording phase, EZTrace reads the trace files that were generated and analyzes the events. Depending on the
user choice, during the analysis phase various statistics, e.g. the time spend in the MPI communication, can be extracted and Pajé or OTF files can be generated in order to visualize the application execution.
A. Recording events with FxT
For recording events, EZTrace relies on the FxT library. FxT is a multi-level trace library [2] that permits to record events in a binary format from both kernel- and user-space. Even though FxT is efficient for small-scale applications, it suffers from several scalability issues.
The first scalability issue is related to the event recording mechanism: FxT generates one trace file per process during the execution of the application. Moreover, the recording mechanism fails to scale when the number of threads per process grows. For instance, on multi-core architectures each process may contain dozens of threads that write events into a single event buffer – increasing both the contention and the application execution time. Thus, the FxT scalability issue concerning the large number of threads is a big obstacle on modern CPUs.
Afterwards, during the post-mortem analysis all the recorded trace files are read by EZTrace for further analysis. Due to the constrains imposed by the Linux operating system, there is a limitation on the number of trace files (it typically equals 1024 files) that can be opened at once by the process, which is in charge of the performance analysis. Thus, EZTrace currently cannot be used for large MPI jobs.
Performance analysis may impact heavily the efficiency of parallel applications, especially the large scale ones that generate millions of events producing huge trace files. A major issue when analyzing such applications is the size of generated trace files. Reducing the size of traces is critical in order to make the analysis of large scale applications lightweight and harmless for their performance. Although compression techniques can be used, it is also crucial to reduce the size of data to its maximum before compression.
Finally, the complex multi-level tracing mechanism that permits to record events from both kernel- and user-space makes FxT difficult to maintain. Since EZTrace records events only from user-space, a large portion of the source code as well as the data structures are redundant. Due to the complex structures and the functionality behind, adding new features that would improve the scalability of FxT is an arduous task that is comparable to the development of a new trace library with the same functionalities from scratch.
B. Recording events with LiTL
In order to resolve the above-mentioned issues, we propose to design a new trace binary library that provides similar functionalities to FxT:
• Records events from user-space with a low overhead; • Improves the scalability, especially for applications that rely on a large number of threads or processes. The new library is named Lighweight Trace Library (LiTL). LiTL can be used by performance analysis tools such as
EZTrace for recording events in trace files. As in FxT, LiTL minimizes the usage of the CPU time and memory space in order to avoid disturbing the application that is being analyzed. LiTL is also fully thread-safe that allows to record events from multi-threaded applications. In contrast to FxT, LiTL records events only from user-space. This permits to apply only the relevant data structures and functionalities, and thus to simplify the maintainability of the library.
In the next Sections, we present various techniques that permit to resolve the scalability issues of FxT. Section IV describes the LiTL approach for reducing the size of the gen-erated trace files. Section V depicts the strategy for improving the scalability of the library when a large number of threads concurrently record events. Finally, Section VI presents the solution that allows LiTL to process large MPI jobs. All of these features are already implemented in LiTL.
IV. UTILIZEDRESOURCES
EZTrace gathers the information regarding the program execution in form of events that are generated before and after calls to the instrumented routines.
As an example, let us consider a simple MPI ping-pong program that relies upon MPI_SEND and MPI_RECV routines. These routines have the following prototypes:
1 int MPI_Send(void *buf, int count, MPI_Datatype datatype,
int dest, int tag, MPI_Comm comm);
2 int MPI_Recv(void *buf, int count, MPI_Datatype datatype,
int source, int tag, MPI_Comm comm, MPI_Status
*status);
We develop an MPI module for EZTrace, where we determine a list of key functions that are instrumented. For each function, we also define a list of parameters that are recorded and can be useful during the post-mortem analysis. For instance, for MPI_SENDwe record two events as follow:
1 EZTRACE_EVENT4(EZTRACE_MPI_START_SEND, size, dest, tag,
comm);
2 EZTRACE_EVENT3(EZTRACE_MPI_STOP_SEND, dest, tag, comm);
EZTRACE_MPI_START_SEND is recorded before the call to MPI_SEND and EZTRACE_MPI_STOP_SEND afterwards. Also, in these events we store the information regarding four parameters, namely a message size, a message tag, a destination, and an MPI communicator. This procedure is applied for all intercepted functions.
Each event in the FxT library consists of two parts: the event core (the event code, the time when the event occurred, the thread identifier, and the number of parameters) and event parameters. The number of event parameters recorded by FxT varies from zero to six. Also, there is an additional event type in FxT, where parameters are stored in the string format. Its purpose is to gather either the regular parameters in a string format or the information about the abnormal behavior of applications like thrown exceptions.
As it can be seen from the example above, the parameters passed to each event have different data type. In order to handle the variety of possible cases, event’s parameters in FxT are represented by the largest data type, which is uint64_t on x86_64 architectures. Hence, any parameter – no matter
whether it is a char, an int or a long int – can be recorded without being truncated. However, the reserved slot for each parameter is often bigger than its actual size. Thus, this leads to the non-optimal usage of resources. For instance, in case of MPI_SEND each parameter requires 4 bytes of the storage, but it occupies 8 bytes instead.
From the experiments we observe that in many cases the required space to store an event is smaller than the one reserved by FxT. Hence, we apply our optimization strategy to utilize every byte from both the memory and disk space. Such optimization is crucial, especially for applications that generate millions of events and produce large trace files. Moreover, writing a huge amount of data to the disk increases the overhead of EZTrace. So, our goal is to keep trace files as small as possible without losing any of the recorded data. Therefore, we propose to use the compacted event storage that aims at utilizing every byte from the allocated space.
In our approach, we introduce three different types of events: regular, raw, and packed. The regular event is similar to the one in FxT, meaning without any major optimization being involved. The packed and raw (parameters are stored in a string format) events represent the optimized versions of storing events, where each parameter can be saved as a group of bytes. Accordingly, by using the event type packed for recording and storing events, we theoretically are capable to save up to 65 % of the disk space1 compare to both the
regular LiTL and FxT events. Also, we increase the number of parameters to 10, which covers a wider range of possible cases.
Fig. 1(a) shows, on an example of three events with differ-ent number of parameters, the occupied space of evdiffer-ents within the trace file recorded by EZTrace with FxT. We symbolically partitioned the trace file into bytes and also chunks of bytes, which store event’s components. The space occupied by each event with its parameters is highlighted with parentheses.
Fig. 1(b) shows the storage of the recorded events in the trace file while using EZTrace with LiTL. We consider one particular scenario when each event’s parameter can be represented by uint8_t; this requires only one byte for the storage. To store larger event’s parameters we use arrays of uint8_t. This scenario corresponds to the optimal perfor-mance in terms of the memory and disk space usage. Under this approach, not only the size of the core event’s components is shrunk, but also the size of event’s parameters is reduced significantly. The gained performance, e.i. the reduced space, can be characterized by the gray area that corresponds to the difference in storage between FxT and LiTL events. The size of three events recorded by LiTL is smaller than the size of one event with five parameters recorded by FxT. This figure confirms our assumption regarding the possibility of reducing the size of both the recorded events and trace files.
V. SCALABILITY VS. NUMBER OFTHREADS
The advent of multi-core processor have led to the increase in the number of processing units per machine. It becomes
1This scenario represents the situation when each event’s parameter can be stored using the smallest data type, which is uint8_t on X86_64 architectures.
event5
time tid cpu code np par0 par1 par2 par3 par4
event2
time tid cpu code np par0 par1
event3
time tid cpu code np par0 par1 par2 (a) FxT event5 time cd tp np par event2 time cd tp np par event3 time cd tp np par saved space (b) LiTL
Fig. 1: Storage of different kinds of events in the trace file recorded by EZTrace. In the figure, time is the time when the event occurred; cd means the event code; tp is the event type; np stands for the number of event’s parameters; par – an array of parameters.
Process Threads B U F F E R Trace File (a) FxT Process Threads . . . B UFFERS Trace File (b) LiTL
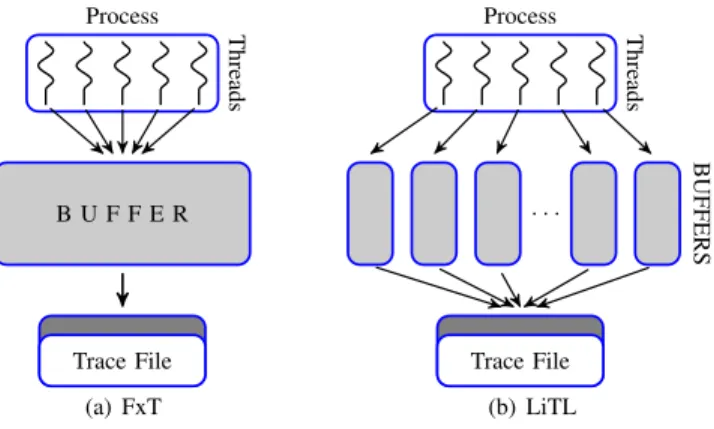
Fig. 2:Event recording mechanism on multi-threaded applications.
usual to equip a typical high performance computing plat-form with 8, 16, or even more cores per node. In order to exploit efficiently such facilities, developers can use hybrid programming models that mix OpenMP (or Pthread) threads and MPI processes within one application. Hence, the number of threads per node, which executes the same application, can be quite large – 8, 16, or even more threads. The number of threads per node is the scalability issue for FxT, because in its implementation all threads within one process record events into a single buffer, see Fig. 2(a).
The FxT recording mechanism causes a contention problem – when multiple threads record events simultaneously, the pointer to the next available slot in the buffer is changed concurrently. The modifications of the pointer can be done atomically in order to preserve the data consistency. However, the atomic operation does not scale quite well when it is performed by a large number of threads at the same time. Thus, analyzing OpenMP applications that run lots of threads using EZTrace with FxT may result in the high overhead.
This scalability issue can be clearly seen on NUMA architectures where the buffer in which threads record events is allocated on one memory bank of the NUMA machine. When multiple threads gather application’s events from dif-ferent NUMA nodes, the overhead of the event recording may increases due to NUMA effects. Therefore, analyzing the execution of applications on NUMA machines with a decent amount of cores is potentially harmful for their performance.
A. Recording Events
While designing LiTL, we aim at resolving the above-mentioned limitation of FxT. Thus, we propose to record events into separate buffers, meaning to have one buffer per thread instead of one buffer per process. This approach is illustrated on Fig. 2(b).
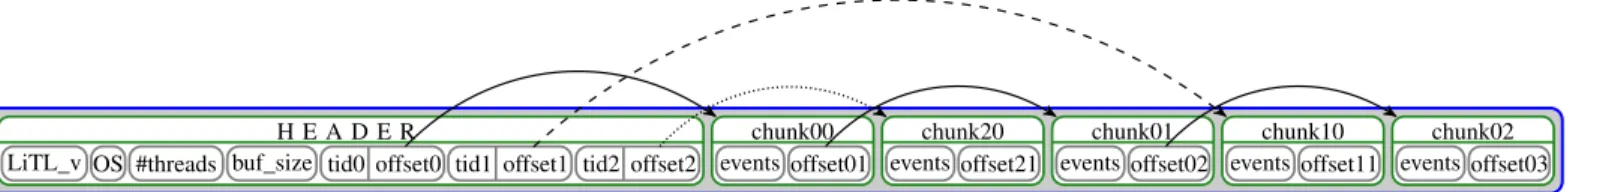
To keep multiple buffers in order within the trace file, we add a header into the trace file with the information regarding the number of threads and pairs <tid, offset>; tid stands for the thread identifier; offset corresponds to the position of the first chunk of events for a given thread within the trace starting from its beginning. The last event of each chunk contains either an offset to the next chunk of events or a symbol specifying the end of recording for a given thread. While flushing the current buffer to the trace file, the following two actions are performed:
1) Setting the offset of the current chunk to specify the end of the recording;
2) Update the offset from the previous chunk to point to the current one.
Fig. 3 demonstrates the storage mechanism on an example of three threads, including the positioning of chunks of events as well as the way of linking those chunks into one chain of the corresponding thread using offsets.
During the application execution, it may occur that some threads start recording events later than others. This sce-nario requires appropriate modifications and adjustments to the above approach. According to the previous approach, the header is the first block of data that is added to the trace file; it is written before flushing the first chunk of events. Thus, the header contains the information only regarding the started threads. In order to add pairs <tid, offset> of the late threads, we reserve a space for 64 pairs (chunk of pairs) between chunks of events within the trace file. So, when one among those late threads wants to flush its buffer to the trace file, we add its pair <tid, offset> directly to the next free spot in the chunk of pairs. The chunks of pairs are binded with offset in the same way as chunks of events. Therefore, EZTrace does not have limitations on the number of threads per process and also processes.
B. Post-Mortem Analysis
We develop the functionality for analyzing the generated traces by capturing the procedure of the event recording
H E A D E R
LiTL_v OS #threads buf_size tid0 offset0 tid1 offset1 tid2 offset2
chunk00 events offset01 chunk20 events offset21 chunk01 events offset02 chunk10 events offset11 chunk02 events offset03
Fig. 3: Storage of events recorded by EZTrace with LiTL on multi-threaded applications. In the figure, LiTL_v contains information about LiTL; OS – about OS and architecture; #threads stands for the number of threads; buf_size – the buffer size.
mechanism. At first, LiTL reads the trace header with the information regarding the buffer size, threads (the number of threads, tids, and offsets), and also pairs <tid, offset> that correspond to the late threads. Using this preliminary information, LiTL allocates memory buffers for reading; the number of buffers equals the number of threads used during the recording phase, meaning one buffer per thread. Then, LiTL loads chunks of events from the trace file into these buffers using pairs <tid, offset>. After processing the first chunks of events, LiTL loads the buffers with the next ones using the information concerning their positions in the trace, which is given by the offsets. This procedure is recursive and stops when the symbol specifying the end of recording is reached.
VI. SCALABILITY VS. NUMBER OFTRACES
In FxT, one trace file is generated per process. This means that for parallel applications with hundreds of MPI processes the equal amount of trace files is created. This is one side of the problem. The other side appears while analyzing the applications execution due to the limitation on the number of trace files that can be opened and processed at the same time. Therefore, FxT does not perform well and even crashes when the number of traces exceeds the Linux OS limit on the number of simultaneously opened files.
In order to overcome the opened files limitation imposed by the Linux OS, one may increase the limit to the maximum pos-sible value. However, this would temporarily solve the prob-lem. Instead, we propose to create archives of traces during the post-mortem phase. More precisely, we suggest to merge multiple traces into a trace archive using the litl_merge utility from LiTL. Fig. 4 illustrates the structure of the new combined trace created by litl_merge. The archives of traces preserve all information concerning each trace: headers, pairs <tid, offset>, and positioning of events chunks. They also contain new global headers that store the information regarding the amount of trace files in the archive and triples <fid, size, offset>; fid stands for a file identifier; size is a size of a particular trace file; offset holds the position of a trace file within the archive of traces. Therefore, archives of traces not only solve the FxT problem, but also make the further analysis of the applications performance more convenient. The archives can be read by litl_read and, therefore, analyzed by EZTrace.
One more useful feature provided by LiTL, which is the opposite of litl_merge, is a possibility to extract trace files from archives with the litl_split utility. This utility can
be applied when there is a need to analyze a particular trace or a set of traces among the merged ones.
VII. PERFORMANCERESULTS
When analyzing the execution of high-performance or parallel applications that generate millions of events, it is important to keep the overhead of the event recording library as low as possible. In this Section, we evaluate the performance and the overhead of both FxT and LiTL in conjunction with EZTrace on synthetic benchmarks as well as on standard application kernels.
A. Experimental Setup
We use the RWTH cluster that is composed of 60 nodes connected through DDR InfiniBand [17]. Each node is equipped with two quad-core Intel Xeon E5450 (Harpertown) processors and 16 GB of RAM. Each of the four cores on Harpertown operates at 3.0 GHz.
The RWTH cluster’s nodes execute the Scientific Linux operating system release 6.1 (Carbon) with the 2.6.32 Linux kernel. There, we installed EZTrace v.0.9 with both FxT and LiTL, the NAS Parallel Benchmarks (NPB) v.3.3, and Multi-Zone version of NPB v.3.3 (NPB-MZ). These libraries were compiled with the gcc v.4.6.1 compiler under the optimization level three enabled. To run both NPB and NPB-MZ, we use MPI from the Open MPI v.1.6.4 library.
B. Utilized Resources
To validate our optimization strategy concerning the event size and the occupied disk space, we created a synthetic benchmark and conducted a set of tests recording
• Events with various number of parameters;
• Events with a homogeneous type of parameters in order to have a better picture regarding the size of each event at the end.
Each test case (an event with fixed number of parameters of one data type) were executed 106 times, meaning that 106
events were recorded.
The results of the conducted experiments are reported in Tab. I. FxT does not make a difference between various data types and reserves the maximum amount of space for each parameter. For instance, the FxT traces composed of events with six parameters of char, int, or double data types are equal
H E A D E R
#traces fid0 size0 offset0 fid1 size1 offset1 fid2 size2 offset2
Trace0 HEADER0 EVENTS Trace1 HEADER1 EVENTS Trace2 HEADER2 EVENTS
Fig. 4:The structure of an archive composed of multiple trace files. In the figure, fid stands for the trace file name; size is the size of a merged trace file.
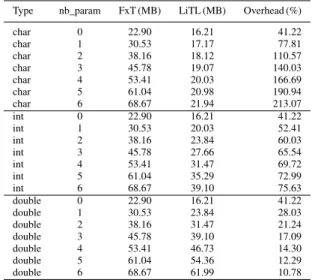
TABLE I:Information regarding trace files recorded by EZTrace with both FxT and LiTL on the Harpertown nodes. In the table, type is the data type of event’s parameters; nb_param stands for the number of parameters.
Type nb_param FxT (MB) LiTL (MB) Overhead (%) char 0 22.90 16.21 41.22 char 1 30.53 17.17 77.81 char 2 38.16 18.12 110.57 char 3 45.78 19.07 140.03 char 4 53.41 20.03 166.69 char 5 61.04 20.98 190.94 char 6 68.67 21.94 213.07 int 0 22.90 16.21 41.22 int 1 30.53 20.03 52.41 int 2 38.16 23.84 60.03 int 3 45.78 27.66 65.54 int 4 53.41 31.47 69.72 int 5 61.04 35.29 72.99 int 6 68.67 39.10 75.63 double 0 22.90 16.21 41.22 double 1 30.53 23.84 28.03 double 2 38.16 31.47 21.24 double 3 45.78 39.10 17.09 double 4 53.41 46.73 14.30 double 5 61.04 54.36 12.29 double 6 68.67 61.99 10.78
in terms of size. In contrast, LiTL uses compact storage and its traces have the following characteristics
• Only the required space for the storage is used. For example, the difference in size between traces composed of events without parameters and the ones with one parameter of type char is exactly 106. This
corresponds to the size of 106 chars;
• The occupied storage varies depending on the data type. For instance, events with one character and one integer require 18 and 21 bytes of the storage, accordingly.
C. Scalability vs. Number of Threads
In this subsection, we verify our solution on improving the scalability of EZTrace and reducing the contention while analyzing the performance of multi-threaded applications. In FxT, multiple threads within a process record events into a single buffer. This causes contention and the performance overhead, in particular on NUMA architectures. Our solution for this problem is to use multiple buffers, more precisely one buffer per thread. To validate this solution, we develop a synthetic multi-threaded program that calls repeatedly a simple
TABLE II: The average time for recording one event on the Harpertown nodes. In the table, nb_th and nb_event stand for the number of threads and events, accordingly; time is in nanoseconds; VT is a shortcut for VampirTrace.
nb_th FxT VT LiTL nb_event Overhead (%): FxT VT 1 217.40 391.19 218.19 200010 -0.36 79.29 2 488.06 395.25 220.51 400014 121.33 79.24 3 684.71 403.28 304.58 600018 124.80 32.41 4 946.51 417.12 380.10 800022 149.01 9.74 5 1385.14 418.58 397.81 1000026 248.20 5.22 6 1740.97 435.25 417.57 1200030 316.93 4.24 7 2367.40 448.07 415.44 1400034 469.85 7.85 8 3470.53 440.31 411.05 1600038 744.32 7.12
function. This function is intercepted by EZTrace and two events are recorded: the first is at the entry of the function and the second at its termination. Thus, when the function is called for numerous times, the program generates a large number of events. Since the computation are simple and fast, and the function is called by multiple threads, this test is a good model of event-intensive multi-threaded applications.
We evaluate the performance of EZTrace with both FxT and LiTL running the multi-threaded test program on the Harpertown nodes. For comparison, we also evaluate the performance of VampirTrace on the same program. Tab. II presents the average time that is required to record one event on the Harpertown nodes. When the number of threads used at the program execution increases, the time for recording an event with FxT growth rapidly. This is due to the contention between the threads that try to record events concurrently. With LiTL and VampirTrace, the average time increases, but not as dramatically as with FxT. FxT and LiTL deliver nearly the same performance for single-threaded applications. Nevertheless, the scalability of LiTL when the number of concurrent threads grows is much better, allowing LiTL to perform up to 8.4times faster.
D. Scalability vs. Number of Traces
In order to verify the scalability of both event recording libraries with the number of recorded traces, we created a simple MPI program that generates few MPI events during its execution. We ran the program using 256 MPI processes on the RWTH cluster. As a result, 256 trace files were created. Afterwards, we extracted the statistic information (the size of messages, the time spent in the communication, and the number of events handled) from the generated traces
using the eztrace_stats utility from EZTrace. At first, eztrace_statsperformed well on the 256 traces for both FxT and LiTL. Then, we decreased the limit on the number of simultaneously opened files from 1024 to 200 using the ulimitcommand and repeated the experiment. At this time, eztrace_statswas not able to gather the statistic informa-tion with both event recording libraries. In order to overcome this limit, we applied litl_merge and combined traces into two archives; each of them stores equal amount of traces. Consequently, we succeeded with the performance analysis of the program using EZTrace with LiTL. The same technique is applicable for eztrace_convert, which produces traces in different formats. Moreover, EZTrace supports analysis of both traces and archives of traces mixed together.
E. NAS Parallel Benchmarks (NPB)
To evaluate the overhead of both FxT and LiTL within EZTrace on more realistic scenario, we measure their per-formance for NAS Parallel Benchmarks (NPB). NPB is a set of computation kernels derived from computational fluid dynamics applications to evaluate performance of parallel and high-performance applications. Later, the benchmark suite was extended including new kernels, e.g. for parallel I/O and computational grids. The problem sizes of those kernels are predefined and divided into eight classes; this value depends upon the kernel [18].
We conducted our experiments using 64 computing pro-cesses for problems from the class C, which are already decent to make the CPUs busy with the computations and also to generate a good amount of events. The MPI functions of the NPB kernels were instrumented with EZTrace and recording events was performed with both FxT and LiTL. Each benchmark was executed at 10 times and then the median time was selected.
TABLE III: The time measurements of NPB-MPI running for CLASS C problems with 64 computing processes on the Harpertown nodes. In the table, the time is in seconds.
Bench NPB FxT LiTL Events / sec Overhead (%): FxT LiTL BT 53.75 51.29 53.31 65689 -4.58 -0.82 MG 7.23 7.06 7.28 185491 -2.35 0.69 LU 46.07 44.73 47.03 810584 -2.91 2.08 FT 22.78 22.66 22.92 3681 -0.53 0.61 IS 2.04 1.97 2.01 36619 -3.43 -1.47 SP 80.31 77.13 76.98 58756 -3.96 -4.15 CG 29.47 27.29 29.40 223701 -7.40 -0.24 EP 4.99 4.98 5.07 1286 -0.20 1.60
Tab. III presents the time measurements: the median ex-ecution time and the overhead of both FxT and LiTL from the raw NPB execution. The raw as well as the instrumented kernels show the fluctuation in the measurements. This is an explanation for the negative time overhead. Nevertheless, the timings show that instrumenting the NPB kernels with EZTrace using both FxT and LiTL has small or even negligible impact on the performance: for all experiments EZTrace is within the raw execution. The variation of the execution time using LiTL, in most cases, is within 2 %. Furthermore, these experiments demonstrate – especially the MG, LU, and CG kernels that generate a large number of events per second –
that the instrumentation of the event-intensive applications is not harmful for their performance.
TABLE IV: The results tracing NPB-MPI running for CLASS C problems with 64 computing processes on the Harpertown nodes.
Bench Events / sec FxT (MB) LiTL (MB) Size difference (%) BT 68952 152.66 112.86 35.27 MG 189542 45.68 32.15 42.08 LU 838890 1866.43 1244.55 49.97 FT 3820 0.98 0.36 171.32 IS 35384 0.80 0.24 228.56 SP 60699 369.22 267.87 37.84 CG 236682 283.63 201.40 40.83 EP 1405 0.61 0.11 439.40
The second table, Tab. IV, shows another performance metric that we used – the size of the generated traces. For the kernels that produce few events (such as FT, IS or EP), the size of traces recorded by LiTL is much smaller than of the FxT traces. The main reason for that is the header size that is relatively small for the LiTL traces. In case of the larger traces as the ones produced for LU, BT, SP or CG, the size of the header is negligible. For these kernels, the trace produced with FxT are up to 50 % larger than the LiTL traces. LiTL generates smaller traces because of the way it stores the events parameters: while FxT uses 8 bytes per parameter, LiTL only allocates the required number of bytes. The amount of the saved disk space thus depends on the number of events parameters and their type.
F. NPB-MZ
In addition, we conducted a set of experiments using the NPB-MZ kernels that combine OpenMP and MPI program-ming models. The combination of these programprogram-ming models often occurs in practice in order to enhance the application per-formance and efficiently utilize multi-core nodes on standard clusters.
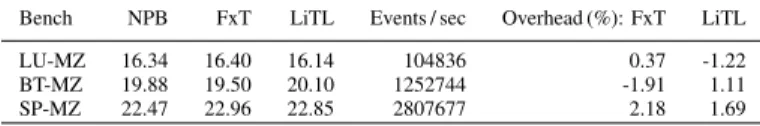
Tab. V presents the results of NPB-MZ-MPI benchmarks on the cluster composed of 16 Harpertown nodes. One MPI process runs on each node and 8 OpenMP threads exploit the available cores within a node. As for the NPB kernels, the EZTrace instrumentation in conjunction with both FxT and LiTL results in small performance overhead. LiTL delivers nearly the same or sometimes event better, e.g. for the SP-MZ kernel, performance as FxT. Besides, the traces produced by LiTL are much smaller in size.
TABLE V: The time measurements of NPB-MZ-MPI running for CLASS C problems with 16 MPI processes and 8 OpenMP threads on the Harpertown nodes. In the table, the time is in seconds.
Bench NPB FxT LiTL Events / sec Overhead (%): FxT LiTL LU-MZ 16.34 16.40 16.14 104836 0.37 -1.22 BT-MZ 19.88 19.50 20.10 1252744 -1.91 1.11 SP-MZ 22.47 22.96 22.85 2807677 2.18 1.69
VIII. CONCLUSIONS ANDFUTUREWORK
In order to analyze HPC applications, there is a need for performance analysis tools with low overhead. The efficiency
of such tools strongly depends on two factors: the instrumenta-tion of funcinstrumenta-tions applied and the event recording library used. In this article, we focus on the latter issue and develop our own library named LiTL – a lightweight library for recording events – taking into account the advantages and limitations of FxT. In LiTL, we applied several optimization strategies: reducing the storage of events and traces; improv-ing the scalability when a large number of threads record events concurrently; enabling performance analysis of parallel applications that produce hundreds or thousands of traces. These mechanisms are implemented in the LiTL library that is integrated in the EZTrace framework for performance analysis. To evaluate the efficiency of LiTL, we conduct a set of experiments using synthetic and standard benchmarks. We compare the LiTL performance results with the ones from FxT; both event recording libraries are used within the EZTrace framework. For all test cases, LiTL either perform as good as FxT leading to low overhead or often show better results. For instance, with LiTL the size of traces is reduced up to 68 % and it also saves up to 88 % of the CPU time, especially, on multi-threaded applications. Our experiments were conducted using LiTL within EZTrace, however it is a general event recording library that can be used in conjunction with any other performance analysis tool.
Our future focus will be on integrating the litl_merge utility into the event recording process in order to produce automatically an archive of traces during the execution of the application. To reduce even more the size of the generated traces, we plan to add a compression mechanism to LiTL. Also, we aim at designing EZTrace plugins for programming models for accelerators such as CUDA and OpenCL. As new energy efficient architectures appeared, e.g. Intel Phi and Kalray Multi-Purpose Processor Array (MPPA), we plan to port both EZTrace and LiTL there.
ACKNOWLEDGMENTS
We would like to thank the AICES Graduate School and the Center for Computing and Communication of RWTH Aachen University for the provided resources.
REFERENCES
[1] C. Aulagnon, D. Martin-Guillerez, F. Rue, and F. Trahay, “Runtime function instrumentation with EZTrace,” in Proceedings of the PROPER – 5th Workshop on Productivity and Performance, Rhodes, Greece, August 2012.
[2] V. Danjean, R. Namyst, and P.-A. Wacrenier, “An efficient multi-level trace toolkit for multi-threaded applications,” in Proceedings of the 11th international Par conference on Parallel Processing, ser. Euro-Par’05. Berlin, Heidelberg: Springer-Verlag, 2005, pp. 166–175. [3] A. Chan, W. Gropp, and E. L. Lusk, “An efficient format for nearly
constant-time access to arbitrary time intervals in large trace files,” Scientific Programming, vol. 16, no. 2-3, pp. 155–165, 2008. [4] S. Decugis and T. Reix, “NPTL Stabilization Project,” in Linux
Sym-posium, vol. 2, 2005, p. 111.
[5] J. Caubet, J. Gimenez, J. Labarta, L. D. Rose, and J. S. Vetter, “A Dynamic Tracing Mechanism for Performance Analysis of OpenMP Applications,” in OpenMP Shared Memory Parallel Programming, International Workshop on OpenMP Applications and Tools, WOMPAT 2001, West Lafayette, IN, USA, July 30-31, 2001, pp. 53–67.
[6] M. S. Müller, A. Knüpfer, M. Jurenz, M. Lieber, H. Brunst, H. Mix, and W. E. Nagel, “Developing scalable applications with vampir, vampirserver and vampirtrace,” in Parallel Computing: Architectures, Algorithms and Applications, ParCo 2007, Forschungszentrum Jülich and RWTH Aachen University, Germany, 4-7 September, 2007, pp. 637– 644.
[7] S. S. Shende and A. D. Malony, “The Tau Parallel Performance System,” Int. J. High Perform. Comput. Appl., vol. 20, no. 2, pp. 287–311, May 2006.
[8] V. Pillet, J. Labarta, T. Cortes, and S. Girona, “Paraver: A tool to visualize and analyze parallel code,” in Proceedings of WoTUG-18: Transputer and occam Developments, vol. 44, 1995, pp. 17–31. [9] M. Geimer, F. Wolf, B. J. N. Wylie, E. Ábrahám, D. Becker, and
B. Mohr, “The Scalasca performance toolset architecture,” Concurrency and Computation: Practice and Experience, vol. 22, no. 6, pp. 702–719, 2010.
[10] A. Knüpfer, R. Brendel, H. Brunst, H. Mix, and W. E. Nagel, “Introduc-ing the open trace format (otf),” in Computational Science – ICCS 2006. Lecture Notes in Computer Science, 2006, vol. 3992, pp. 526–533. [11] D. Eschweiler, M. Wagner, M. Geimer, A. Knüpfer, W. E. Nagel, and
F. Wolf, “Open trace format 2-the next generation of scalable trace formats and support libraries,” in Applications, Tools and Techniques on the Road to Exascale Computing, Proceedings of the conference ParCo 2011, Ghent, Belgium, 2011, pp. 481–490.
[12] B. de Oliveira Stein, J. C. de Kergommeaux, and G. Mounié, “Pajé trace file format,” Tech. Rep., February 2013, http://paje.sourceforge. net/publications.html.
[13] K. Coulomb, M. Faverge, J. Jazeix, O. Lagrasse, J. Marcoueille, P. Noisette, A. Redondy, and C. Vuchener, “ViTE – Visual Trace Explorer,” available via the WWW. Cited 07 April 2013. http://vite. gforge.inria.fr/index.php.
[14] L. M. Schnorr, G. Huard, and P. O. Navaux, “Triva: Interactive 3d visualization for performance analysis of parallel applications,” Future Generation Computer Systems, vol. 26, no. 3, pp. 348–358, 2010. [15] F. Trahay, F. Rue, M. Faverge, Y. Ishikawa, R. Namyst, and J. Dongarra,
“EZTrace: a generic framework for performance analysis,” in Proceed-ings of the IEEE/ACM International Symposium on Cluster, Cloud and Grid Computing (CCGrid), Newport Beach, CA, USA, May 2011. [16] E. Agullo, J. Demmel, J. Dongarra, B. Hadri, J. Kurzak, J. Langou,
H. Ltaief, P. Luszczek, and S. Tomov, “Numerical linear algebra on emerging architectures: The PLASMA and MAGMA projects,” Journal of Physics: Conference Series, vol. 180, 2009.
[17] D. an Mey, C. Terboven, P. Kapinos, D. Schmidl, S. Wienke, T. Cramer, and M. Wirtz, “The RWTH HPC-Cluster User’s Guide: Version 8.2.4,” Oct. 2012, available via the WWW. Cited 24 June 2013. http://www. rz.rwth-aachen.de/ca/c/pil/.
[18] NASA Advanced Supercomputing Devision, “NAS Parallel Bench-marks,” available via the WWW. Cited 07 April 2013. http://www. grid5000.fr.