HAL Id: hal-02192742
https://hal.archives-ouvertes.fr/hal-02192742
Preprint submitted on 24 Jul 2019
HAL is a multi-disciplinary open access
archive for the deposit and dissemination of
sci-entific research documents, whether they are
pub-lished or not. The documents may come from
teaching and research institutions in France or
abroad, or from public or private research centers.
L’archive ouverte pluridisciplinaire HAL, est
destinée au dépôt et à la diffusion de documents
scientifiques de niveau recherche, publiés ou non,
émanant des établissements d’enseignement et de
recherche français ou étrangers, des laboratoires
publics ou privés.
Crystal plasticity modeling of the cyclic behavior of
polycrystalline aggregates under non-symmetric uniaxial
loading: Global and local analyses
Harris Farooq, Georges Cailletaud, Samuel Forest, David Ryckelynck
To cite this version:
Harris Farooq, Georges Cailletaud, Samuel Forest, David Ryckelynck. Crystal plasticity modeling of
the cyclic behavior of polycrystalline aggregates under non-symmetric uniaxial loading: Global and
local analyses. 2019. �hal-02192742�
Crystal plasticity modeling of the cyclic behavior of polycrystalline
aggregates under non-symmetric uniaxial loading: Global and local analyses
Harris Farooq, Georges Cailletaud, Samuel Forest∗, David Ryckelynck
MINES ParisTech, PSL University, Centre des mat´eriaux, CNRS UMR 7633, BP 87 91003 Evry, France
Abstract
When a geometry is cyclically loaded under a mean stress or strain, incremental strain ratcheting or mean stress relaxation are observed. Experiments shows that for metallic materials there is non-zero mean stress as well as saturation of macroscopic strain ratcheting, and most macroscopic models produce both quantities in excess. Little attention has been paid to model such phenomena using polycrystal aggregates especially going up to the regime of cyclic mechanical stability. In this paper it will be shown that the interaction between different grains is enough to cater for such complex phenomena using crystal plasticity models for FCC crystals. Light will be shed on how different regions accommodate each other and how the classical definition of constant rate strain ratcheting or a zero mean stress is nearly impossible in a virtual polycrystal. More importantly, it will be shown that even if there is a macroscopic stable hysteresis stress strain loop, local stabilization is not guaranteed. The distribution of different constitutive quantities within a polycrystal are also analyzed which give a new insight into what is happening inside a polycrystal. Specifically, within a polycrystal, accumulated plasticity divides into two parts, and it is postulated that this division of plasticity gives the material its capability to retain its cyclic mean stress or a saturating ratcheting strain. Two numerical tests to detect strain ratcheting will also be presented. To go up to asymptotic values, as well as to get an unbiased solution a strictly rate-independent model will be used. Keywords: Multiscale modeling, Crystal plasticity, Finite Element, CPFEM, Ratcheting, Mean stress relaxation, Strain distribution, Fatigue
1. Introduction
Most metallic materials have a heterogeneous microstructure, and this local disorder results in specific mechanical properties. Several studies have already been undertaken to link micro-macro properties of metals (Barbe et al., 2001; Dunne et al., 2007; Zhang et al., 2007, 2016; Guilhem et al., 2018), but how local properties affect macroscopic properties is still not fully understood. In particular, the behavior of metallic materials under cyclic loading conditions (Ghorbanpour et al., 2017; Smith et al., 2018; Yu et al., 2013) is still the subject of considerable attention. This paper explores two topics, namely ratcheting and mean stress relaxation in polycrystal aggregates under cyclic loading. Both phenomena result from asymmetric cyclic loading conditions. For example, asymmetric stress-controlled uniaxial cyclic loading can result in strain ratcheting, i.e. a progressive, incremental inelastic deformation leading to a shift of the stress-strain hysteresis loop along the strain axis (Kang et al., 2010; Fournier and Pineau, 1977; Ohno et al., 1998; Jiang and Sehitoglu, 1994; Hassan and Kyriakides, 1994a; Portier et al., 2000; Hassan and Kyriakides, 1994b). For instance, it is widely known that increasing the stress amplitude under a constant non zero mean stress or increasing the applied mean stress under a given stress amplitude, both increase the rate at which the material ratchets (Goodman, 1984). On the other hand, experimental observations indicate levels
∗Corresponding author. Tel.:+33 160763051
of mean stress for which there is very low ratcheting and the mechanical state of the material converges towards plastic shakedown (Pellissier-Tanon et al., 1982). Similarly, for asymmetric strain controlled loading conditions, a cyclic mean stress is observed, and several experimental studies (Wehner and Fatemi, 1991; Nikulin et al., 2019; Prithivirajan and Sangid, 2018) have deciphered the corresponding physical mechanisms. These observations show that for a given positive mean strain, and a low strain amplitude, the mean stress does not completely relax to zero. Also, increasing the strain amplitude leads to a nonlinear decrease of the mean stress until it finally vanishes (Arcari et al., 2009). From a modeling perspective, the mechanical cyclic response is sensitive to the strain path and is driven by the Bauschinger effect, as modeled by Chaboche (1986, 1989). Classical macroscopic models (Chaboche, 1989) predict an excess of strain ratcheting as well as mean stress. Some researchers have proposed to introduce additional kinematic and isotropic hardening terms (Chaboche et al., 2012), resulting in numerous material parameters to be calibrated. Any change in the material requires recalibration of parameters. Also, no microstructural characteristics of the underlying material are captured by such phenomenological models, which inhibits further inspection of the physics of deformation of the material. Crystal plasticity models coupled with computational homogenization, on the other hand, offer a way to link cyclic micro-macro properties of metallic materials (Shenoy et al., 2008). The deformation behavior of a single crystal at the slip system level is used to determine the properties of polycrystalline aggregates using representative volume elements. This procedure, although phenomenological at constitutive single crystal level, provides a realistic insight into what is happening within a polycrystal as shown by comparison between simulations and strain field measurements (Zhao et al., 2008; Zaafarani et al., 2006).
Xie et al. (2004) and Sinha and Ghosh (2006), followed by Dingreville et al. (2010), were among the first authors to use polycrystalline aggregates coupled with CPFEM to model ratcheting. These researchers simulated the first few cycles and then extrapolated their results to larger cycle numbers. More recently, Hennessey et al. (2017) and Cruzado et al. (2017) proposed to change the kinematic hardening law from an Frederick and Armstrong (2007) formulation to a modified Ohno and Wang (1993) type law. Hennessey et al. use an accelerated simulation and run the simulation for a hundred cycles, while Cruzado et al. resort to a cycle jump technique (Cruzado et al., 2012; Azzouz et al., 2010; Mary and Fouvry, 2007) to extrapolate the constitutive response. Both groups focus on the macroscopic properties of the aggregate rather than on local stress and strain distributions. The main limitations of all the conducted studies are that local heterogeneities and the physics behind these phenomena are neglected in favor of focusing on the macroscopic stability of the stress-strain hysteresis loop. Attention is paid essentially to matching simulation and experimental results at the macroscopic level. In the recent contribution by Colas et al. (2019) the authors evidence local ratcheting phenomena in a polycrystalline aggregate under symmetric strain loading conditions. Local ratcheting phenomena are found to be more pronounced at a free surface than in the bulk. The analysis is however limited to one single realization, without statistical considerations. The objective of the present work is to show that simulations of polycrystalline aggregates based on the most simple crystal plasticity laws can reproduce the main phenomenological features of asymmetric cyclic uniaxial plasticity and to correlate them with the stress and strain distributions inside the aggregates. As stated earlier, the driving force for strain ratcheting and cyclic mean stress relaxation is the Bauschinger effect, which in a modeling perspective is governed by kinematic hardening. Kinematic hardening controls the ratcheting behavior as well as mean stress relaxation in structural components. Isotropic hardening, on the other hand, decreases the rate of plastic strain evolution per cycle. Single crystal behavior exhibits isotropic hardening effects due to multiplication and interaction of dislocations, as well as kinematic hardening as a result of polarization of dislocation structures M´eric et al. (1994). In a polycrystal, the cyclic response results from these two hardening components inside the grains and from the intergranular interactions. Hence, to assess these complex mechanisms, a very simple constitutive law is retained at the single crystal level for the systematic study of the present work. It is first limited to purely kinematic hardening. This is a simplification which complies with usual observations that isotropic hardening remains very limited in metallic materials used for engineering purposes such as nickel-based superalloys under cyclic loading, which is the target material class of the present work (Chaboche et al., 2012). A rate–independent crystal plasticity model formulation is used to avoid the contamination of the final results by viscosity effects. The selected crystal plasticity model by (Forest and Rubin, 2016) exhibits a smooth elasto-plastic transition and
is strictly rate-independent. In what follows, finite element simulations of polycrystalline aggregates will be shown to provide a realistic description of ratcheting and mean stress relaxation in face centered cubic (FCC) metals, without resorting to complex memory variables in contrast to macroscopic approaches. Two types of materials are taken into account, one with a low hardening limit and high yield strength similar to Nickel base superalloys, and a second one with stronger hardening and a low yield strength as seen in copper based alloys as a reference (Siska et al., 2007). Finally, the results are analyzed along two lines, i.e. at the macroscopic scale first and then at the local scale looking at field variables influencing the phenomena. In this article it is shown that without changing the constitutive equation, a polycrystal can mimic exper-imental response. Macroscopic averaged results are shown to reproduced different regimes observed while asymmetrically cycling a metallic material. Diagrams are also built to characterize ratcheting and cyclic mean stress relaxation both in single as well as polycrystals. Local analyses of the results then sheds light on the microstructural response of the polycrystal. More specifically, trends in the evolution of plasticity are shown in the entire microstructure with the help of probability density plots. These plots are then analyzed and concrete statistical conclusions are drawn for the first time to answer why a polycrystal stops ratcheting or retains a cyclic mean stress.
The paper is organized in the following manner. In Section 2 the crystal plasticity material model is formulated. Section 3 presents the finite element model, material parameters, as well as the physical aspects of the microstructure. Results and discussions are provided in Sections 4, regarding macroscopic aspects, and 5, regarding local stress and strain fields. They are followed by the conclusions in Section 6.
2. Crystal plasticity model
In the present work a small strain crystal plasticity formulation is used for the computation as most local strains remain below 5%. Each grain is considered as an initially homogeneous single crystal. To ease the interpretation of the numerical results, a rate–independent formulation is selected, using the single crystal plasticity model recently proposed by Forest and Rubin (2016). An advantage of using a rate–independent model coupled with a small strain assumption is the numerical efficiency which is crucial when simulating hundreds of cycles under various load amplitudes. In addition, it has been decided to use exclusively kinematic hardening because it governs ratcheting and mean stress relaxation. Face centered cubic (fcc) single crystal metallic materials comprising n plastic slip systems, each having a slip system direction `s and a normal to the slip plane nsare considered. The partition of the strain tensor introduces elastic and plastic parts:
ε = εe+ εp (1)
The Hooke law relates the stress tensor to the elastic strain tensor. For cubic elasticity, a fourth rank tensor of elastic moduli C, involving three independent parameters, governs the elastic behavior:
σ = Cεe (2)
The plastic strain rate results from the slip processes with respect to all active slip systems,
˙ εp= n X s=1 ˙γsms (3)
with ms being the Schmid orientation tensor defined as
ms= 1 2(` ⊗ n
s+ n ⊗ `s) (4)
The amount of slip on each slip system is denoted by the variable γs. The driving force for plastic slip on
slip system s is the resolved shear stress, computed using the Cauchy stress tensor (σ) according to:
The yield criterion is a generalization of Schmid’s law involving scalar hardening variables rsand xsaccording
to M´eric et al. (1991).
fs(σ, xs, rs) = |τs− xs| − rs (6)
Here, rsdenotes the radius of the elastic domain and xsis a scalar back-stress characterizing the center of
the elastic range in the one-dimensional space of resolved shear stresses. In slip based crystal plasticity, there are n such elastic ranges. Plastic slip can occur only if the function fs becomes positive. The viscoplastic
flow rule given by M´eric and Cailletaud (1991), is proposed in terms of the viscosity parameters, K and n: ˙γs= f
s
K n
sign(τs− xs) (7)
with the Macaulay brackets < x >= Max(x, 0). In the present work following Forest and Rubin (2016), the rate of slip on each slip system is replaced by a rate-independent formulation of the form:
˙γs= ˙ε f
s
K
sign(τs− xs) (8)
where K is a positive constant having now the unit of stress and ˙ε is a non-negative homogeneous function of order one in the total strain rate. In this model, ˙ε is taken to be the total equivalent distortional strain rate: ˙ ε = r 2 3ε˙ 0: ˙ε0, ε˙0 = ˙ε −1 3(trace( ˙ε))1 (9)
where ε0is the deviatoric part of the total strain rate tensor ˙ε and 1 the unit. Since the rate of inelasticity is linear in the total equivalent strain rate ˙ε, all the evolution equations in the proposed theory are homogeneous of order one in time, characterizing a rate-independent response. Also, the rate of inelasticity is used for all states entailing no need for special treatment of loading and unloading conditions. In particular no consistency condition is needed in contrast to standard rate–independent plasticity. The amplitude of the overstress is controlled by the value of parameter K. It tends to zero for vanishing values of K. There is no indeterminacy in the selection of active slip systems according to the present model. The functional form of f and the evolution equations for isotropic (rs) as well as kinematic (xs) hardening remain unchanged
compared to the original model (M´eric and Cailletaud, 1991). The accumulated slip variable vs is defined
for each slip system by the following evolution equation:
˙vs= | ˙γs| (10)
The evolution equations for the kinematic hardening variable is taken from M´eric et al. (1991) and Busso and Cailletaud (2005) without modification. The nonlinear kinematic hardening evolution law
˙
xs= C ˙γs− D ˙vsxs (11)
depends on two material parameters, C and D. In the present paper, there is no isotropic hardening so that the variable rshas a constant value r0, which corresponds to the initial resolved shear stress.
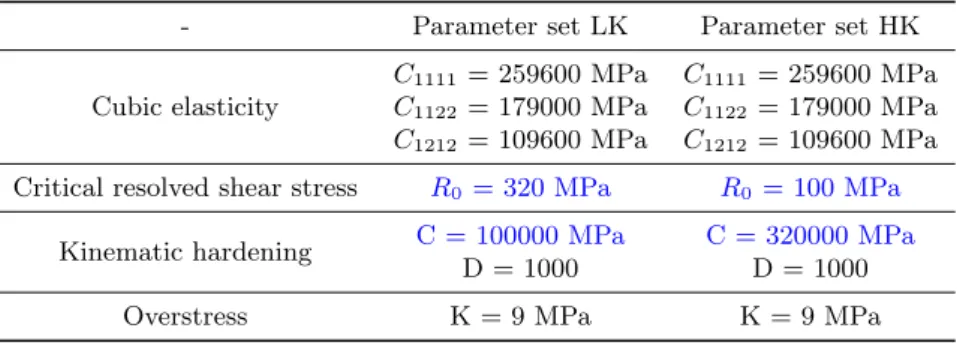
Two crystal plasticity parameter sets were chosen, as stated in table 1, where the saturated resolved shear stress is the same (i.e. r0 + C/D = 420 MPa for both parameter sets); The difference however lies in
the flipping of kinematic hardening and initial critical resolved shear stress. Parameter set ’LK’ has a low kinematic hardening but a high initial critical resolved shear stress resembling aerospace alloys such as Inconel where the saturated value of the kinematic hardening variable is around one third of the initial yield stress. Parameter set ’HK’ resembles an alloy with a low yield stress and a strong hardening such as copper where the saturated value of the kinematic hardening variable is three times that of the initial yield stress (Siska et al., 2007).
3. FE model description
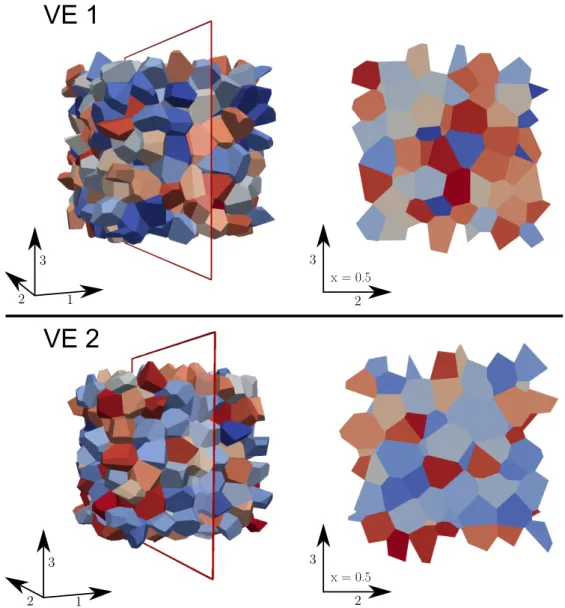
The numerical model was implemented in the implicit finite element solver Z–set package (2013). Liter-ature findings show that the macroscopic representation of a micro-heterogeneous metallic material can be achieved with as few as one hundred grains (Barbe et al., 2001; Kanit et al., 2003), but matching macroscopic properties is not the goal. The goal here is to have a large enough statistical database so that local material response can be analyzed. Of course computational limitations have to be acknowledged and extremely large polycrystals cannot be used. For this reason the microstructure generated is called a volume element (VE) as opposed to representative volume element (RVE). Two aggregates containing equiaxed grains, re-spectively called VE1 and VE2, were generated using the Voronoi tessellation technique with the help of the software VORO++ (Rycroft, 2009). A periodicity constraint was applied to obtain periodic microstructures. The software Gmsh was used to mesh both geometries, enforcing conditions of periodicity for the obtained meshes. Both aggregates contain 300 grains and reduced quadratic tetrahedral elements C3D10. The mesh of VE1 contains 194903 nodes and 130171 elements whereas the mesh of VE2 is made of 192042 nodes and 128166 elements (see figure 1 (a) and (d)). Each tetrahedral finite element has 10 nodes and 4 Gauss points. The grain sizes in both VEs (as seen in figure 1 (b) and (e)), have a normal distribution with the crystal orientations uniformly distributed in the polycrystal (figure 1 (c) and (f)).
- Parameter set LK Parameter set HK
Cubic elasticity
C1111 = 259600 MPa C1111= 259600 MPa
C1122 = 179000 MPa C1122= 179000 MPa
C1212 = 109600 MPa C1212= 109600 MPa
Critical resolved shear stress R0 = 320 MPa R0 = 100 MPa
Kinematic hardening C = 100000 MPa C = 320000 MPa D = 1000 D = 1000 Overstress K = 9 MPa K = 9 MPa
Table 1: Crystal plasticity parameters used for both parameter sets. The saturated resolved shear stress is the same for both parameter sets; The difference being that parameter set LK has a low kinematic hardening and high critical resolved shear stress and vice versa.
Figure 1: 300 grain polycrystals for the FE simulations, along with the inverse pole figures of the crystallographic orientations used in the VEs
Computational requirements
The implicit finite element code (Z–set package, 2013) is used to solve the problem. The global equilibrium is solved using a Newton-Raphson algorithm. Integration of constitutive equations at the Gauss points is performed using the second order Runge-Kutta method with automatic time stepping (Besson et al., 2009). For a crystal plasticity simulation, loading one job of the present size requires 31.5 gigabytes RAM. The MPI parallel computing algorithm implemented in Zebulon is used with 4 processors for each job. Each job requires around 24 hours to complete one cycle and to run one hundred cycles, it required 100 days each. More than 320 simulations are being post-processed for this paper, while the actual number of calculated test cases is at least fifty times more than this. Given the number of degrees of freedom of each mesh and the cyclic nature of the problem, data of more than 20 TBytes were generated.
Boundary conditions
In the article, ε will be used to refer to the local strain tensor, and E will point to the macroscopic symmetric second-rank strain tensor defined as the average strain over the whole volume:
< ε >= 1 V
Z
V
εdV = E (12)
Similarly, σ will be the local stress tensor and the macroscopic stress Σ will be defined as its spatial average as follows: < σ >= 1 V Z V σdV = Σ (13)
Periodic boundary conditions were prescribed on the VEs such that the displacement vector field u over the entire volume takes the form:
u = E .x + v ∀x ∈ V (14)
where the fluctuation v is periodic. This fluctuation takes the same value for each pair of homologous points at ∂V . Anti-periodic boundary conditions are prescribed to the traction vector σ.n where n is the outer normal to ∂V at x . The displacement and traction vectors are assumed to be continuous at the grain boundaries. For strain ratcheting, a macroscopic stress (Σ11) was imposed, whereas for mean stress
relaxation a macroscopic strain (E11) was imposed on all elements of the finite element mesh. In both cases,
the remaining mean stress components are fixed to zero.
4. Results at macroscopic scale
This section presents the results obtained at a global level by averaging the stress and strain fields on the whole aggregate. Two loading types are investigated leading to ratcheting and mean stress relaxation respectively. In each case, the response obtained with a single crystal is given as an elementary reference. 4.1. Ratcheting in single crystals
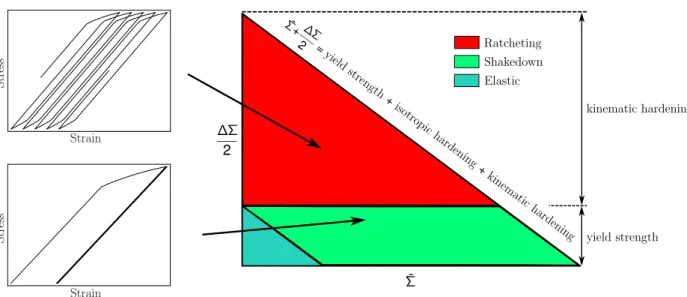
The simulations of this subsection are performed at the material point level assuming homogeneous deformation. A uniaxial cyclic stress was imposed on the material element. Depending on the stress amplitude (∆Σ/2) and the mean stress ¯Σ, the resulting cyclic behavior can be broken down into three distinct responses i.e. elasticity, elastic shakedown and ratcheting. Figure 2 depicts these regimes in a stress amplitude (∆Σ/2 = (Σmax− Σmin)/2) vs mean stress ( ¯Σ = (Σmax+ Σmin)/2) diagram. From figure 2, it
can be seen that elastic shakedown refers to the material deforming plastically during the first few cycles and the subsequent response being elastic. Ratcheting in a single crystal is the progressive accumulation of strain per cycle without stopping, as signified by the red region. So depending on the loading type, a single crystal is bound to either ratchet or elastically shakedown. A missing region, as opposed to experimental observations, is that of plastic shakedown, which refers to an open stress-strain hysteresis loop which does not move forward on the strain axis. These three regimes can be classified as follows:
• Elastic if ∆Σ/2 is smaller than the yield strength
• Shakedown if ∆Σ/2 is smaller than the combination of the yield strength and the saturated isotropic hardening
• Ratcheting if ∆Σ/2 is greater than the combination of the yield strength and the saturated isotropic hardening
Figure 2: Under asymmetric load control, the single crystal response which shows three distinct regions i.e. elastic, shakedown and ratcheting
4.2. Ratcheting in polycrystals
A periodic macroscopic stress (Σ11) was imposed on polycrystalline volume element periodic boundary
conditions. Two stress strain curves pertaining to the two parameter sets are shown in figure 3. The boundary conditions for both simulations are kept the same where Σmax= 1020 MPa and RΣ= −0.7 and
the first ten cycles are plotted for both simulations. From the plot it can be seen that the curve for parameter set HK ratchets much more than the curve for parameter set LK because of the presence of a much higher kinematic hardening in the former.
0.0 0.5 1.0 1.5 2.0 2.5 750 500 250 0 250 500 1000 3.0 3.5 750
Figure 3: For an asymmetric load controlled test, stress (Σ11) vs strain (E11) curves for both parameter sets. The loading
conditions are kept the same for both i.e. Σmax= 1020MPa and RΣ= −0.7. Only the first ten cycles are plotted in each case.
estimation of what is ratcheting and what is shakedown. The same argument is valid for tests done at different amplitudes or loading ratios. Also, for a polycrystal, no matter how high the applied loading, the increment in accumulated strain ∆E = En+1− En always tends to decrease. This calls for the formulation of a robust
test for discriminating ratcheting from shakedown. A test is proposed such that the delta accumulated strain per cycle is plotted (∆E11) against the number of cycles and identified with a power law series in the form:
E11(N ) = A N X n=1 1 nα (15)
where α is the slope of the series. The condition α < −1 is required for the power law series to converge. It follows that
the test series (
converges, if α < −1.
diverges, if α ≥ −1. (16)
The left plot in figure 4 shows 3 simulations that were run for parameter set LK for three different stress amplitudes. For comparison, a slope of -1 is also plotted on the left corner. The series test was performed after running the simulations for a hundred cycles each. There is a clear difference between a curve that will converge (shakedown) or one that will diverge (ratchet). As a second criterion, the second derivative at cycle 100 is also computed for all curves which indicates the convexity (ratcheting) or concavity (shakedown) of the curves. After applying the convergence or divergence criteria, the converging test cases are broken into two parts depending on whether or not the width of the stress strain loop is open or closed at cycle 100. An open loop signifies that there is plastic shakedown, whereas a closed loop points to elastic shakedown. A small offset of tolerance is needed to establish what is meant by a closed loop. In the present work, the tolerance for the width of the loop at its mean stress is set to be δ = 1.0 × 10⁻⁶. The right hand plot in figure 4 shows the macroscopic stress vs strain response for three selected cases at the first and at the hundredth cycle. It can already be established that the red curves are diverging while the green and blue curves are converging. Multiple simulations are run, on the polycrystal aggregates, at various load amplitudes and mean stresses for a hundred cycles each. Then the evolution of macroscopic strain in each simulation is assessed using the series comparison test, and a diagram similar to that of figure 2 is drawn for four cases i.e. for both VEs and for both parameter sets. Figure 5 shows that this diagram differs from the single crystal case. Four regions can be seen i.e. elastic, elastic shakedown, plastic shakedown and ratcheting instead of three in the single crystal case. The elastic region is determined using the plasticity criterion for metals of a yield strength of 0.2% plastic strain Ep, and is characterized by the gray region. The maximum stress limit for
the polycrystal is computed by applying a macroscopic strain of 4%, the resulting stress being taken to be the limit above which the material cannot be loaded i.e. the top and bottom right corner of each plot in figure 5. In the same figure, the dots are found to segregate into three regions, namely elastic shakedown, plastic shakedown and ratcheting respectively. For parameter set LK, the region in which ratcheting and plastic shakedown occur is very small because of the low kinematic hardening. Parameter set HK, on the other hand, leads to a much larger region for plastic shakedown and ratcheting. It should however be noted that the diagrams of figure 5 (a) and (b), as well as (c) and (d) are very similar signifying that it is both VEs can be regarded as representative microstructures capable of reproducing the typical cyclic mechanical behavior of the material.
0.0 0.5 1.0 750 500 250 0 250 500 750 1000 0.0 0.5 1.0 1.5 2.0 2.5 750 500 250 0 250 500 750 1000 101 102 108 107 106 105 104 103
Figure 4: For asymmetric load controlled tests, the left figure shows the evolution of the ratcheting strain increment as a function of cycle number for 3 polycrystal simulations using parameter set LK, with three different stress amplitudes. The macroscopic stress (Σ11) vs strain (E11) plot is shown on the right for three simulations showing the cyclic response at cycles
1 and 100. The simulations selected illustrate the elastic shakedown, plastic shakedown and ratcheting phenomena.
0 200 400 600 800 1000 0 200 400 600 800 1000 0 200 400 600 800 1000 0 200 400 600 800 1000 0 200 400 600 800 1000 0 200 400 600 800 1000 0 200 400 600 800 1000 0 200 400 600 800 1000
Figure 5: Ratcheting in polycrystals (a) VE 1 and parameter set LK, (b) VE 2 and parameter set LK, (c) VE 1 and parameter set HK, (d) VE 2 and parameter set HK.
4.3. Mean stress relaxation in single crystals
Under asymmetric cyclic strain control, the mean stress relaxes to a certain value when increasing the cycle number. At the macroscopic level, this mean stress ¯Σ11, defined as (Σmax+ Σmin)/2, where Σmax
and Σmin are the maximum and minimum stresses under peak strains. In this case, a single crystal cyclic
response can be broken down into three distinct scenarios which are represented in figure 6 (a) and (b). Focusing on figure 6 (a), the first scenario shows the elastic regime where cyclic loading will have no effect on the cyclic mean stress redistribution. To remain in this regime plasticity has to be avoided i.e. the applied maximum strain (Emax) should be:
Emax<
Σy
Y , (17)
where Σy is the stress at which yielding starts and Y is the Young’s modulus of the single crystal in the
loading direction. Next, in the second scenario plasticity is observed only during the first tensile loading but upon unloading immediately after, elastic response is observed in the following cycles. To characterize the second scenario, the loading ratio RE is defined as:
RE=
Emin
Emax
, (18)
where Emin is the minimum applied strain. Then, the maximum applied strain Emax in the second regime
should be in the following interval:
Σy
Y < Emax<
2Σy
Y (1 − RE)
, (19)
in the absence of isotropic hardening. Finally in the last regime, the mean stress relaxes to zero and the maximum applied strain should be:
Emax>
2Σy
Y (1 − RE)
. (20)
Fig. 6 (b) then depicts the curve of the mean stress at saturation vs maximum applied axial strain. The first scenario corresponds to the initial straight line with a slope of Y (1 − RE)/2; The second scenario depends
on the type of kinematic hardening, and finally in the third scenario, a zero mean stress is found.
Figure 6: For a single crystal under asymmetric strain controlled loading, (a) stress vs strain plot showing the three scenarios of cyclic mean stress relaxation, and (b) mean stress at saturation vs maximum axial strain plot.
4.4. Mean stress relaxation in polycrystals
The boundary conditions applied to the meshes of figure 1 were periodic with a periodic stress E11
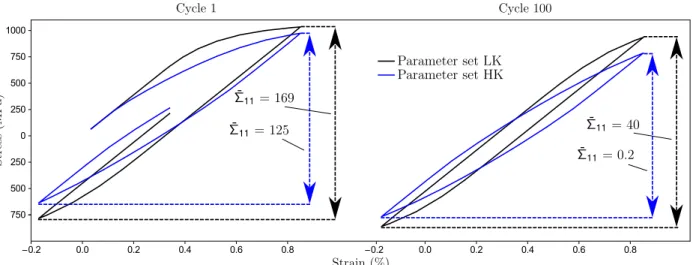
imposed on all elements. Figure 7 shows the stress (Σ11) vs strain (E11) response for the two parameter sets
on VE 1. Both VEs were submitted to the same loading conditions E11= 0.85% and RE = -0.2. It can be
seen that at cycle 100, the curve for parameter set LK stabilizes to a mean stress of 40 MPa, whereas the curve for parameter set HK relaxes to less than 0.5 MPa.
750 500 250 0 250 500 750 1000 0.2 0.0 0.2 0.4 0.6 0.8 0.2 0.0 0.2 0.4 0.6 0.8
Figure 7: Under asymmetric strain controlled boundary conditions on VE 1, stress (Σ11) vs strain (E11) plot for both parameter
sets with RE= -0.2, and E11= 0.85%. Responses were extracted at cycles 1 and 100 for both parameter sets. Cyclic mean
stresses ( ¯Σ11) are also given for each case respectively.
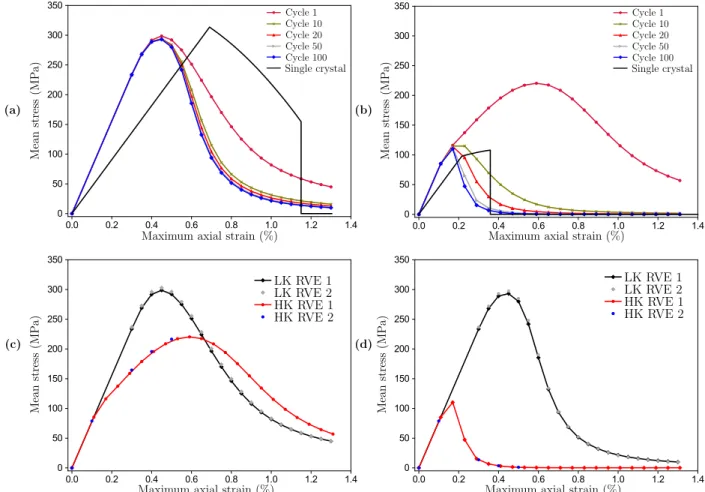
According to Fig. 8, the response of the polycrystal can be characterized by the mean stress vs maximum axial strain diagram. Each point represents one simulation, with 100 cycles each, and a total of 21 simulations were run ranging from E11 = 0.3% to 1.3% with R = −0.2 for parameter set LK and VE 1. Similarly, 21
simulations ranging from E11= 0.11% to 1.31% with R = −0.2 were performed for parameter set HK and
VE 1. Figure 8 (a) and (b) show the response for parameters set LK and HK. It can be seen how the cyclic mean stress relaxes with the number of cycles. The response of a single crystal oriented at h001i is also plotted for both parameter sets for comparison. For both parameter sets, it was found that a steady state was achieved at cycle 100. Figure 8 (c) and (d) shows the response of both VEs for each parameter set at cycle 1 and 100. It can be seen that parameter set LK does not lead to mean stress relaxation to zero even at a high maximum axial strain. In contrast the material with parameter set HK relaxes to zero for E11 = 0.5%. It can be seen that, when compared to a single crystal, the polycrystal response displays a
smooth transition between the three scenarios which conforms to experimental findings (Chaboche et al., 2012). In addition, both VEs produce a similar response suggesting that the considered volume elements are representative with respect to this macroscopic response.
0.0 0.2 0.4 0.6 0.8 1.0 1.2 1.4 0 50 100 150 200 250 300 350 0.0 0.2 0.4 0.6 0.8 1.0 1.2 1.4 0 50 100 150 200 250 300 350 0.0 0.2 0.4 0.6 0.8 1.0 1.2 1.4 0 50 100 150 200 250 300 350 0.0 0.2 0.4 0.6 0.8 1.0 1.2 1.4 0 50 100 150 200 250 300 350
Figure 8: Mean stress relaxation in polycrystals (a) VE 1, parameter set LK, (b) VE 1 parameter set HK, (c) comparison of VE 1 and 2 for parameter set LK and HK at cycle 1, (d) comparison of VE 1 and 2 for parameter set LK and HK at cycle 100. Comparison with single crystal response with lattice orientation < 001 >, for figures (a) and (b).
5. Analysis of local results
Attention is now focused on intragranular response of the material. Two types of local results are considered here, namely contour plots of stress and plane strain fields, as well as Gauss point statistics. For the contour plots, VE 1 and 2 are sliced at x = 0.5, as depicted in figure 9.
VE 1
VE 2
Figure 9: A slice of VE 1 and 2 along the 2-3 plane, at x = 0.5
5.1. Local ratcheting behavior
The results of one stress controlled simulation up to 100 cycles with Σ11= 1021 MPa and RΣ= −0.7 for
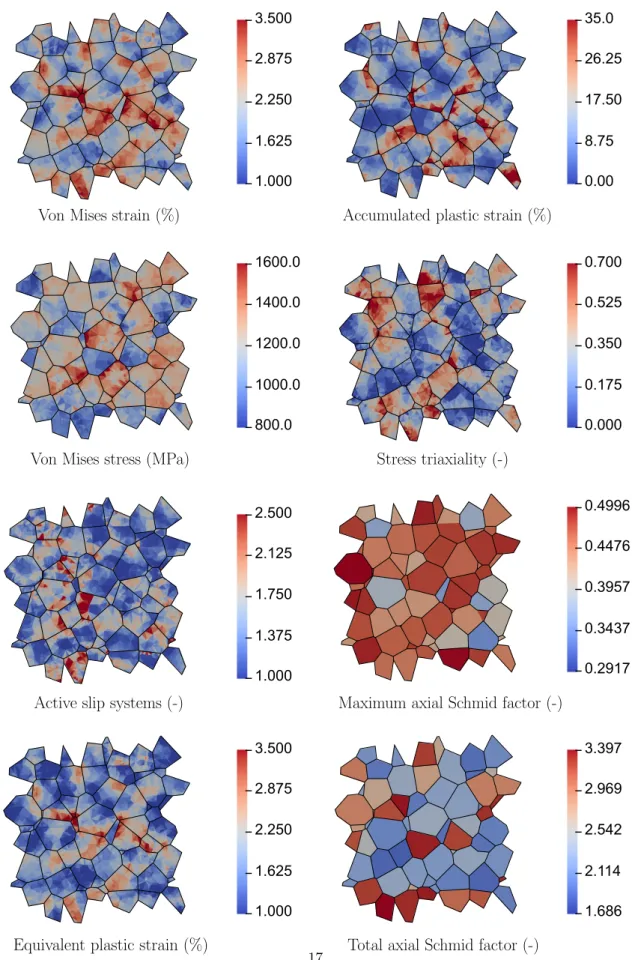
both VE 1 and 2 are analyzed. They are plotted in figure 10 at the time step corresponding to the tensile peak of the one hundredth cycle. An overlay of the grain boundaries is also superimposed on top of each contour map to make the observations easier to interpret. Eight contour plots are shown for the following field variables:
• von Mises strain εvM =
r 2 3ε
0
ijε0ij, where ε0 is the deviatoric part of the local strain tensor,
• equivalent plastic strain εp eq= r 2 3ε p ijε p ij
• accumulated plastic strain εacc=
Z t
0
r 2
• von Mises stress σvM =
r 3 2σ
0
ijσ0ij, where σ0 is the deviatoric part of the local stress tensor,
• stress triaxiality σtri=
σii/3 q 3 2σ 0 ijσ0ij ,
• number of active slip systems:
N X s=1 |γs| ! / max s=1,N(|γ
s|), where s is the slip system,
• maximum axial Schmid factor per grain mmax = max s=1,N(|m
s|), where ms = (ns.t)(ls.t), t being the
tensile direction and s the slip system. This factor is computed assuming uniaxial tension.
• total axial Schmid factor per grain mtotal= N
X
s=1
|ms|.
For both VEs, the von Mises strain and equivalent plastic strain maps in Fig. 10 show that both quantities have very similar maps and it can be seen that they segregate in some regions of the microstructure. These regions do not specifically conform to any specific grain or orientation. Similar observation is made for the accumulated plastic strain map. One important feature from the accumulated plastic strain map is the extreme heterogeneity with locations experiencing very little plastic strain accumulation, and regions of accumulated plastic activity as high as 55%. Looking at the von Mises stress plot, it can be seen that there is much less heterogeneity, at least when compared to the strain plots. The von Mises stress scale begins at 800 MPa and even at this scale, not many regions can be seen to have such low stresses. Nonetheless, the von Mises stress seems to obey morphological constraints such as grains and grain boundaries, in contrast to other quantities. The same holds for the stress triaxiality plot. The map of the number of active slip systems is also given in Fig. 10. This variable ranges in principle from 1 to 12. However, it can be seen that the estimated number of activated slip systems does not reach such large values but mostly remains between 1 and 3. The plot shows that a value of 1 is observed mostly at the core of the grains where a single slip system is active. On the other hand, darker regions of the active slip system plot exist at the grain boundaries where different grains interact and multislip is likely. Lastly, two plots for the Schmid factors are provided in Fig. 10: the maximum axial Schmid factor mmax and the total axial Schmid factor mtotal.
A high value of mmax indicates that the grains are rather soft, meaning that they experience low stress
values. No clear correlation can be seen between the mmax map and the previous stress and strain maps.
In contrast, interesting observations can be made from the mtotalmap. The variable mtotal is the sum of all
Schmid factors for unixial tensile direction. This quantity, is another indicator of multislip activity. A clear correlation can be seen between the mtotal map and the field of von Mises stress. Wherever there is a high
2.00 2.75 3.50 4.25 5.00 0.00 13.75 27.50 41.25 55.0 800.0 1000.0 1200.0 1400.0 1600.0 0.000 0.175 0.350 0.525 0.700 0.3100 0.3575 0.4050 0.4525 0.4998 1.770 2.175 2.580 2.985 3.390 1.000 1.375 1.750 2.125 2.500 1.0 2.0 3.0 4.0 5.0
Figure 10: (a) For VE 1, contour plots of a simulation with Σ11= 1021 MPa, and asymmetric load with RΣ= −0.7 after
running one hundred cycles, extracted at the maximum stress of the one hundredth cycle. The contour plots show the von Mises strain, accumulated plastic strain, von Mises stress, stress triaxaility, maximum slip divided by total slip, and the axial
1.000 1.625 2.250 2.875 3.500 0.00 8.75 17.50 26.25 35.0 800.0 1000.0 1200.0 1400.0 1600.0 0.000 0.175 0.350 0.525 0.700 0.2917 0.3437 0.3957 0.4476 0.4996 1.686 2.114 2.542 2.969 3.397 1.000 1.375 1.750 2.125 2.500 1.000 1.625 2.250 2.875 3.500
Figure 10: (b) For VE 2, contour plots of a simulation with Σ11 = 1021 MPa, and asymmetric load with RΣ= −0.7 after
running one hundred cycles, extracted at the maximum stress of the one hundredth cycle. The contour plots show the von
Observation of local ratcheting phenomena
Up till now the series comparison test to detect ratcheting or shakedown has been applied to the macro-scopic averaged results. In this section the test is applied to each element of the finite element mesh in order to detect local ratcheting phenomenon. The elements which ratchet are then displayed in red while those which exhibit shakedown are shown in blue. For the application of this test, three simulations are selected for from the asymmetric stress controlled batch (VE 1, parameter set LK) after running 100 cycles. All three have the same loading ratio of RΣ= -0.7 while the maximum applied stress varies as follows:
(1) Σ11= 849 MPa, macroscopic shakedown, 1.9% of ratcheting volume
(2) Σ11= 983 MPa, macroscopic shakedown, 29.0% of ratcheting volume
(3) Σ11= 1021 MPa, macroscopic ratcheting, 53.8% of ratcheting volume
Using the series comparison test for ratcheting and shakedown, the first two cases display macroscopic shakedown while the third exhibits macroscopic ratcheting. Figure 11 elaborates this further where the three aforementioned cases are shown. The first line shows the whole VE. In the second line of the figure, only the finite elements of the volume which undergo ratcheting can be seen for all three loads. The third line shows a 2D slice with the ratcheting and shakedown regions. It seems that the regions that ratchet do not conform to grain morphology or any particular locations and are rather random in nature.
It can be seen that the ratcheting zones of the polycrystal tend to percolate to form a connected ratcheting domain when increasing the applied stress and before macroscopic ratcheting is observed. The volume fraction of the percolating ratcheting zone has been determined following the method proposed in Kanit et al. (2006) and was found to reach full percolation for the two higher loads illustrated in Fig. 11. In contrast, in the left column of Fig. 11 for lower load values, isolated islands of ratcheting are observed. No direct link could be derived between the corresponding percolation threshold and the occurrence of plastic shakedown or ratcheting.
Figure 11: Three different asymmetric stress controlled simulations with Σ11= 849 MPa, Σ11= 983 MPa, and Σ11= 1021
MPa, and RΣ= -0.7 for all cases (VE 1, parameter set LK). Macroscopically, the first and second shakedown while the third
ratchets. Local regions for ratcheting and shakedown (per finite element) are respectively shown in red and blue for each case.
Probability density distributions
Figure 12 presents Gauss point distribution plots for Σ11 = 1021 MPa, and RΣ= -0.7. Both VEs are
considered: The solid line represents VE 1, while the dotted line represents VE 2. To show the evolution of each variable with respect to cycle number, the statistics are collected at the tension peak of cycles 1, 10 and 100. In figure 12(a), the histogram plot of von Mises stress shows a multi-modal distribution where the peaks can be seen to progressively split as the number of simulated cycles increases. This point will be analyzed in the next paragraph and in the next two figures. With regards to the accumulated plastic strain according to Fig. 12(c), it can be seen that for the first cycle, the distributions are first unimodal but as the cycle number increases, a hump is produced in the left part of the curves. This will be characterized later in this article. Looking at the von Mises strain distribution, it can be seen that, with an increase in the number of cycles, the curves translate along the strain axis, as a result of the ratcheting phenomenon. The standard deviation of von Mises strain is found to increase with the cycle number. Regarding the stress triaxiality, the standard deviation similarly increases with the cycle number. Lastly, the number of active slip systems can be seen to be less than six and with the progression of cycles, single slip starts to dominate.
The representativity of the results is confirmed by the fact that all the dotted and solid lines corresponding to VE 1 and 2 are close to each other. An exception is the von Mises strain distribution plots for which slight deviations are observed, which shows a slightly different ratcheting intensity of each volume. The intensity of ratcheting surely is a very sensitive result of polycrystalline material response. More precise estimates would require the consideration of additional volume elements.
Evidence of bimodal stress distribution
As seen in figure 12, the von Mises stress probability distribution curves exhibit a multimodal distribution. This fact has already been observed by several authors using crystal plasticity simulations (Osipov et al., 2008; Schwartz et al., 2013; Lee et al., 2011; Choi et al., 2012). What is missing is a detailed analysis showing the origin of this phenomenon. Figure 13 shows the von Mises stress distribution curve taken at the tensile peak of the 100th cycle for Σ11 = 1021 MPa and RΣ = -0.7. Two distinct peaks can be seen
in the distribution arbitrarily separated by a dashed line. This separation makes it possible to split the polycrystalline volume into two parts, the first (resp. second) one containing the Gauss point displaying a von Mises equivalent stress lower (resp. larger) than this separation value. The volume fractions in each peak are then shown in the 3D and 2D views of Fig. 13, with a gray (resp. black) color corresponding to the first (resp. second) peak. It can be noted that the black and grey regions contain mostly full grains, i.e. each grain is either completely black or grey. Of course there are some exceptions where some grains are split into grey and black zones. They reflect the fact that the distribution curve of von Mises stress was split arbitrarily and the region between the two black dotted lines in the histogram of Fig. 13 has overlapping points. The observation of the total axial Schmid factors plot of figure 10 indicates that the black regions correspond to hard grains, and the grey regions correspond to soft grains. It is concluded that the polycrystal aggregate progressively splits into main regions of high and low stresses strongly correlated with the hard/soft character of the grains.
600 800 1000 1200 1400 1600 1800 0.0 0.2 0.4 0.6 0.8 1.0 100 101 0.0 0.5 1.0 1.5 2.0 2.5 104 103 102 101 100 101 0.0 0.5 1.0 1.5 2.0 2.5 3.0 102 101 100 0.0 0.5 1.0 1.5 2.0 2.5 3.0 102 101 100 101 102 103 0.0 0.5 1.0 1.5 2.0 2.5 3.0 100 2 × 100 3 × 100 4 × 100 6 × 100 0.0 0..5 1.0 1.5 2.0 2.5 3.0
Figure 12: Distribution curves of Gauss point variables for an asymmetric stress controlled test using parameter set 1, RΣ
= -0.7 and Σ11 = 1021 MPa. The variables shown are (a) von Mises stress (b) von Mises strain, (c) accumulated slip, (d)
600 800 1000 1200 1400 1600 1800 2000 0.0 0.2 0.4 0.6 0.8 1.0 1.2 600 800 1000 1200 1400 1600 1800 2000 0.0 0.2 0.4 0.6 0.8 1.0 1.2
Figure 13: For both VE 1 and 2, von Mises stress distribution at the tensile peak of the 100th cycle for Σ11 = 1021 MPa
and RΣ = -0.7. The distribution curve has been broken down into two parts and the associated regions are shown in the
microstructure respectively. All Gauss points in the first part of the distribution curve are colored gray in the microstructure, while all Gauss points in the second part of the distribution curve are colored black.
Evidence of bimodal accumulated plastic strain distribution
Bimodality is also observed in the distribution of accumulated plastic strain or accumulated slip in figure 12(c,d), when the number of simulated cycles increases. This is not always the case. Figure 14 shows the
Gauss point results from five simulations. These simulations pertain to parameter set HK, Σ11 = 284,
368, 452, 536, 620 MPa, and RΣ = 0. The trend that can be seen in log accumulated plastic strain plot
distribution curves of these plots is that the first and last plots (Σ11 = 284 and 620 MPa) are unimodal
regardless of the number of simulated cycles while the other three plots start with one peak and then split into two peaks. This bimodality represents two regions that develop inside the polycrystal: a first where shakedown occurs and the second where ratcheting takes place. It can also be seen that the volume of these regions depends on the applied load.
Most importantly, it is noted that this bimodality does not always appear. It is therefore possible to draw a diagram of the existence of bimodal accumulated plastic strain distribution depending on the applied stress amplitude and mean stress. This is done in Fig. 15 taking the already performed simulations for VE 1 and parameter set HK. The obtained modality diagram of Fig. 15 can be compared to the ratcheting diagram of Fig. 5 based on the series criterion. It is remarkable that the domain of bimodality is found to almost coincide with the domain of plastic shakedown. This major finding suggests that stable bimodal plastic strain distributions correspond to a transition regime between shakedown (elastic or plastic) and ratcheting material response. This feature can be also be used as a criterion for the detection of plastic shakedown replacing or in addition to the series convergence criterion. This conclusion is confirmed by the results of VE 2 (modality map not provided here for conciseness).
105 104 103 102 101 100 101 0..0 2.0 4..0 6.0 8.0 10.0 105 104 103 102 101 100 101 0.0 2.0 4.0 6.0 8.0 10.0 105 104 103 102 101 100 101 0.0 2.0 4.0 6.0 8.0 10.0 105 104 103 102 101 100 101 0.0 2.0 4.0 6.0 8.0 10.0 105 104 103 102 101 100 101 0.0 2.0 4.0 6.0 8.0 10.0
Figure 14: Probability distribution curves for the accumulated plastic strain in five simulations with RΣ= 0 and Σ11= 284
0
200
400
600
800
1000
0
200
400
600
800
1000
Figure 15: Modality diagram for parameter set HK, VE 1. It characterizes the existence of unimodal or bimodal distributions of accumulated plastic strain.
5.2. Mean stress relaxation
The analysis of the local results must also be performed for other loading conditions. Such an analysis is performed in this section in the case of strain controlled tests in order to characterize some microstructural features associated with mean stress relaxation. For the next three figures a strain controlled simulation for VE 1 with parameter set LK and RE = -0.2 and E11 = 0.85% is considered. The results plotted pertain to
the tensile peak of the 100th cycle. The contour plots of figure 16 can be compared with those of figure 10 (a) (stress controlled compared to strain controlled). It can be seen that both are very similar. In particular, the map of the von Mises strain shows that the most deformed grains are almost the same for both simulations, except that the strain controlled simulation leads to much lower strain values. The following definition of a local mean stress is proposed:
((σ11t + σt22+ σ33t ) + (σ11c + σc22+ σ33c ))/2 (21)
where the subscripts t ans c indicate that the variables were collected at the macroscopic tensile or com-pressive peak of their cycle. The observation of the mean stress plot indicates that it segregates at the grain boundaries or at triple junctions, and is less prone to be high within the grains. It is hypothesized that this intergranular interaction prevents the mean stress from relaxing to zero in a polycrystal.
0.5
0.7
0.9
1.1
1.3
0.00
13.75
27.50
41.25
55.00
750.0
900.0
1050.0
1200.0
1350.0
0.00
0.15
0.30
0.45
0.60
1.000
1.375
1.750
2.125
2.500
-50.0
25.0
100.0
175.0
250.0
Figure 16: Contour plots of a simulation with asymmetric strain of E11= 0.85% and RE = −0.2 after running one hundred
cycles, extracted at the maximum strain of the one hundredth cycle (VE 1, parameter set LK). The contour plots show the von Mises strain, accumulated plastic strain, von Mises stress, stress triaxaility, maximum slip divided by total slip, and the local mean stress.
100 2 × 100 3 × 100 4 × 100 6 × 100 0.0 1.0 2.0 3.0 4.0 5.0 6.0 7.0 104 103 102 101 100 101 0.0 0.5 1.0 1.5 2.0 2.5 3.0 3.5 102 101 100 101 102 103 0.0 0.5 1.0 1.5 2.0 2.5 3.0 3.5 102 101 100 0.0 0.5 1.0 1.5 2.0 2.5 3.0 600 800 1000 1200 1400 1600 1800 0.0 0.2 0.4 0.6 0.8 1.0 100 0.0 0.2 0.4 0.6 0.8 1.0 1.2 1.4 1.6
Figure 17: Distribution curves of Gauss point variables for an asymmetric strain controlled test using parameter set LK, RE=
-0.2 and E11= 0.85%. The variables shown are (a) von Mises stress (b) von Mises strain, (c) accumulated slip, (d) accumulated
plastic strain, and (e) stress triaxiality.
The distribution curves for Gauss point variables are plotted in figure 17. The solid lines represent VE 1 while dotted lines represent VE 2. Both VEs exhibit a matching response which signifies good
representativ-ity of the material. The von Mises stress plot shows the distributions curves translating back on the stress axis which reflects the decrease of the average mean stress per cycle. Again, multi-modality is observed for the strain based loading conditions as it was observed for stress control in the previous section with regards to ratcheting. Von Mises strain and stress triaxiality plots display somewhat similar distributions. The plot of the number of active slips systems indicates that single slip gets more dominant as the number of cycles increases. Accumulated slip and accumulated plastic strain exhibit bimodal distributions as in the stress controlled case. The next figure sheds some light on the development of bimodality in the context of mean stress relaxation test. Figure 18 shows the breakdown of bimodality in accumulated plastic strain for parameter set LK, VE 1 and 2. It can be seen that for the first two cases (a) and (b), the curves start as a unimodal distribution but then split into bimodal distributions. Just like in the stress controlled case, these curves indicate that a hundred cycles are not enough to reach a saturated response, as the bimodal peaks are still splitting. The two peaks that form imply that the microstructure splits into two regions, one in which plastic activity stops after some cycles (the first stagnant peak), and the other accommodating all plastic deformation (the second peak which keeps moving forward). At high strains, as shown in figure 18 (d), the whole microstructure undergoes plastic activity resulting in a unimodal distribution. It is hypothesized from the present observations that when the plasticity distribution becomes unimodal, mean stress will relax to zero.
0.0 0.2 0.4 0.6 0.8 1.0 1.2 1.4 0 50 100 150 200 250 300 103 102 101 100 101 102 103 0.0 1.0 2.0 3.0 4.0 5.0 103 102 101 100 101 102 103 0.0 1.0 2.0 3.0 4.0 5.0 103 102 101 100 101 102 103 0.0 1.0 2.0 3.0 4.0 5.0 103 102 101 100 101 102 103 0.0 1.0 2.0 3.0 4.0 5.0
Figure 18: For VE 1 and 2, parameter set LK, distribution curves for the accumulated plastic strain per Gauss point for four maximum axial strain values. (a), (b) and (c) show a bimodal while (d) shows a unimodal distribution. (e) gives the mean stress for different maximum axial strains at cycle 100.
6. Simulations at high cycle numbers
The previous observations have been made from the hundred cycle response of the polycrystalline ag-gregates. The objective of this last section is to check the validity of the drawn conclusions at higher cycle numbers. Using crystal plasticity for low cycle fatigue, some authors have already simulated thousands of cycles (Joseph et al., 2010; Zhang et al., 2015), but the results provided here for the first time pertain to a finely meshed polycrystal aggregate under asymmetric loading conditions. The mesh is fine enough to provide detailed distribution of local stress and strain fields as illustrated in the previous sections. For instance the present finite element meshes contain almost 600000 degrees of freedom for 300 grains to be
compared with 150000 d.o.f. and 250 grains considered by Colas et al. (2019) where more than 1000 cycles were simulated. Two cases are reported in this section where the first case pertains to one simulation on VE 1 under asymmetric strain controlled periodic boundary conditions with RE = -0.2, and E11 = 0.7 % run
for 1500 cycles. Fig. 19 (a) and (b) illustrate the global mean stress relaxation over the 1500 cycles. It can be seen that the cyclic mean stress does not relax to zero even after 1500 cycles, and seems to have reached a saturated value signified by the saturating curve of mean stress in (b). The accumulated plastic strain plot of Fig. 19 (c) further confirms the bimodal distribution with one part of the aggregate experiencing further plastic activity whereas the first peak corresponds to an elastically accommodated region of the crystal. The same trend was observed after 100 cycles and is continuing further after 1500 cycles.
0.2 0.0 0.2 0.4 0.6 0.8 750 500 250 0 250 500 750 1000 100 101 102 103 80 100 120 140 160 180 200 103 102 101 100 101 102 103 0.0 0.5 1.0 1.5 2.0 2.5 3.0 3.5 4.0 4.5
Figure 19: Long cyclic simulation with asymmetric strain controlled boundary conditions for VE 1, parameter set LK: E11=
0.7 %, RE = -0.2. (a) The stress strain hysteresis loops for cycles 1, 10, 100 and 1500. (b) Macroscopic mean stress plotted
against the number of cycles. (c) Gauss point distribution of the accumulated plastic strain for different cycles.
It is instructive to compare the obtained results with a simulation involving a larger number of grains at the expense of a coarse mesh. The objective is to confirm the representativity of the presented results even though this feature was supported by the consideration of VE 1 and 2. A new VE with 153 = 3375 grains
and with one single hexahedral quadratic element per grain is generated, see Fig. 20(a). Using parameter set LK, asymmetric periodic strain loading of 0.6% and RE = -0.2 is imposed. The simulation is run for
6000 cycles. Fig. 20(b) shows the macroscopic stress strain response while (c) shows the accumulated plastic strain at the first, hundredth and six thousandth cycles. It can be seen that the macroscopic stress strain response does not change from the hundredth to the thousandth cycle but the accumulated slip has the same bimodal response as observed in the previous simulations. Just as before, the microstructure divides into two distinct regions: one that stops accumulating plasticity, and the other which takes all the plastic
deformation indicating that these results are consistent with the study presented in this paper. 104 103 102 101 100 101 102 0 200 400 600 800 1000 1200 1400 0.1 0.0 0.1 0.2 0.3 0.4 0.5 0.6 400 200 0 200 400 600 800 1000
Figure 20: Using asymmetric strain controlled boundary conditions, with E11= 0.6% and RE= -0.2 and parameter set LK:
(a) a coarse meshed volume element with 3375 grains and one quadratic element per grain, (b) The macroscopic stress vs strain loops for cycles 1, 100 and 6000. (c) Accumulated plastic strain after the three cyclic instances.
7. Conclusions
Using rate-independent crystal plasticity with kinematic hardening, the cyclic response of FCC polycrys-talline materials has been characterized both at the macroscopic and local levels. The macroscopic response was summarized by appropriate mean stress / stress amplitude maps whereas the mechanisms underlying each type of material response were explored using local statistics. For these two crystal plasticity Two sets of materials parameters with various amounts of yield stress and hardening were considered in order to illustrate the capability of the polycrystal model to capture complex loading behavior under strain or stress loading control. All simulations were run for a hundred cycles each, and more than 1000 cycles for some of them, and then the response was analyzed. The single crystal material model was kept as simple as possible because it is sufficient to explain, at least qualitatively, most features of the observed polycrystal behavior. Evaluation of the results reveals the following major findings:
• For stress controlled asymmetric simulations:
(1) Strain ratcheting in a single (resp. poly) crystal is characterized into three (resp. four) regimes. Elastic accommodation, plastic shakedown and ratcheting regimes are common to single and polycrystals. In contrast, plastic shakedown takes place only in polycrystals.
(2) A series comparison test as well as the bimodality of accumulated plastic strain distribution criterion were proposed to detect ratcheting or plastic shakedown. A remarkable result of the analysis is the evidence of a correlation between the existence of a bimodal distribution and overall plastic shake down.
(3) A theoretical diagram for ratcheting in single crystals is built in terms of the stress amplitude ver-sus mean stress. Several simulations were run and a similar diagram was filled for the polycrystal showing different regimes of elastic and plastic shakedown as well as ratcheting.
(4) Gauss point statistics indicate that the von Mises stress in polycrystals is bimodal. These two modes become more prominent under progressive cyclic loading and they correspond to different regions of the polycrystal respectively made of soft and hard grains in the sense of Schmid factor. (5) Local ratcheting events were observed in polycrystals experiencing plastic shakedown at the
macroscopic scale.
(6) Evolution of the number of activated slip systems during cycling shows a trend towards single slip occurring the core of the grains while multislip is observed mostly at grain boundaries. • For strain controlled asymmetric simulations:
(1) Cyclic mean stress relaxation in a single crystal can be broken down into three distinct regimes: Purely elastic response, elastic accommodation after a first elastoplastic period and plastic shake-down with vanishing mean stress. Instead, in a polycrystal, a smooth transition between these scenarios is observed. Mean stress relaxation towards stabilized finite values was observed for polycrystals.
(2) Cyclic mean stress relaxes to near zero for parameter set HK (high kinematic hardening), whereas it does not relax to zero for parameter set LK (high yield strength).
(3) Distribution curves of the accumulated plastic strain are found to be bimodal under some loading conditions. One part of the microstructure undergoes purely elastic accommodation whereas the remaining part of the polycrystal experiences continuing plastic activity. From the observations, it is conjectured that the mean stress in a polycrystal will relax to zero when the distribution becomes unimodal.
(4) Contour plots reveal that the high cyclic mean stress is more susceptible to segregate at grain boundaries or at triple junctions and this local interaction causes a nonzero mean stress in a polycrystal.
These results show that the grain to grain interactions induce cyclic responses that strongly differ from that of the single crystal. In particular these interactions are responsible for the existence of plastic shakedown regimes under stress control and of incomplete mean stress relaxation under strain control. These results contribute to the understanding of complex stress-strain redistribution phenomena at work in cyclically loaded polycrystals using computer based phenomenological models. These crystal plasticity models are already extensively in use and their capability to mimic real polycrystals has been scrutinized in this article. The macroscopic responses of both load and strain controlled tests are in good agreement with experimental results for engineering FCC alloys where a plastic shakedown as well as a non-zero mean stress are frequently observed.
The current ongoing work compares the presented results with both the predictions from mean field poly-crystal models and those from multiaxial macroscopic loading conditions.
Acknowledgments
The authors gratefully acknowledge the financial support of Chaire Cristal with SafranTech. They also thank Tonya Rose and Arjen Roos from SafranTech for fruitful scientific discussions of the work and careful reading of the manuscript.
Appendix A. Analysis of mesh sensitivity
Selecting the appropriate mesh density for finite element polycrystal simulations is not straightforward. A start can be taken by refining the mesh until a converged macroscopic tensile curve is obtained but finding macroscopic properties is not the only goal of the work. If macroscopic properties were the main goal, then macroscopic models could have been used or even mean field models which take into account a lot of local information and are much faster to perform as well as require considerably less computational resources. The goal here is also to assess local responses inside the grains. This requires large number of degrees of freedom in each grain. Also there is considerable difference in the solutions obtained using different boundary conditions. In this article two types of boundary conditions are used: Periodic strain control or periodic stress control. Periodic stress boundary conditions are anticipated to produce more convergence issues as compared to periodic strain because in metal plasticity, a small increment in stress produces a large increment in strain. This effect is even more pronounced at the local level because of severe heterogeneity in crystal plasticity simulations. With regards to VE 1 which contains 300 grains, three mesh densities were tested for this paper:
(1) coarse mesh with 112565 nodes and 74270 quadratic elements (2) mesh in use with 194903 nodes and 130171 quadratic elements (3) fine mesh with 270670 nodes and 181905 quadratic elements
A tensile test on these meshes was performed and three responses were compared i.e. the macroscopic averaged stress strain response, the von Mises equivalent stress and strain at each Gauss point at the maximum traction/displacement. For periodic strain control a 2% macroscopic strain was imposed while for periodic stress a macroscopic stress of 1110 MPa was imposed in the tensile direction. Figures A.21 and A.22 show the three responses for both loading conditions. For strain controlled loading, all three meshes provide a somewhat converged solution, both at the macroscopic level and at the local level. Apart from some mismatch in the local von Mises stress distribution curve there even the coarse mesh seems to do the job. This is not the case for stress based loading conditions. At the macroscopic scale, the three meshes do not lead to the same value of the mean strain at the final loading point, see Fig. A.22(a). The largest discrepancies are found for the equivalent stress distribution, Fig. A.22(b). This shows that load controlled asymmetric simulations require a very fine mesh to obtain converged local strain distributions. Also, even if there is a small error in the applied stress at each increment, it can result in a significant error in the calculated strains. Using 24 parallel cores for each job, the time needed to run one tensile load controlled test on each mesh was 10, 33 and 60 hours respectively. Although differences can be observed in the load controlled simulation, hundreds of tests were required for this study and hence the intermediate mesh size with 130171 elements was selected.
0.00 0.25 0.50 0.75 1.00 1.25 1.50 1.75 2.00 0 200 400 600 800 1000 0.0 1.0 2.0 3.0 4.0 5.0 6.0 0 10 20 30 40 50 60 70 600 800 1000 1200 1400 1600 1800 0.0000 0.0005 0.0010 0.0015 0.0020 0.0025 0.0030 0.0035 0.0040
Figure A.21: Using parameter set LK, tensile test simulations for three finite element meshes under a macroscopic periodic strain of 2%: (a) macroscopic averaged stress strain plot,(b) and (c) von Mises equivalent strain and stress distributions at the peak macroscopic strain.
0.0 1.0 2.0 3.0 4.0 5.0 6.0 0 10 20 30 40 50 60 70 600 800 1000 1200 1400 1600 1800 0.0000 0.0005 0.0010 0.0015 0.0020 0.0025 0.0030 0.0035 0.0040 0.00 0.25 0.50 0.75 1.00 1.25 1.50 1.75 2.00 0 200 400 600 800 1000
Figure A.22: Using parameter set LK, tensile test simulations for three finite element meshes under a macroscopic periodic load of 1100 MPa: (a) macroscopic averaged stress strain plot, (b) and (c) show the von Mises equivalent strain and stress at the peak macroscopic stress.
References
Arcari, A., Vita, R.D., Dowling, N.E., 2009. Mean stress relaxation during cyclic straining of high strength aluminum alloys. International Journal of Fatigue 31, 1742 – 1750.
Azzouz, F., Cailletaud, G., Chaboche, J.L., Ostoja-Kuczynski, E., Quilici, S., 2010. Cyclic calculations and life estimation in thermomechanical fatigue, in: 9th International conference on multiaxial fatigue and fracturePublisher??, pp. 785–793. Barbe, F., Forest, S., Cailletaud, G., 2001. Intergranular and intragranular behavior of polycrystalline aggregates. Part 2:
Results. International Journal of Plasticity 17, 537 – 563.
Besson, J., Cailletaud, G., Chaboche, J., Forest, S., 2009. Non-linear mechanics of materials. Solid Mechanics and Its Applications 167, Springer.
Busso, E.P., Cailletaud, G., 2005. On the selection of active slip systems in crystal plasticity. International Journal of Plasticity 21, 2212 – 2231. Plasticity of Heterogeneous Materials.
Chaboche, J., 1986. Time-independent constitutive theories for cyclic plasticity. International Journal of Plasticity 2, 149 – 188.
Chaboche, J., 1989. Constitutive equations for cyclic plasticity and cyclic viscoplasticity. International Journal of Plasticity 5, 247 – 302.
Chaboche, J.L., Kanout, P., Azzouz, F., 2012. Cyclic inelastic constitutive equations and their impact on the fatigue life predictions. International Journal of Plasticity 35, 44 – 66.
Choi, Y., Groeber, M., Turner, T., Dimiduk, D., Woodward, C., Uchic, M., Parthasarathy, T., 2012. A crystal-plasticity FEM study on effects of simplified grain representation and mesh types on mesoscopic plasticity heterogeneities. Materials Science and Engineering: A 553, 37 – 44.
Colas, D., Finot, E., Flouriot, S., Forest, S., Mazi`ere, M., Paris, T., 2019. Local ratcheting phenomena in the cyclic behavior of polycrystalline tantalum. JOM Journal of the Minerals, Metals & Materials Society doi:10.1007/s11837-019-03539-z. Cruzado, A., LLorca, J., Segurado, J., 2017. Modeling cyclic deformation of Inconel 718 superalloy by means of crystal plasticity