Université de Montréal
An RNAi Screen to Identify Factors that Control the Binding of Polycomb Group Proteins to the Chromatin Across the Cell Cycle
Par
HUANG SUNG Aurélie
Programmes de Biologie Moléculaire, Faculté de Médecine
Mémoire présenté en vue de l’obtention du grade de Maîtrise en Biologie Moléculaire, option générale
Mars 2020
Résumé
L’établissement et le maintien du patron d’expression génique sont d’une importance critique pour l’identité cellulaire. Les protéines du groupe Polycomb (PcG) agissent sur la chromatine afin de maintenir la répression génique de ses gènes cibles à travers les cycles cellulaires de façon épigénétique. Toutefois, durant la mitose, la structure de la chromatine est grandement altérée par la répression de la transcription, la condensation de la chromatine et le relâchement de nombreux facteurs de transcription. Une question se pose alors : comment les protéines PcG peuvent-elles maintenir leur fonction à travers la mitose ? En interphase, les protéines PcG sont liées à leurs cibles sur la chromatine. Durant la mitose, la majorité des protéines PcG se libèrent de la chromatine mais une petite fraction persiste. Selon l’hypothèse du mitotic bookmarking, cette fraction agirait comme un ensemble de marqueurs guidant le recrutement des protéines PcG en fin de mitose pour maintenir le profil d’expression génique de la cellule. Cependant, nous ne savons pas comment ce recrutement à lieu, ni comment une fraction de protéines PcG est retenue à la chromatine. Afin de répondre à ces questions, un crible à ARN interférent a été établi pour identifier des facteurs contrôlant la liaison des protéines PcG à la chromatine à travers le cycle cellulaire. Quoiqu’une confirmation soit nécessaire, les facteurs spécifiques à l’interphase sont enrichis en protéines co-purifiant avec la protéine PcG testée et en hélicases alors que ceux spécifiques à la mitose sont enrichis en candidats liés aux protéines du groupe Trithorax (TrxG). Mots-clés : Protéines Polycomb, Mitose, Chromatine, Chromosome, Épigénétique, Crible par ARN interférence, Drosophile.
Abstract
A critical part of cell identity is the establishment and maintenance of gene expression patterns. Polycomb group proteins (PcG) act on chromatin to maintain gene repression through cell cycles (epigenetically). However, during mitosis, chromatin structure is greatly altered by transcription repression, chromatin condensation, and the release of many transcription factors. A question then arises: how can PcG proteins maintain their function through mitosis? During interphase, PcG proteins are bound to their chromatin targets. During mitosis, most PcG proteins are released from chromatin, but a small fraction remains bound to chromatin. According to the mitotic bookmarking hypothesis, this fraction acts as a set of markers to guide the recruitment of PcG proteins at the end of mitosis to maintain the gene expression profile. However, we do not know how this recruitment takes place, nor do we know how a fraction of PcG proteins is retained on chromatin. To address these questions, an RNAi screen was established to identify factors that control the binding of PcG proteins to chromatin across the cell cycle. Although a confirmation is necessary, factors identified from interphase cells were enriched in proteins co-purifying with the tested PcG protein and in helicases while mitosis specific factors were enriched in Trithorax group (TrxG) protein related candidates.
Keywords: Polycomb Group proteins, Mitosis, Chromatin, Chromosomes, Epigenetic, RNAi screen, Drosophila.
Table of Content
Résumé ... 3 Abstract ... 5 Table of Content ... 7 List of Tables ... 13 List of Figures ... 15 Abbreviation ... 17 Acknowledgements ... 23 Foreword ... 25 1. Chapter 1 – Introduction ... 27 1.1. Epigenetic Inheritance ... 271.2. Chromatin Organization in Drosophila ... 27
1.2.1. Chromatin Domain Classes ... 28
1.2.2. Chromatin Domain Boundaries ... 29
1.3. Discovery of the PcG ... 29
1.4. Functional Characterization of PcG Proteins ... 30
1.4.1. PRC1 ... 32
1.4.2. dRAF ... 32
1.4.3. PRC2 ... 33
1.4.4. PR-DUB ... 33
1.5. PcG Protein Recruitment ... 36
1.5.1. Polycomb Response Elements ... 37
1.5.2. SAM Scaffold ... 37
1.5.3. PcG Recruitment by R-loops... 37
1.5.4. Histone Modifications Further Stabilize PcG Protein Recruitment ... 38
1.6. Trithorax Group Proteins Counteract PcG Proteins ... 38
1.7. PcG Protein Removal from Chromatin ... 39
1.7.1. PcG Proteins Can be Removed from Chromatin During Development ... 39
1.7.2. PcG Proteins Can Be Removed During Mitosis ... 40
1.7.2.1. Nuclear Envelope During Mitosis ... 40
1.7.2.2. Chromatin During Mitosis ... 40
1.7.2.3. Mitotic Bookmarking ... 42
1.7.2.4. PcG Proteins in Mitosis ... 42
1.8. Summary ... 45
1.9. Proof of Concept ... 45
1.9.1. RNAi Screen ... 45
1.9.2. RNAi Screen Analysis ... 48
1.9.2.1. Data Triage ... 48
1.9.2.2. Data Normalization ... 49
1.9.2.3. Quality Control ... 50
1.9.2.4. Hit Identification ... 50
2. Chapter 2 – Experimental Procedures ... 53
2.3. Primer Design for Additional dsRNAs ... 75
2.4. RNAi Template (DNA) Preparation ... 77
2.5. dsRNA Synthesis ... 78
2.5.1. RNAi Screen ... 78
2.5.2. Follow-up RNAi Experiments ... 78
2.6. S2R+ Cells ... 79
2.7. Plate Design ... 79
2.8. S2R+ Cells Treatment for RNAi Screen ... 81
2.9. Immunocytochemistry ... 81
2.10. Image Acquisition ... 82
2.11. Image Processing ... 84
2.11.1. Identification of Interphase and Mitotic Cells ... 86
2.11.1.1. Tubulin Staining Distribution... 86
2.11.1.2. "Chromosome" Object ... 86
2.11.1.3. Standard Deviation of Pixel Intensity for Tubulin Staining ... 86
2.11.2. Pipeline Validation ... 87
2.12. RNAi Screen Analysis ... 87
2.13. S2R+ Cells Treatment for Western Blot ... 87
2.14. Western Blot ... 88
2.15. Western Blot Quantification and Analysis ... 88
3. Chapter 3 – Results ... 91
3.1. High Throughput Imaging Based RNAi Screen ... 91
3.1.3. Image Acquisition and Processing ... 93
3.1.4. Normalization ... 93
3.1.5. Quality Control ... 95
3.1.6. Hit Identification... 99
3.1.6.1. High Stringency Hits (3MAD or c=1.7239) ... 103
3.1.6.2. Low Stringency Hits (2MAD or c=0.9826) ... 110
3.2. Analysis of Total Ph Levels in dsRNA-Treated Cells ... 121
3.3. Hit Confirmation Attempt ... 123
3.3.1. Cell Fractionation ... 123
3.3.2. Flow Cytometry of Extracted Cells ... 125
3.3.3. ChIP for Ph in dsRNA Treated cells ... 125
3.3.4. Cleavage Under Targets & Release Under Nuclease... 125
4. Chapter 4 – Discussion ... 127
4.1 Factors Involved PcG Protein Binding to Chromatin Across the Cell Cycle ... 127
4.2. Technical Limitations ... 127
4.3. Perspective ... 128
4.3.1. nej and Sbf Knockdown Have Expected Results ... 128
4.3.2. Cp1 Was Previously Linked to Pc... 129
4.3.3. Helicases Might be Involved in PcG Chromatin Binding Behaviour ... 129
4.3.4. Ribosomal Proteins Might Compete for PcG Protein Binding ... 130
4.3.5. SF2 ... 131
4.3.6. PcG Protein Binding to Chromatin in Mitosis... 131
4.5.1. Confirmation of Hits by Secondary Screening ... 132
4.5.2. Systematic Mechanistic Study of Confirmed Hits ... 132
4.5.3. Mechanistic Study of Rm62 ... 133
4.6. Conclusion ... 134
References ... 135
Annex 1- Interphase Cell Analysis Pipeline Comments ... 153
Annex 2- Mitotic Cell Analysis Pipeline Comments... 159
List of Tables
Table 1. – Drosophila PcG Proteins. ... 31
Table 2. – RNAi Screen Candidates. ... 58
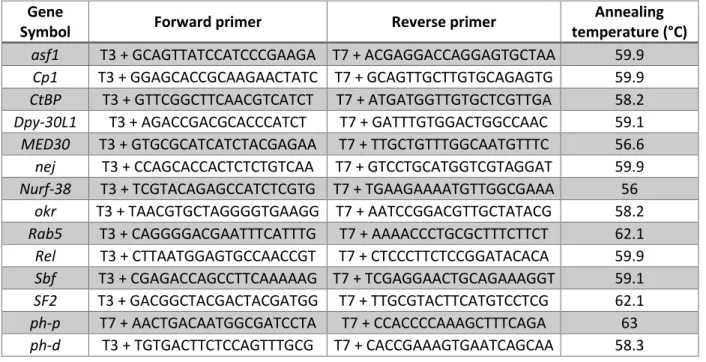
Table 3. – Gene Specific Primers Used. ... 76
Table 4. – Quality Control Metrics for Interphase Cells. ... 96
Table 5. – Quality Control Metrics for Mitotic Cells. ... 97
Table 6. – Evaluation of Quality Control Metrics. ... 98
Table 7. – Hit List for 3MAD and/or c=1.7239. ... 104
Table 8. – Flybase Gene Group Analysis (3MAD/c=1.7239). ... 109
Table 9. – Hit List for 2MAD and/or c=0.9826. ... 111
List of Figures
Figure 1. – Drosophila PcG Complexes and Proteins. ... 35
Figure 2. – Mitotic Bookmarking by PcG Proteins. ... 44
Figure 3. – RNAi in Drosophila. ... 47
Figure 4. – Schematic Representation of Screening Workflow. ... 54
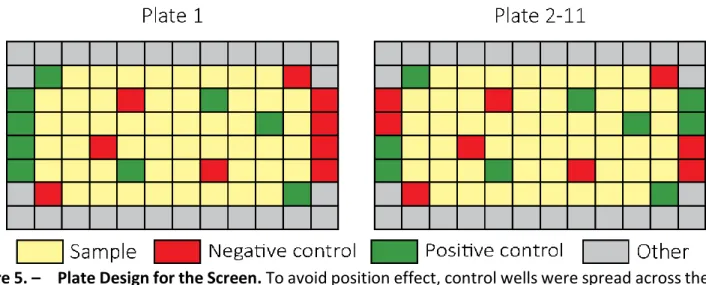
Figure 5. – Plate Design for the Screen. ... 80
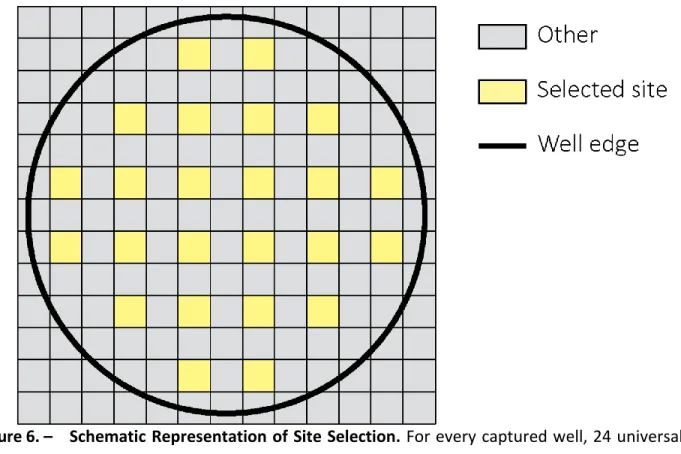
Figure 6. – Schematic Representation of Site Selection. ... 83
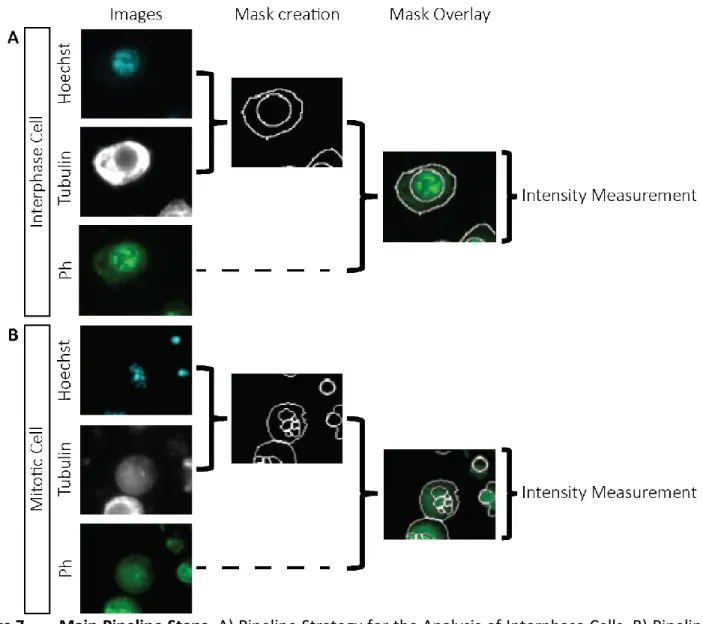
Figure 7. – Main Pipeline Steps. ... 85
Figure 8. – RNAi Treatment Efficiency in S2 Cells. ... 92
Figure 9. – Effect of B-score Normalization of Median Values from Interphase Cells. ... 94
Figure 10. – Plate-Well Series Plot of Sample Replicate 1. ... 100
Figure 11. – Plate-Well Series Plot of Sample Replicate 2. ... 101
Figure 12. – Hit Examples. ... 102
Figure 13. – Identified Factors of Interest (3MAD/c=1.7239). ... 107
Figure 14. – Fraction of Cell Cycle Specific Genes Related to TrxG Proteins. ... 116
Figure 15. – Cell Cycle Specificity of Hits. ... 117
Figure 16. – Quantitative Analysis of dsRNA-Treated Cells. ... 122 Figure 17. – Quantitative Western Blot Analysis of Whole Cell Extracts and Chromatin Fraction. 124
Abbreviation
Adf1: Adh transcription Factor 1 Ago2: Argonaute 2
ANT-C: Antennapedia Complex
AP-MS: Affinity Purification-Mass Spectrometry Asx: Additional Sex combs
BSA: Bovine Serum Albumin BX-C: Bithorax Complex cg: Combgap
ChIP: Chromatin Immunoprecipitation crm: cramped
CUT&RUN: Cleavage Under Targets & Release Under Nuclease Dcr-2: Dicer-2
ddH2O: double-distilled water DMSO: Dimethyl Sulfoxide DNA: Deoxyribonucleic Acid
dNTP: deoxyribonucleotide Triphosphate dRAF: dRing-Associated Factors
E(z): Enhancer of Zeste Esc: Extra sex combs
esiRNA: endoribonuclease-prepared siRNA fs(1)h: female sterile (1) homeotic
g/L: gram per liter GAF: GAGA Factor GO: Gene Ontology grh: grainy head
H2AK118ub: Histone H2A with Ubiquitylation at Lysine 118 H3K20: Lysine 20 of Histone H3
H3K27me3: Histone H3 with trimethylation at Lysine 27 H3K36me3: Histone H3 with trimethylation at Lysine 36 H3K4me3: Histone H3 with trimethylation at Lysine 4 H3K9me2: Histone H3 with dimethylation at Lysine 9 H3S10p: Histone H3 with phosphorylation at Serine 10 HCS: High Content Screening
Hox: Homeotic hr: hour
Jarid2: Jumonji, AT Rich interactive domain 2 KCl: Potassium Chloride
KHCO3: Potassium Bicarbonate MAD: Median Absolute Deviation MBT: Malignant Brain Tumor MeOH: Methanol
mg/ml: milligram per milliliter MgCl2: Magnesium Chloride min: minute
mM: millimolar
MNase: Micrococcal Nuclease mxc: multi sex combs
Na2HPO4-7H2O: Sodium Phosphate dibasic Heptahydrate NaCl: Sodium Chloride
ng/ml: nanogram per milliliter ng: nanogram nm: nanometer oC: degree Celsius Ogt: O-glycosyltransferase Pc: Polycomb PcG: Polycomb Group Pcl: Polycomblike
Ph-d: Polyhomeotic Distal Pho: Pleiohomeotic Phol: Pleiohomeotic like Ph-p: Polyhomeotic Proximal
PR-DUB: Polycomb Repressive Deubiquitinase PRC1: Polycomb Repressive Complex 1 PRC2: Polycomb Repressive Complex 2 PRE: Polycomb Response Element Psc: Posterior sex combs
psq: Pipsqueak
PTM: Post Translational Modification QC: Quality Control
RISC: RNA-Induced Silencing Complex RNA: Ribonucleic Acid
RNAi: RNA interference
rNTP: ribonucleotide Triphosphate SAM: Sterile α Motif
Sce: Sex Combs Extra Scm: Sex Combs on Midleg SDS: Sodium Dodecyl Sulfate sec: second
shRNA: short hairpin RNA siRNA: small interfering RNA
SMC: Structural Maintenance of Chromosomes Spps: Sp1-like factor for pairing-sensitive silencing SSMD: Strictly Standardized Mean Difference TAD: Topologically Associating Domains z: zeste
μg: microgram μl: microliter μM: micromolar
Acknowledgements
I would like to thank my advisor, Dr. Nicole Francis, not only for giving me so many opportunities but also for helping me grow as a person.
I would like to thank the Francis lab members, past and present, for the formative experience. I would also like to express my gratitude to Dr.Lécuyer for providing me with reagents, Juan- Carlos Padilla and Philippe Jolivet for their help with S2R+ cells as well as Xiaofeng Wang and Dominic Filion for their technical assistance.
Foreword
Vincent Lapointe-Roberge, an undergraduate student under my supervision, carried out the Western blot experiments and analysis and helped in the making of figure 16 (p.122).
1. Chapter 1 – Introduction
1.1. Epigenetic Inheritance
During the development of a multi-cellular organism, a single stem cell gives rise to a variety of cell types or cell identities through a combination of proliferation and differentiation. These different cell types share common genetic information. This is because cellular identity relies on gene expression profile rather than genetic information (Barrero et al., 2010). Epigenetics provides a mechanism for development, cellular differentiation and by extension cellular identity (Francis, 2009). While Waddington first defined "epigenetics" as "the mechanism by which the genes of the genotype bring about phenotypic effects", the meaning of this word has since been the subject of many reconsiderations (Henikoff & Greally, 2016; Jablonka & Lamb, 2002; Probst et al., 2009; Waddington, 2012). In the present work, any heritable change that is stable in the absence of the event that initiated it and without alteration of the deoxyribonucleic acid (DNA) sequence will qualify as epigenetic (Francis, 2009; Probst et al., 2009; Ptashne, 2007). Both the establishment of cellular identity, and the maintenance of cellular identity through cell divisions are essential to avoid dire consequences such as developmental defects or cancer (Bracken & Helin, 2009; Francis & Kingston, 2001; Sparmann & van Lohuizen, 2006; Thiagalingam, 2020). This implies that during mitosis, information beyond the genetic information must be transmitted from parent cell to progeny cells to ensure the maintenance of cellular identity. This phenomenon is referred to as epigenetic inheritance, with epigenetic memory referring to the transmitted information (Probst et al., 2009; Steffen & Ringrose, 2014). Heritable chromatin features have been proposed as candidates for epigenetic memory (Margueron & Reinberg, 2010).
1.2. Chromatin Organization in Drosophila
(Clapier et al., 2008). Histone tails protruding out of the nucleosome can be post-translationally modified, mainly by phosphorylation, methylation, acetylation or ubiquitylation (Kouzarides, 2007; F. Wang & Higgins, 2013; Y. Zhao & Garcia, 2015). These modifications can influence nucleosomes’ biophysical properties and can recruit proteins to specific sites on chromatin. Histone modifying enzymes and proteins that recognize specific modifications (also termed "marks") are often referred to as "writers" and "readers", reflecting the idea that histone modifications are believed to carry information (F. Wang & Higgins, 2013). Chromatin is organized at large scales into gene expression and chromosome behaviour regulatory units. In the Drosophila genome, this organization includes small loops in the 1-10 kilobase range, and larger domains at the level of 10s-100s of kilobases (Hou et al., 2012; Wei et al., 2005).
1.2.1. Chromatin Domain Classes
Chromatin domains can be identified structurally as genomic regions with increased physical interactions in three dimensions (referred to as "topologically associating domains", or "TADs"). They can also be identified as genomic regions with similar biochemical chromatin features (i.e. histone modifications and chromatin binding proteins). Remarkably, domains defined by the two methods show considerable overlap, so that structural domains can be subdivided into different functional classes. An initial domain classification based solely on biochemical features in Drosophila Kc cells described 5 classes of domains: red, yellow, black, green and blue chromatin (Filion et al., 2010). Subsequently, physical domains were mapped in Drosophila embryos, and assigned to one of four classes based on biochemical features (Sexton et al., 2012). These classes are: "Active"--enriched with active marks; "Null"-- no specific enrichment; "Heterochromatin"-- enriched with HP1 and Su(var)3-9; "Polycomb"-- enriched with PcG proteins (Sexton et al., 2012). "Active" domains, and red and yellow chromatin in the classification of Filion et al. (2010), are associated with high levels of histone acetylation, and histone H3 with trimethylation at lysine 4 and 36 (H3K4me3 and H3K36me3 respectively) (Filion et al., 2010; Sexton et al., 2012). Red and yellow chromatin are also both associated with high levels of RNA polymerase and low levels of histone H3 with dimethylation at lysine 9 (H3K9me2) and histone H3 with trimethylation at lysine
MAX. However, red and yellow chromatin differ by the other proteins associated with them, the Gene Ontology (GO) terms associated with the genes in them, and their DNA replication timing (earlier for red than yellow chromatin) (Filion et al., 2010).
"Null" domains and black chromatin both displayed no specific enrichment of histone modifications or chromatin associated proteins, are larger than domains of other classes, and have a low transcriptional output. However, "Null" domains had similar gene density when compared to other domain classes of the same study whereas black chromatin was overall relatively gene poor in the other study (Filion et al., 2010; Sexton et al., 2012).
HP1 and Su(var)3-9 bound domains and green chromatin were associated with classical heterochromatin. These classes are enriched in H3K9me2 marks deposited by Su(var)3-9 (Filion et al., 2010; Sexton et al., 2012).
Both studies identified "Polycomb" domains as a distinct chromatin class. PcG protein bound chromatin domains in Sexton et al. (2012), largely correspond to blue chromatin in Filion et al (2010), as both are enriched in H3K27me3 marks (Filion et al., 2010; Sexton et al., 2012).
1.2.2. Chromatin Domain Boundaries
Chromatin domain boundaries are characterized by the binding of insulator proteins such as CP190, CTCF and Beaf-32. In some cases, they are flanked by transcriptionally active sites. Because chromatin domain boundaries overlap with only a fraction of insulator binding sites, it has been hypothesized that other insulator binding sites act as scaffold for border formation in different conditions (Sexton et al., 2012). In general, the number of insulator proteins bound at a site correlates with whether it is a functional chromatin border (Van Bortle et al., 2014).
1.3. Discovery of the PcG
PcG genes were discovered decades ago, when in 1940, a Drosophila melanogaster (fruit fly) with extra sex combs on each of its six legs was found. This phenotype was due to a recessive mutation of the esc gene (Slifer, 1942). Flies with a similar phenotype but carrying mutations in
One of these was Polycomb (Pc), discovered by Lewis (E. B. Lewis, 1978). At the embryonic, larval and adult stages, the Drosophila body is divided into segments along its anterior-posterior axis. The identities of such segments are specified by the combination of activation or repression of a special class genes that control the development of body structures: homeotic (Hox) genes. In Drosophila, Hox genes are subdivided in two gene complexes: the bithorax complex (BX-C) and the Antennapedia complex (ANT-C) (Kassis et al., 2017). In homozygous Pc mutant larvae, the thoracic and first seven abdominal segments were partially transformed toward a more posterior segment identity. This led Lewis to suggest a revolutionary theory for the function of the product of the Pc gene: that it represses all BX-C genes (E. B. Lewis, 1978).
Over the next years, as additional genes with similar phenotype were discovered, Jürgens proposed that genes for which zygotic mutations leads to a phenotype that resembled that of weak Pc mutants would be referred to as the "Pc group" (I. M. Duncan, 1982; Dura et al., 1985; Ingham, 1984; Jürgens, 1985).
1.4. Functional Characterization of PcG Proteins
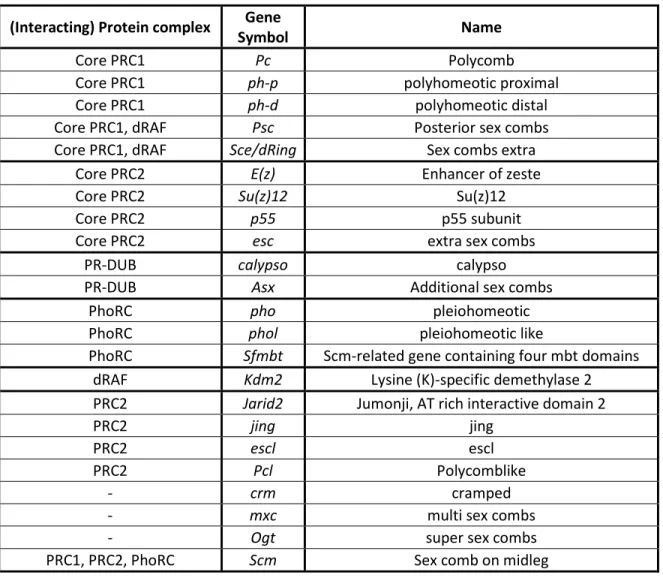
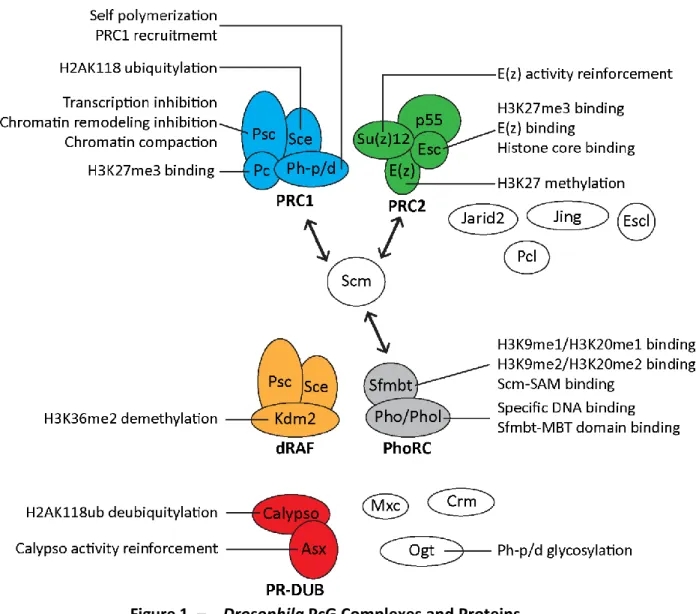
PcG proteins act in the form of complexes (Kassis et al., 2017). Although PcG proteins are conserved across evolution, they are less diversified in Drosophila than in vertebrate species where most PcG proteins have multiple paralogs (Beh et al., 2012; Whitcomb et al., 2007). In Drosophila, PcG proteins are divided into two main complexes: Polycomb repressive complex 1 (PRC1) and Polycomb repressive complex 2 (PRC2) (Whitcomb et al., 2007). Other PcG complexes include Polycomb repressive deubiquitinase (PR-DUB), Pho Repressive Complex (PhoRC), and dRing-associated factors (dRAF) (Kassis et al., 2017; Klymenko et al., 2006; Lagarou et al., 2008; Scheuermann et al., 2010). There are also additional PcG proteins that are not part of core PcG complexes, or that associate with these complexes at substoichiometric ratios (Kassis et al., 2017) (Table 1, p.31; Figure 1, p.35).
Table 1. – Drosophila PcG Proteins.
(Interacting) Protein complex Gene
Symbol Name
Core PRC1 Pc Polycomb
Core PRC1 ph-p polyhomeotic proximal
Core PRC1 ph-d polyhomeotic distal
Core PRC1, dRAF Psc Posterior sex combs
Core PRC1, dRAF Sce/dRing Sex combs extra
Core PRC2 E(z) Enhancer of zeste
Core PRC2 Su(z)12 Su(z)12
Core PRC2 p55 p55 subunit
Core PRC2 esc extra sex combs
PR-DUB calypso calypso
PR-DUB Asx Additional sex combs
PhoRC pho pleiohomeotic
PhoRC phol pleiohomeotic like
PhoRC Sfmbt Scm-related gene containing four mbt domains dRAF Kdm2 Lysine (K)-specific demethylase 2 PRC2 Jarid2 Jumonji, AT rich interactive domain 2
PRC2 jing jing
PRC2 escl escl
PRC2 Pcl Polycomblike
- crm cramped
- mxc multi sex combs
- Ogt super sex combs
1.4.1. PRC1
Drosophila PRC1 is composed of four core proteins, namely Polycomb (Pc); polyhomeotic distal or proximal (Ph-d, Ph-p); Posterior sex combs (Psc) and Sex combs extra (Sce) (Shao et al., 1999). PRC1 inhibits transcription and chromatin remodeling, compacts the chromatin and ubiquitylates chromatin. One of its components, Pc, contains a 37 amino acid long chromo domain responsible for its binding, and thereby PRC1 binding, to H3K27me3 (Cao et al., 2002; R. Paro & Hogness, 1991). This domain is also sufficient to target Pc to PcG-regulated genes (Kassis et al., 2017). Ph-p and Ph-d are nearly identical Ph-proteins encoded by adjacent genes and containing a sterile α-motif (SAM) protein-protein interaction domain (Kassis et al., 2017). Ph-p and Ph-d SAM can self-associate as a helical polymer in vitro and is required for clustering PRC1 complexes (Kim et al., 2002; Wani et al., 2016). Ph SAM can also polymerize with the SAM of another PcG protein called Sex comb on midleg (Scm) (Kim et al., 2005). Psc, on the other hand, is responsible for the chromatin compaction and the inhibition of chromatin remodeling and transcription functions of PRC1 via its C-terminal region. Its homology region, which includes a ring finger and a helix-turn-helix motif, is involved in Psc incorporation into PRC1 (Kassis et al., 2017). The last component of PRC1, Sce, contains a ring finger domain involved in the ubiquitylation of histone H2A at lysine 118 (H2AK118ub) (Gutiérrez et al., 2012; Kassis et al., 2017; Schuettengruber et al., 2017) (Table 1, p.31; Figure 1, p.35). In mammalian cells, PRC1 is considered to come in two main classes: canonical and non-canonical. Canonical PRC1s contain homologues of the four core PRC1 proteins mentioned above. Non-canonical PRC1s lacks Pc (Cbx) and Ph (PHC) homologues (Schuettengruber et al., 2017). Within these classes, there are multiple isoforms defined by which of several Cbx and/or Pcgf subunits is present, and other accessory proteins (Schuettengruber et al., 2017).
1.4.2. dRAF
dRAF is analogous to non-canonical PRC1 in mammalian cells (Schuettengruber et al., 2017). It contains Lysine (K)-specific demethylase 2 (Kdm2) as well as Psc and Sce, but lacks Pc or Ph (Lagarou et al., 2008). Kdm2 demethylates H3K36me2 (Kassis et al., 2017) (Table 1, p.31; Figure
1.4.3. PRC2
Drosophila PRC2 core is made up of Enhancer of zeste (E(z)), Su(z)12, p55 and extra sex combs (Esc) (Müller et al., 2002; Ng et al., 2000; Tie et al., 2001). The SET domain of E(z) is responsible for the main activity of PRC2, which is the methylation of H3K27. The VEFS domain of Su(z)12 is known to reinforce E(z) histone methyltransferase activity. p55 is a WD-repeat protein, whose role in PRC2 is currently unclear (Kassis et al., 2017). Finally, Esc is also a WD-repeat protein, which can bind E(Z), H3K27me3 and the histone core (Kassis et al., 2017) (Table 1, p.31; Figure 1, p.35).
1.4.4. PR-DUB
PR-DUB consists of Calypso and Additional sex combs (Asx). Calypso is the catalytic subunit containing a ubiquitin C-terminal hydrolases domain which deubiquitinates H2AK118ub. Asx reinforces calypso’s activity (Kassis et al., 2017) (Table 1, p.31; Figure 1, p.35).
1.4.5. PhoRC
PhoRC contains pleiohomeotic (Pho) or pleiohomeotic like (Phol) and Scm-related gene containing four mbt domains (Sfmbt) (Klymenko et al., 2006; Scheuermann et al., 2010) (Table 1, p.31). Both Pho and Phol contain four zinc fingers allowing a specific DNA-binding activity and a "spacer" domain which binds to the malignant brain tumor (MBT) repeats of Sfmbt (Brown et al., 2003; Kassis et al., 2017). Sfmbt contains four MBT domains and a SAM. The MBT domains of Sfmbt can bind mono- or di-methylated H3K9 or H3K20 (lysine 20 of histone H3) (Klymenko et al., 2006). Like Ph SAM, Sfmbt SAM can bind the Scm-SAM (Figure 1, p.35). Unlike the other PcG complexes, PhoRC has not been clearly identified outside of Drosophila (Frey et al., 2016).
1.4.6. Other PcG Proteins
Other members of the PcG have been identified either genetically, or biochemically in other species. These include Jumonji, AT rich interactive domain 2 (Jarid2); Jing; Escl; Polycomblike (Pcl); cramped (Crm); multi sex combs (Mxc); O-glycosyltransferase (Ogt) and Scm (Kassis et al., 2017). Jarid2 and jing are homologs of PcG proteins in mammalian PRC2, however, their role in
association with PRC2 via binding to E(z) (O’Connell et al., 2001). Pcl also contains a tudor domain, however, unlike other tudor domain, it does not recognize methylated lysine or arginine (Friberg et al., 2010). Although some studies suggest a developmental stage specific role for Pcl, its role is currently not fully understood (Kassis et al., 2017; Nekrasov et al., 2007; Savla et al., 2008). Mxc and Crm both have unknown functions. Ogt is the O-linked glycosyltransferase in Drosophila. It glycosylates Ph at a serine/threonine region, which seems to explain its PcG phenotype, although it also has other substrates (Kassis et al., 2017). Finally Scm contains two MBT repeats, a SAM and two zinc fingers (Bornemann et al., 1996). Scm is a substoichiometric component of PRC1 (Saurin et al., 2001; Shao et al., 1999). It also interacts weakly with PRC2 (H. Kang et al., 2015) (Table 1, p.31; Figure 1, p.35).
1.4.7. PcG Proteins Convey Epigenetic Memory of Gene Silencing
PcG proteins have various functions. Over the course of Drosophila embryogenesis, products of the maternal gap and pair-rule genes are responsible for the establishment of Hox gene expression pattern. Although these genes are only transiently expressed, the Hox gene expression pattern is fixed for the life of the fly. PcG proteins were discovered to provide the long term memory of Hox gene repressive state (Maeda & Karch, 2006). PcG protein action is mediated by epigenetic changes to chromatin including modification of histones (Kassis et al., 2017; Ringrose & Paro, 2004). Although PcG protein were initially discovered as regulators of Hox genes, studies revealed that PcG proteins are implicated in other cellular processes such as cell cycle control (Martinez & Cavalli, 2006). In addition to their role in the regulation of Hox genes, PcG proteins also target non-Hox genes, as illustrated by chromatin immunoprecipitation (ChIP) experiments which indicate that there are hundreds to thousands of PcG protein binding sites in Drosophila (Kassis et al., 2017; Steffen & Ringrose, 2014).
1.5. PcG Protein Recruitment
How PcG proteins are recruited to specific genes is currently poorly understood. The only PcG protein with defined sequence-specific DNA binding activity is Pho/Phol (Kassis et al., 2017). An initial model for PcG protein targeting was that Pho binds to specific sites (using the DNA sequence recognition activity of Pho) and recruits PRC2 to the chromatin by interacting with E(z) and esc. PRC2 then deposits H3K27me3 marks, which finally recruits PRC1 (L. Wang et al., 2004). This model did not withstand global tests: Pho binding sites alone are not sufficient for PcG protein recruitment and it was suggested that other DNA-binding proteins might facilitate Pho binding to DNA (Kassis et al., 2017; Kassis & Brown, 2013). It is currently thought that there are multiple recruitment mechanisms for both PRC1 and PRC2. These include interactions with transcription factors, interactions among PcG complexes, recognition of histone modifications, and likely additional mechanisms including those involving RNA (Alecki et al., 2020; Kassis et al., 2017).
1.5.1. Polycomb Response Elements
In Drosophila, at Hox gene complexes and other genes outside of Hox gene loci, PcG proteins bind to cis-regulatory DNA elements called Polycomb Response Elements (PREs) (Steffen & Ringrose, 2014). PREs are defined as DNA sequences which can recruit PcG proteins and mediate the repression of linked genes in transgenic studies (Delest et al., 2012). Each gene can be repressed by one or more PREs and their activity relies on the genomic context. Tens of kilobases can separate PREs and the promoter they regulate (Kassis & Brown, 2013). The mechanisms of PcG protein recruitment is currently not fully understood. However, since PREs contain binding site for a large number of DNA-binding proteins, it is believed that these proteins help recruit PcG proteins through physical interactions (Kassis et al., 2017). DNA binding proteins that bind at PREs include pho, GAGA factor (GAF), pipsqueak (psq), Sp1-like factor for pairing-sensitive silencing (Spps), combgap (cg), Dorsal switch protein 1 (Dsp1), grainy head (grh), Adh transcription factor 1 (Adf1), zeste (z) and female sterile (1) homeotic (fs(1)h) (Kassis et al., 2017).
PREs work with enhancers to maintain gene expression pattern in that the transcriptional status initially determined by transcription factors’ action at enhancers can be maintained by PREs for several cell divisions and in the absence of the initial transcription factors. Thus, PREs mediate epigenetic memory of transcriptional states (Bauer et al., 2016).
1.5.2. SAM Scaffold
One pathway that may contribute to PcG recruitment can be termed a "SAM scaffold". Three PcG proteins, Sfmbt (part of PhoRC), Scm (can associate with PRC1), and Ph (part of PRC1) contain SAMs. The SAM of Sfmbt can bind to the Scm-SAM, which can interact with the Ph-SAM. This may form a recruitment pathway from PhoRC to PRC1 through Scm (Frey et al., 2016). This pathway may act together with the DNA binding activity of Pho, as well as with other PRE DNA-binding proteins that bind PRC1 (Kassis et al., 2017; Kassis & Brown, 2013).
1.5.3. PcG Recruitment by R-loops
stranded nucleic acid structures that form when an RNA displaces a DNA strand by hybridizing with the complementary DNA. The authors also showed that PRC2 can induce the formation of RNA-DNA hybrids and that both PRC1 and PRC2 can recognize R-loops (or open DNA bubbles) in vitro (Alecki et al., 2020). A study in mammalian cells also identified R-loops at some PcG protein binding sites and implicated them in the targeting of PRC1 (Skourti-Stathaki et al., 2019).
1.5.4. Histone Modifications Further Stabilize PcG Protein Recruitment
Because H3K27me3 placed by PRC2 can be specifically recognized by PRC1, H3K27me3 was though to be essential for the recruitment of PRC1. However, explicit tests of this model indicate that PRC1 is still recruited to PREs in the absence of H3K27me3. Nevertheless, the level of PRC1 binding is lower in the absence of H3K27me3, suggesting this modification, which surrounds PREs, stabilizes PcG protein binding (Kahn et al., 2016).
1.6. Trithorax Group Proteins Counteract PcG Proteins
Trithorax Group genes were initially identified as genes that suppress the PcG phenotype. Mutation of TrxG genes causes embryonic segments to transform into more anterior ones by antagonizing PcG genes (Kassis et al., 2017; Schuettengruber et al., 2017). TrxG proteins include ATP-dependent chromatin remodeling factors, members of the Mediator complex, members of the cohesin complex, chromatin binding proteins, and histone modifying enzymes. TrxG proteins constitute another group of epigenetic interactors that can counteract PcG proteins action, in part through modification of chromatin (Steffen & Ringrose, 2014).
Histone modifications catalyzed by TrxG proteins can antagonize those catalyzed by PcG proteins. For example, H3K4 and H3K36 methylation catalyzed by TrxG proteins inhibit H3K27 trimethylation by PRC2. Further, acetylation of H3K27 by a TrxG protein, and its trimethylation by PRC2 are mutually exclusive (Steffen & Ringrose, 2014). Antagonism between PcG and TrxG protein is also illustrated by their opposing action on chromatin: PRC1 promotes chromatin compaction while H3K27ac, facilitated by TrxG proteins, promotes open chromatin (Steffen & Ringrose, 2014).
TrxG proteins are also recruited to PREs and thus share common binding sites with PcG proteins in polytene chromosome staining and ChIP studies. Even less is understood about how TrxG proteins are recruited to PREs than how PcG proteins are (Kassis et al., 2017). Nevertheless, several PREs have been shown to be switchable elements capable of maintaining both silenced and activated states, through the respective actions of PcG or TrxG proteins. The activities of TrxG and PcG proteins are balanced to maintain gene expression states (Ringrose & Paro, 2004). It is important to note that regulation of transcription of PcG and TrxG targets goes beyond a binary, "on" and "off", state: transcriptional output might range from a decreased or increased to complete silencing or activation (Delest et al., 2012; Ringrose & Paro, 2004).
1.7. PcG Protein Removal from Chromatin
PcG proteins are removed from chromatin in 2 cases: during development when genes switch from "off" to "on" and each time cells go through mitosis.
1.7.1. PcG Proteins Can be Removed from Chromatin During Development
In the context of spermatocyte differentiation, transcription factors can displace PcG Proteins. Indeed, testis-specific homologs of TATA-binding protein-associated factors allow the transcription of terminal differentiation genes partly by displacing PcG proteins from their promoters (X. Chen et al., 2005, 2011).
An excessive dose of an activator can also overcome PcG Silencing. A study was carried on a transgenic Drosophila line carrying a heat-shock inducible GAL4 driver regulating a lacZ reporter flanked by a PRE. Massive doses of GAL4 induced in embryos could disrupt PcG silencing of the reporter, and this effect persisted. However, disruption of PcG-mediated silencing was less effective after embryogenesis. This suggests that PcG-repressed chromatin is more plastic in embryos and progressively becomes more committed over the course of development, although the molecular basis of this effect is not known (Cavalli & Paro, 1998, 1999; Schwartz & Pirrotta, 2007).
disc cells are cultivated over a long period, and then implanted in larvae, corresponding structures are differentiated from the implanted cells: for example, leg disc cells lead to the formation of leg structures. In a phenomenon called "transdetermination", some disc cells can change their determined state (Klebes et al., 2005). In studies analyzing the transdetermination of cells upon ectopic overexpression of wingless, PcG gene expression was reduced in cells switching identity. This could alter the balance between TrxG and PcG protein mechanisms thereby favouring the resetting of epigenetic state (Klebes et al., 2005; Lee et al., 2005; Schwartz & Pirrotta, 2007).
1.7.2. PcG Proteins Can Be Removed During Mitosis
Mitosis is defined as the process by which duplicated chromosomes are equally segregated to daughter cells (Boettcher & Barral, 2013). Several events of mitosis alter the binding of chromatin proteins, including PcG proteins.
1.7.2.1. Nuclear Envelope During Mitosis
In eukaryotic organisms like Drosophila, chromosomes are surrounded by a double membrane: the nuclear envelope. It can adopt three types of morphology during mitosis: it can remain intact (closed mitosis), completely disassembled (opened mitosis) or fenestrated (semi-opened mitosis). Semi-opened mitosis occurs in Drosophila early embryonic and neuroblast divisions, in Kc cells and in S2R+ cells. This means that during early stages of mitosis, remnants of the nuclear envelope are still visible (Boettcher & Barral, 2013; Debec & Marcaillou, 1997; Maiato et al., 2006, 2006). Because the nuclear envelope breaks down during mitosis, nuclear proteins may access the whole cell volume, and thereby be diluted (Fonseca et al., 2012; Steffen & Ringrose, 2014). This dilution may shift binding equilibria to the unbound state, and thereby contribute to decreased chromatin binding in mitosis. Dilution might be limited in semi-opened mitosis.
1.7.2.2. Chromatin During Mitosis
Some attributes of the chromatin can also alter the binding of chromatin proteins. During mitosis, transcription is silenced. This was demonstrated by experiments showing that mitotic cells failed to incorporate radioactive NTPs (Johnson & Holland, 1965; Prescott & Bender, 1962).
compaction was initially proposed as a cause of transcriptional silencing by decreased accessibility of mitotic chromosomes to the transcriptional machinery, this hypothesis was later refuted (Gottesfeld & Forbes, 1997; Johnson & Holland, 1965). Indeed, a subsequent study showed that mitotic chromatin remained accessible to both structural proteins and transcription factors (D. Chen et al., 2005).
Post translational modification (PTM) of proteins, however, is key to transcriptional silencing in mitosis and is another way to alter chromatin protein binding. Indeed, in a mechanism referred to as "phospho-methyl switching", phosphorylation of histone residues next to ones that can be methylated and read by chromatin proteins can lead to their displacement. Thus, phosphorylation of histone H3 at threonine 3 has been shown to cause the displacement of TFIID, a protein complex capable of reading H3K4me3 mark (Festuccia et al., 2017; Varier et al., 2010). Another example of phospho-methyl switching involved HP1. This protein recognizes H3K9me3 marks and has a greatly reduced binding activity upon phosphorylation of histone H3 at serine 10 (H3S10p) and binds poorly to histone tails containing both modifications (Fischle et al., 2005, p. 1; Hirota et al., 2005). Finally, H3S28 is phosphorylated in mitosis, and this can reduce binding of Pc to H3K27me3, and likely contributes to the release of PRC1 from chromatin in mitosis (Fonseca et al., 2012). Modification of non-histone chromatin proteins themselves can also alter their chromatin binding in mitosis and is implicated in silencing transcription in mitosis. One example is the inactivation of the ATP-dependent chromatin remodeling complex SWI/SNF by phosphorylation in mitosis (Sif et al., 1998). Phosphorylation of the transcription factors Ikaros and Sp1, disrupts their DNA binding activity in mitosis (Dovat et al., 2002).
After mitosis, transcription must restart, and the gene expression profile must be resumed for the sake of cellular identity maintenance. This implies that previously silenced genes in the parent cells must remain silenced in the daughter cell while previously expressed genes must be re-expressed upon mitotic exit. Transcriptional silencing and the alteration of both chromatin composition and structure described above thus reveal a potential problem: how can gene expression profiles be restored after mitosis?
1.7.2.3. Mitotic Bookmarking
Despite transcriptional repression, the release of many chromatin proteins occurring during mitosis, and the drastic reorganization of the nuclear content in general, not all traces of gene transcription or repression are erased from chromatin during mitosis (Kadauke & Blobel, 2013). Certain DNA binding proteins and transcription co-factors were found to persist on mitotic chromatin (Kadauke & Blobel, 2013). In fact, it has been suggested that the number of persistent transcription factors on mitotic chromosome may be underestimated. This is due in part to technical limitations such as a recently described formaldehyde-induced exclusion of some proteins from mitotic chromosomes (Teves et al., 2016). Other persistent traces of gene activity might stem from stable histone modifications and nucleosome architecture (Kadauke & Blobel, 2013). Together, these observations prompted a model referred to as the "mitotic bookmarking model", where it is believed that so called "bookmarking factors" help convey regulatory information to daughter cells by binding to specific regulatory elements during mitosis (Festuccia et al., 2017).
1.7.2.4. PcG Proteins in Mitosis
The behaviour of PcG proteins during mitosis remains poorly understood. Some studies have reported that PcG proteins such as Pc, Ph and Psc are detached from chromatin during mitosis (Beck et al., 2010; Buchenau et al., 1998). However, as previously mentioned, results from these experiments may be impacted by the use of formaldehyde to fix samples (Fanti et al., 2008; Teves et al., 2016).
Experiments on live samples or using different fixation conditions, which overcome this problem, have reported that PcG proteins can be retained on mitotic chromosomes (Fanti et al., 2008; Fonseca et al., 2012). The study on live samples showed that only a small fraction of GFP-PC and GFP-PH bound metaphase chromosomes (0.4-2%) compared to interphase chromosome (30-70% for GFP-PC and 10-20% for GFP-PH). Residence time of some PcG proteins was up to 300-fold longer compared to interphase cells, which led to the suggestion that PcG protein chromatin binding properties in metaphase are different from those of interphase (Fonseca et al., 2012).
Another study used immunofluorescence and subcellular fractionation to show that Psc and Ph remain on the chromatin during mitosis. ChIP experiments showed that the persistent binding sites of these proteins were specific and corresponded to a subset of interphase binding sites. Persistent sites often overlap borders between chromatin domains. The same study also showed that the histone mark H3K27me3 level were unchanged in mitosis. From there, persistent binding sites have been proposed to act as nucleation sites recruiting PcG proteins after mitosis while the H3K27me3 histone mark and possibly other persistent chromatin features at non specific binding sites may help the spreading and recruitment of PcG proteins into chromatin domain regions (Follmer et al., 2012) (Figure 2, p.44).
Figure 2. – Mitotic Bookmarking by PcG Proteins. PcG proteins bind their target sites during interphase, including those at chromatin domain borders. During mitosis, PcG proteins remain at some chromatin border but not at PREs and other well-known targets. H3K27m3 marks remain unchanged which prompts the hypothesis that persistent binding sites are nucleation sites that help recruit PcG proteins back onto the chromatin while H3K27me3 helps spread and recruit the proteins to the vacated interphase binding sites. Adapted from Follmer et al., 2012.
1.8. Summary
Mitosis is a short step of the cell cycle during which the chromatin structure is greatly altered by events like chromatin compaction, transcriptional repression and the release of many transcription factors. Despite these events, a cell can still maintain its gene expression profile and transmit it to daughter cells (Festuccia et al., 2017; Kadauke & Blobel, 2013). To understand how gene expression profiles may be maintained through mitosis, the present work focuses on the well conserved PcG proteins. PcG proteins act on chromatin to maintain gene repression through multiple cell divisions during development (Steffen & Ringrose, 2014). In the cell cycle context, these proteins are known to mainly bind their chromatin target during interphase, while during mitosis, only a small fraction of targets remain occupied. Because H3K27me3 marks also persist during mitosis, it has been hypothesized that these persistent PcG proteins binding sites act as nucleation sites while the H3K27me3 marks (and potentially other chromatin features) help in the spreading of PcG proteins to sites vacated in mitosis (Follmer et al., 2012). However, little is known about how the behaviour of PcG proteins is controlled in mitosis. Hence the purpose of this project: the identification of factors influencing the chromatin binding of PcG proteins across the cell cycle. To this end, a high throughput imaging-based RNA interference (RNAi) screen in Drosophila S2R+ cells was performed.
1.9. Proof of Concept
1.9.1. RNAi Screen
RNAi is the process by which small ribonucleic acids (RNAs), from either external or internal sources, reduce gene expression, usually by causing the degradation of complementary cellular messenger RNAs. In Drosophila, this pathway can be triggered by the recognition of an internally or externally supplied double-stranded RNA (dsRNA) by a ribonuclease III called Dicer-2 (Dcr-2). Dcr-2 cleaves the dsRNA into small fragments called small interfering RNAs (siRNAs). The siRNAs are then bound by proteins of the RNA-induced silencing complex (RISC) including Argonaute 2 (Ago2) which is required for siRNA unwinding. Guided by the small RNA, RISC can then cut target
RNAi pathway is harnessed to decrease target gene expression by providing long dsRNAs, synthetic siRNAs, short hairpin RNAs (shRNAs) or endoribonuclease-prepared siRNAs (esiRNAs) (S. Mohr et al., 2010) (Figure 3, p.47). In the case of the present work, the impact of RNAi-induced gene repression on binding of the PcG protein Ph to chromatin was assessed by immunofluorescence.
Figure 3. – RNAi in Drosophila. Externally supplied dsRNAs or esiRNAs are recognized by 2. Dcr-2 cleaves dsRNAs or esiRNAs into siRNAs which are then bound and unwound by AgoDcr-2. Other proteins bind Ago2 and the siRNA to form the RISC complex, which, guided by the siRNA, binds to complementary mRNA and induce their degradation.
RNAi screens in Drosophila cells have been used previously to identify genes that control events in mitosis, the binding of chromatin-associated proteins, and the formation of PcG bodies (Gonzalez et al., 2014; Somma et al., 2008; Swenson et al., 2016). As previously mentioned, PcG proteins are well conserved across species and the system is simpler in Drosophila than in mammals, thus justifying the use of this model for this study (Whitcomb et al., 2007). Drosophila cells are also good for RNAi screens as they can grow under ambient CO2 levels and at room temperature (Echeverri & Perrimon, 2006). The S2R+ cell line, used for our experiments and many RNAi screens, takes up dsRNA without requiring transfection, and is adherent, which facilitates imaging based screens (Clemens et al., 2000; Echeverri & Perrimon, 2006; Ramadan et al., 2007; Rogers & Rogers, 2008; Yanagawa et al., 1998). Unlike S2 cells, PcG proteins are not commonly studied in S2R+ cells. Nevertheless, S2 and S2R+ cells are both derived from embryos near hatching (I. Schneider, 1972; Yanagawa et al., 1998). Besides, S2 cells were previously used to study PcG protein binding on chromatin and PcG proteins were shown to bind PREs in S2R+ cells (Follmer et al., 2012; Orsi et al., 2014).
1.9.2. RNAi Screen Analysis
Data analysis is an important aspect of RNAi screen. It can be subdivided into four steps: data triage, data normalization, quality control and hit identification. The increasing popularity of RNAi screens over the years has lead to the development of various analysis methods for each of the last three steps (Birmingham et al., 2009).
1.9.2.1. Data Triage
Data triage is the process of removing any unusable data based on specific criteria. It is initiated while the screen is in progress to ensure the proper progression of the screen (in other words: to ensure that usable data are being generated). Several potential issues should be evaluated. For instance, the experimenter should check for any position effects and unusual plate hit rates. An efficient way to do this is to use plate visualization methods, including heat maps, plate-well scatter plots (also known as plate-well series plots) and replicate correlation plots. Another way to ensure the production of usable data is the calculation of quality metrics (discussed below)
the present work, checking that the images acquired can be automatically processed, and confirming the validity of image processing should also be done at this stage.
1.9.2.2. Data Normalization
Following data triage, is data normalization: the process by which systematic errors are removed and comparison and combination of data from different plates is made possible. Two categories of normalization methods can be applied: per plate or per experiment. Unless there is a known per-plate bias, per plate normalization is usually performed. Another attribute to address at the normalization stage is the choice of sample to use as negative controls. Some methods use all samples as de facto negative controls, while others only use control samples as negative controls. When experimental samples are more numerous than controls (as is typically the case) or when no efficient negative control is available, using samples as de facto negative controls should provide more accurate measurements. However, this is only true when most samples are expected not to display any biological effect. Displaying samples randomly in the screening plates and using robust analyses should allow the use of samples as de facto negative controls, and was done in the present work (Birmingham et al., 2009; Malo et al., 2006).
Sample normalization methods include fraction or percent of control, fraction or percent of samples, z score, robust z score and B score. Similar to z score and robust z score, B score is the ratio of an adjusted value over a measure of variability while fraction or percent of control and fraction or percent of samples methods do not correct for sample variation. z score and percent of control methods can be sensitive to outliers since these are calculated based on sample mean and standard deviation, and control mean respectively. z score and B score can also be skewed if real hits are unevenly distributed on plates, a drawback that can be avoided by randomization of sample distribution across plates. Finally, B score is the only normalization method that adjusts for positional effects within plates. From the previous points, the use of either robust z-score or B score normalization methods were recommended (Birmingham et al., 2009; Brideau et al., 2003; Malo et al., 2006).
followed by quantile normalization and scaling followed by quantile normalization. Out of the seven established normalization methods tested, only one has previously been used in RNAi screen (cellHTS2) and results suggest that no single method excelled (Wiles et al., 2008). In most cases, acceptable results are obtainable when reasonable choices are made and screeners should pick a normalization method that is suitable to their data and analysis capacities (Birmingham et al., 2009).
1.9.2.3. Quality Control
Quality control is based on the degree to which known negatives are negative and known positives are positive. When appropriate controls are selected, quality control defines the likely range of biological effects and helps to insure that biological effects will be detectable and interpretable (Birmingham et al., 2009). Various metrics for quality control have been developed. One set of popular quality metrics is the Z-factor and the Z’-factor, which are used in small-molecule screens, and can also be used for RNAi screens. Z-factor measures the separation between samples and negative controls while Z’-factor measures the separation between positive and negative controls. Thus, good Z’-factor values can be generated with strong positive controls but might not be representative of positive screen hits. Because small effects can be relevant in RNAi screens, and because signal-to-background ratio can be lower in RNAi screens than in small molecule screens, less stringent quality thresholds (for either Z-factor and Z’-factor) may be used (Birmingham et al., 2009). Another quality control metric was developed for RNAi screens to address moderate control limitations: strictly standardized mean difference (SSMD). SSMD also measures the magnitude of difference between two populations. However, with this metric, set threshold values depend on positive control strength. SSMD is more statistically rigorous, less conservative and has a clear probability interpretation (Birmingham et al., 2009; Zhang, 2007). SSMD was used for the present RNAi screen.
1.9.2.4. Hit Identification
Hit identification is the ultimate goal of RNAi screen. It is defined as "the process of deciding which sample values differ meaningfully from those of the negative controls". In some cases, an
the limitation of false positive identification (Birmingham et al., 2009). In order to limit the likelihood of false positive identification, the screener can use various reagents to test the same candidate and select hits based on results from all reagents. Selecting hits based on various screening outputs also limit the identification of false positives (Birmingham et al., 2009). Another way to proceed would be to use one of the methods described below.
Some small molecule-derived techniques can be used for hit identification in RNAi screen. These include mean ± k standard deviation, median ± k median absolute deviation (MAD) and multiple t-tests methods (Birmingham et al., 2009; Chung et al., 2008). Other hit identification methods that can be used for RNAi screen include: SSMD for hit identification, quartile-based, redundant siRNA activity, rank product and Bayesian models methods (Birmingham et al., 2009; Douglas Zhang et al., 2006). The simplest methods in terms of calculations are small molecule-derived techniques and the quartile-based method. Among these, the mean ± k standard deviation can miss weak positives and is sensitive to outliers, since it uses mean and standard deviation values. The multiple t-tests method is also sensitive to outliers, in addition to requiring at least triplicates that are normally distributed. Meanwhile, the median ± k MAD and quartile-based methods can both identify weaker hits and are not sensitive to outliers since these are based on median or quartile values. The quartile-based method also offers the advantage of being robust to non-symmetrical data distributions (Birmingham et al., 2009; Chung et al., 2008; Douglas Zhang et al., 2006). For these reasons, median ± k MAD and quartile-based methods were used for the present RNAi screen.
Both methods are similar in principle: in any given sample value data distribution, any sample whose value locates at the extreme ends of the data distribution would qualify as a hit. The difference between both methods rely on the calculation of threshold values used to determine the extreme ends on the data distribution. With the median ± k MAD or MAD-based method, any sample whose value is superior to or equal to sample median + k MAD, or whose value is inferior to or equal to sample median - k MAD, with k being a constant, would qualify as a hit. The higher the k value is, the more stringent the analysis is. With the quartile-based method, the upper
Q1-2c(Q2-Q1). Q stands for quartile and c is a constant. Similar to k in the MAD-based method: the higher the c value is, the more stringent the analysis is. A value of 0.9826 for c would correspond to a k value of 2, and a value of 1.7239 for c would correspond to a k value of 3 (Chung et al., 2008; Douglas Zhang et al., 2006).
2. Chapter 2 – Experimental Procedures
2.1. Overall Strategy
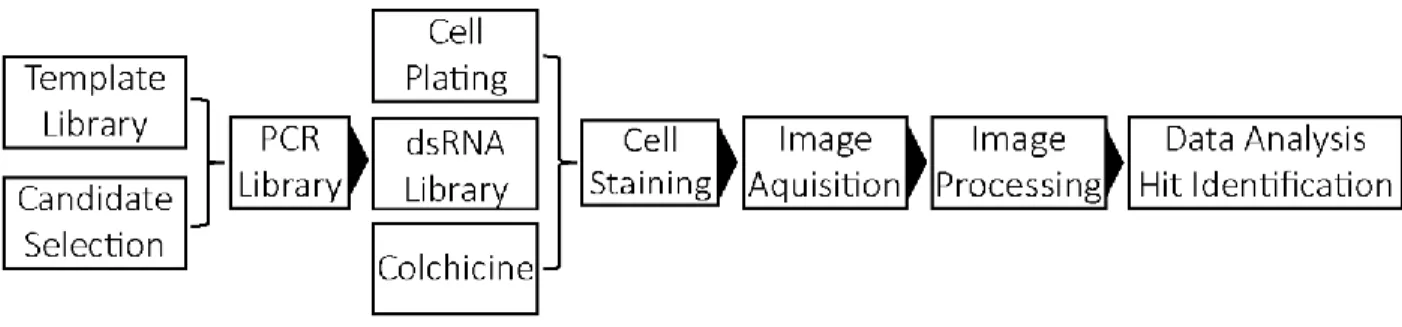
To identify genes that control levels of PcG proteins on chromatin, we performed an imaging-based RNAi screen in Drosophila cells. The overall strategy is depicted in figure 4 (p.54): 541 candidate genes were selected and dsRNAs were produced by in vitro transcription from polymerase chain reaction (PCR)-generated DNA templates made from RNAi template libraries (Open Biosystems), or from S2 cell genomic DNA. S2R+ cells were plated on 96 well imaging plates and treated with dsRNA targeting one gene. Negative (irrelevant dsRNA) and positive (dsRNA targeting Ph) controls were included on each plate. Prior to fixation, cells were treated with colchicine, which blocks cells in metaphase, to increase the number of mitotic cells (Follmer et al., 2012; Leung et al., 2015). Cells were fixed and processed for immunofluorescence with antibodies against the PcG protein Ph and α-tubulin (to label the cytoplasm). Hoechst was used to label the DNA. 24 pictures per well were acquired in each of the three channels (Ph, α-tubulin, Hoechst) using a high content screening (HCS) microscope (Molecular Devices). Images were processed with CellProfiler™ (Version 3.0.0) (Carpenter et al., 2006). The intensity of Ph staining in the nucleus (or on chromatin for mitotic cells) and cytoplasm was measured in each well. Screen hits (increased or decreased Ph binding to chromosomes) were identified from the processed data using MAD-based and quartile-based analysis methods (Birmingham et al., 2009; Chung et al., 2008; Douglas Zhang et al., 2006). For primary screen hits, quantitative Western blot analysis of dsRNA treated cells was used to determine if changes in Ph levels on chromatin reflect changes in total protein level.
2.2. Candidate Gene Selection
An initial set of 1000 candidate genes that met at least one of the following criteria was generated from the literature and public databases:
• genes involved in chromosome morphology in mitosis (only newly identified genes that are implicated in chromosome integrity and mitosis) (Somma et al., 2008);
• kinases and phosphatases involved in cell cycle progression (Bettencourt-Dias et al., 2004; F. Chen et al., 2007);
• genes associated with GO terms (identified using QueryBuilder in Flybase) "mitotic cell cycle" (GO:0000278) and "chromatin binding" (GO:0003682), "histone modification" (GO:0016570), "DNA binding" (GO:0003677) or "chromatin remodeling" (GO:0006338) but not with "cytokinesis" (GO:0000910), "spindle assembly" (GO:0051225) or "spindle organization" (GO:0007051) (Ashburner et al., 2000; The Gene Ontology Consortium, 2019; Thurmond et al., 2019);
• PcG genes (FBgg0000309) (Thurmond et al., 2019); • TrxG genes (FBgg0000303) (Thurmond et al., 2019);
• PcG and TrxG genetic and physical interactors (Thurmond et al., 2019);
• genes encoding proteins that co-purified with Ph in affinity purification-mass spectrometry experiments (AP-MS) performed in the lab (unpublished) (Jonathan Boulais, Ajaz Wani, Christine Munger);
• cherry-picked candidates
Cherry picked candidates included cyclin-dependent kinases, helicases, heat shock proteins, structural maintenance of chromosomes (SMC) genes, topoisomerases, ribonucleases (ribonuclease H1 and CG13690), genes related to SUMOylation or ubiquitylation, and genes coding for members of TFIID. Cyclin-dependent kinases were selected for their role in cell cycle regulation which might affect PcG protein binding to chromatin across the cell cycle (Roskoski, 2019). Helicases were selected because it has been suggested that they could switch the
binding to chromatin either directly or indirectly (Wu et al., 2017). SMC genes and topoisomerases were selected for their effect on chromatin structure (Carter & Sjögren, 2012). Cherry-picked ribonucleases were selected for their DNA-RNA hybrid nuclease activity which could resolve R-loops at PRE and switch their state (Alecki et al., 2020; H. Zhao et al., 2018). PcG protein have previously been related to SUMOylation and some PcG proteins are known to have a role in ubiquitylation hence the inclusion of genes related to these processes (Gonzalez et al., 2014; X. Kang et al., 2010; Kassis et al., 2017). Finally, TFIID, a component of the preinitiation complex, is necessary for transcription and might impact PcG binding to chromatin, hence the addition of its members to the list of candidate genes (Antonova et al., 2019).
Since the screen was semi-automated, this primary list was refined through several rounds of filtering to obtain a manageable number of candidates. First, candidates that were not expressed in S2R+ cells were removed using a tool available at: https://www.flyrnai.org/cellexpress (Cherbas et al., 2011; Flockhart et al., 2012; S. E. Mohr et al., 2014). For the remaining of the refining process, genes present in the primary list based on a single criterion were removed. Genes related to cytokinesis, spindle assembly and spindle organization based on their associated GO term and/or results of an RNAi screen aimed at identifying genes required for spindle assembly were removed (Ashburner et al., 2000; Goshima et al., 2007; The Gene Ontology Consortium, 2019). Weakly expressed genes were also removed (Cherbas et al., 2011; Flockhart et al., 2012; S. E. Mohr et al., 2014). Genes that were selected only because of their association with the "histone modification" (GO:0016570) GO term were removed: as a biological process, those genes can be only remotely related to the term itself (Ashburner et al., 2000; The Gene Ontology Consortium, 2019). Genes involved in chromosome morphology in mitosis but also required for spindle assembly were removed (Somma et al., 2008). Kinases involved in cell cycle progression but for which knockdown leads to an abnormal cytokinetic index, centrosome defects and/or spindle defect with a phenotypic score outside the 95% confidence interval were removed (Bettencourt-Dias et al., 2004). Phosphatases with cell-cycle progression roles for which knockdown lead to either centrosome or spindle defects with a
Chen et al., 2007). Finally, genes that were not involved in either "gene expression" (GO:0010467) or "regulation of gene expression" (GO:0010468) were removed (Ashburner et al., 2000; The Gene Ontology Consortium, 2019). Weakly expressed or unexpressed candidates were removed since knocking them down should not have significant impact on PcG protein binding to chromatin. Genes related to cytokinesis, spindle organisation or assembly were removed as those are less likely to affect PcG protein binding to chromatin compared to other candidates. In total, 541 genes were selected as candidates for the RNAi screen (Table 2, p.58).
Table 2. – RNAi Screen Candidates. "Somma 2008"= newly identified genes involved in chromosome integrity and mitosis, "Bettencourt-Dias 2004"= kinases involved in cell cycle progression, "Chen 2007"= phosphatases involved in cell cycle progression, "PPI"=protein-protein interaction, "GI"=genetic interaction, "Mass Spec"= proteins which co-purified with Ph in an AP-MS experiment. Fly B as e I D Ann o ta ti o n s ymbo l G en e s ymbo l So mm a 2 00 8 Be tten co u rt -Di as 2 00 4 C h en 2 00 7 Mitotic cell cycle and Pc G Pr o te in Pc G PP I Pc G G I Tr xG Pr o te in Tr xG PP I Tr xG G I C h er ry pic ks M as s S p ec C h ro matin B in d in g Hi sto n e m o d if ic ati o n DN A bind in g C h ro matin re mo d el in g FBgn0250848 CG8947 26-29-p X FBgn0052016 CG32016 4E-T X FBgn0027620 CG1966 Acf X X FBgn0000043 CG12051 Act42A X X X FBgn0000042 CG4027 Act5C X X X X FBgn0263738 CG43663 Ada2a X FBgn0037555 CG9638 Ada2b X X FBgn0030891 CG7098 Ada3 X FBgn0284249 CG15845 Adf1 X X X FBgn0087035 CG7439 AGO2 X FBgn0082598 CG8580 akirin X FBgn0012036 CG3752 Aldh X FBgn0029512 CG12276 Aos1 X FBgn0034231 CG11419 APC10 X X FBgn0010348 CG8385 Arf79F X FBgn0000117 CG11579 arm X FBgn0038576 CG7940 Arp5 X X FBgn0030877 CG7846 Arp8 X X FBgn0032329 CG16840 Art8 X FBgn0029094 CG9383 asf1 X X FBgn0005386 CG8887 ash1 X X X FBgn0000139 CG6677 ash2 X X X X FBgn0261823 CG8787 Asx X X X X X X X X X FBgn0000147 CG3068 aurA X X FBgn0030093 CG7055 Bap111 X X X FBgn0042085 CG3274 Bap170 X X X