0,76 0,93 1,55 y = 0,5079e0,3556x R² = 0,942 0,00 0,50 1,00 1,50 2,00 2,50 2011 2012 2013 N u m b e r o f h e ad y = 0,0598x + 3,6071 R² = 0,916 y = 0,0561x + 2,7 R² = 0,8862 0 10 20 30 0 100 200 300 400 Wei gh t (k ilo gr am s) Age (day) Improved Local
Linéaire (Improved) Linéaire (Local)
Rural development through the introduction of improved goats: case of Attapeu, Lao PDR Andres L.1, Nguyen Cong O.2, Dinh Van T. 2, Vu Din Ton2, Lebailly Ph.1,
1
Ulg-Gembloux Agro Bio Tech, Economic and rural development unit
2
Vietnam National University of Agriculture, CEIDR
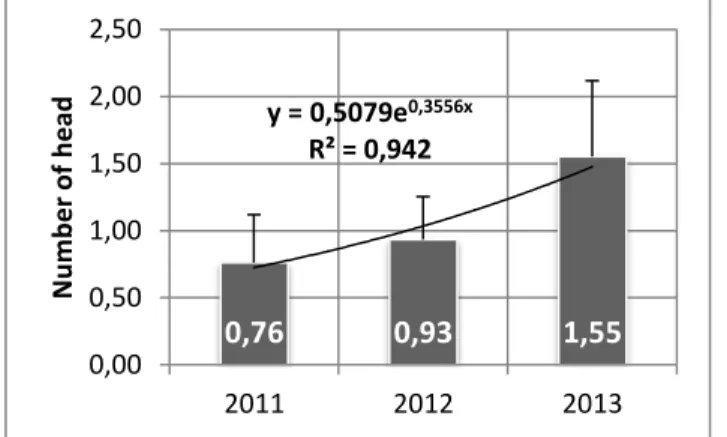
During Annadya’s project funding by European Union, the households were supported with improved goats. Annadya lasted from February 2012 to February 2015. The improved goats were introduced at 10 villages of Attapeu province in Lao PDR. This research tries to answer about the following question: what is the impact of improved goats in a rural family at Attapeu? The impact of this introduction was clearly analyzed after two or three years if the hazards didn’t caused a high mortality rate. The sustainability of this introduction was obtained with the introduction of new technics: feeding, permanent stable, medicine diagnostic and vaccine. The results came from a survey realized during the project’s monitoring in 2014. The main results were obtained with the number of birth per female, the income, and the weight. These parameters were relevant and were used to describe and show the impacts. The first result was the increase of goats per litter. In 2014, the survey showed a significant difference between the births per female before (2011) and after (2012-2013) the project. This difference represents one or two goat per litter. However, the variability depends on the age of the reproductive animal. The compare mean (t-test) is very highly significant between each year (Figure 1). The income was determinated by the goat's
size or age and the genetic improvement increase the goat size (2,450,800 KIP in 2013 compared to 832,500 KIP in 2011). In addition to the age, the growing conditions in 2013 were difficult because a flood disrupted the goat’s growth. In 2011, the average of sold goat per household was 2.5 while the average of 2012 was 3.5 goats. But in 2013, the average decreased to 2.75 goats. This decrease was due to diseases
caused by the flood. One of most important impacts was the weight. The figure 2 shows that the trend line was better for the improved goat.
In conclusion, the survey with the farmers indicated that the impact is reel and sustainable and the goat’s breeding isn't complicated to practice and to introduce in the food system of Attapeu.
Figure 1: number of head per reproductive animal