Centralised Planning of National Integrated Energy
System with Power-to-Gas and Gas Storages
Mathias Berger, David Radu, Raphael Fonteneau, Damien Ernst
Electrical Engineering and Computer Science DepartmentUniversity of Liège, Belgium {mathias.berger, dernst}@uliege.be
Thierry Deschuyteneer, Ghislain Detienne
Fluxys SABelgium
{thierry.deschuyteneer, ghislain.detienne}@fluxys.com
Abstract—This paper proposes an optimisation-based frame-work to tackle long-term centralised planning problems of inte-grated energy systems with bi-directional electricity-gas carriers coupling under various policy constraints. The framework is leveraged to gain insight into possible configurations of the future Belgian energy system, and identify the cost-optimal energy mix as well as short and long-term storage requirements to satisfy CO2 emissions reductions and energy security targets. Results
shed light on the economics of a transition to a low-carbon energy system and reveal the potential of power-to-gas and storage in gas form to help achieve ambitious emissions reduction goals.
Index Terms—Power-to-gas, gas storage, integrated energy systems, optimal system planning, hydrogen integration.
I. INTRODUCTION
The large-scale deployment of renewable energy technolo-gies for electricity generation has recently been promoted by policy-makers to curb CO2 emissions, and has lead to an accrued need for short and long-term storage capacity in the power system to handle volatile as well as seasonal renewable production patterns and reliably supply inflexible loads. Unfortunately, no electrical, electrochemical, thermal or mechanical storage options (besides perhaps hydro) currently offer cheap, grid-scale, long-term storage. By contrast, in countries with a gas network infrastructure, very large-scale gas storage facilities are often available for low-cost, long-term storage. In this context, power-to-gas technologies appear promising and constitute an avenue worth considering to broaden the scope of storage options.
This paper proposes a framework to tackle long-term cen-tralised planning problems of integrated energy systems with bi-directional electricity-gas carriers coupling. An aggregate system with simplified carrier physics is considered, in which the capacities of power generation, conversion as well as short and long-term storage technologies are sized to minimise energy costs under policy constraints, namely energy security and independence, as well as CO2 emissions quotas, whilst accounting for pre-existing infrastructure. Technologies con-sidered include solar PV, on/offshore wind turbines, combined cycle gas turbines (CCGT), other dispatchable technologies, e.g. combined heat and power (CHP), waste or biomass, along with batteries, pumped-hydro storage, electrolysis, methana-tion, hydrogen and methane storage.
The problem is formulated as a mixed-integer linear opti-misation program (MILP) with perfect foresight over the op-timisation horizon, sufficient degrees of temporal and
techno-economic detail to accurately represent system operation under high renewable penetration [1]. Investment decisions are made at the initial time instant and no discounting of future money flows is performed. Moreover, an optimisation horizon of five years with investment costs reduced to five-year equivalents is used to approximate the problem over the full planning horizon of twenty years, and reduce the computational burden. The planning and operational problems are solved concurrently, thereby yielding optimal sizes and operational schedules for all technologies. The framework is applied to the Belgian energy system, in order to identify the cost-optimal energy mix along with short and long-term storage requirements beyond 2025, when no nuclear power plants are assumed to be in operation. The remainder of this paper is organised as follows. Section II reviews related works on the operation and planning of integrated energy systems, and highlights the areas to which the present paper contributes. Section III describes the MILP formulation proposed, and a case study exploring configura-tions of the Belgian energy system beyond 2025 is presented in section IV. Finally, the paper is wrapped up with a conclusion and future work avenues are discussed in section V.
II. RELATEDWORKS
The topic of integrated energy systems has recently received considerable attention in the academic literature [2]. The oper-ational aspects of multi-carrier systems have been extensively investigated, as in [3], [4] and [5].
Interestingly, few studies have focussed on long-term cen-tralised integrated system planning problems in which power production, conversion and storage technologies are selected and sized simultaneously, specifically considering power-to-gas, renewable energy sources and storage in gas form. This theme is particularly relevant as energy systems are expected to undergo significant structural transformations, and it is thus paramount to identify technically and economically optimal configurations satisfying pre-specified policy objectives.
In [6], a general framework is proposed to tackle integrated energy hub operation and layout problems including storage elements. Though suitable for power generation, conversion and storage technology selection, the method fails to identify the optimal sizes of selected technologies for given loads and energy prices. In [7], the authors investigate the deployment of batteries, power-to-gas and seasonal storage to complement the power system but no model is presented, which makes results
interpretation and reproducibility difficult. The authors in [8] propose a MILP formulation to size an energy hub comprising CHPs, transformers and heat exchanger technologies, along with heat and gas storage. The investment horizon is shrunk to only 24 hours with hourly resolution, which disregards the possibility of seasonal storage altogether and raises questions about the robustness of the design. The sizing of a local stand-alone energy system including renewable and conventional dispatchable generation units, an electrolyser, accumulators and hydrogen storage tanks is addressed in [9]. A rule-based controller is used to simulate system operation for a set of uncertain technical, operational and design parameters, and a meta-heuristic is then invoked to identify the optimal design. The algorithm offers no practical optimality guarantees, and even if the global optimum was reached, the resulting design would be optimal only with respect to a rule-based operational strategy, which is not economically and technically-optimal. A microgrid featuring solar PV generation along with both short-term and long-term storage in the form of batteries and hydrogen tanks is considered in [10]. Optimal technology sizes are identified via a multi-year LP formulation, but no dispatchable technologies or methanation are considered. Finally, an explicit treatment of the long-term storage problem is made in [11], where a methodology is introduced to reduce the computational burden of planning problems including such technologies, handled via a MILP formulation. A yearly opti-misation horizon is considered, which limits design robustness with respect to yearly weather variations.
III. PROBLEMFORMULATION
The planning model, formulated over an optimisation hori-zon T = {t 2 N : t T } with time step t, comprises four energy carriers, namely electricity, hydrogen, methane and natural gas (the latter two assumed to have identical calorific values but different specific emissions), along with a set of technologies producing, converting or storing those carriers. Engineering constraints describe the sizing and operation of those technologies, whereas the physics of carrier networks is reduced to energy balance laws and line capacity constraints. Furthermore, policy constraints are included, namely yearly CO2 and electricity import quotas. The costs of investing in and/or operating a given technology are accounted for in the objective function, which is minimised. Weather and load data as well as technical and economic parameters are required to instantiate and solve the resulting MILP model, yielding the cost-optimal sizes of selected technologies. In what follows, calligraphic symbols denote sets, capital latin letters denote optimisation variables (except in sub/superscripts and as set elements), whereas greek letters denote parameters.
A. Sources & Sinks
1) Noncontrollable Renewable Technologies: A set of non-controllable renewable technologies R is considered, whose capacity is constrained via
Kr r
max, 8r 2 R, (1)
with Kr
2 R 0 the capacity to be built and rmax the maximum capacity that can be built, which implies a physical bound on the amount of renewable resource that technology r can harness. The power production is expressed as
Ptr= ⇡tr ⇣ r0+ Kr ⌘ , 8t 2 T , 8r 2 R, (2) where Pr
t 2 R 0and ⇡trare the instantaneous production and the normalised production at time t, respectively, whilst r 0 stands for the amount of pre-installed capacity. The same con-vention regarding the meaning of symbols P (active power), K (sized capacity), max (maximum installable capacity) and 0 (pre-existing capacity) for all technologies produc-ing/converting power is taken in the sequel. The investment and operating costs write as
Cr=⇣⇣r+ ✓rf ⌘ Kr+X t2T ✓rvPtr t, 8r 2 R, (3) where ⇣r, ✓r
f and ✓rv denote the capital expenditure (CAPEX), the fixed operation and maintenance (FOM) and the variable operation and maintenance (VOM) costs. FOM costs represent the capacity-based part of operational costs, whereas VOM costs represent the fraction of operational costs dependent upon the amount of power produced, excluding fuel and CO2 emissions levies.
2) Dispatchable Technologies: Let D be the set of all dis-patchable technologies, the output carrier of which is assumed to be electricity. For the sake of compactness, a series of non-mutually exclusive subsets of D will be introduced throughout this subsection, each associated with a set of constraints de-scribing specific characteristics of dispatchable technologies at hand, e.g. limits on ramp rates. Each dispatchable technology model is thus formed by combining several such equations so that each d 2 D can belong to several subsets simultaneously. Constraints common to all dispatchable technologies write as
Ptd d0+ Kd dmax, 8t 2 T , 8d 2 D. (4) Some dispatchable technologies d 2 DR✓ D have additional technical characteristics, such as limits on the rates at which power production can be ramped up or down, expressed via
Ptd Pt 1d d+ d0+ Kd , (5) as well as
Ptd Pt 1d d d0+ Kd , (6)
which describe incremental and decremental ramping con-straints, respectively, and hold 8t 2 T \{0}, 8d 2 DR.
d
+, d stand for incremental and decremental ramp rates. Other technologies d 2 DM
✓ D, must also operate above a minimum output power level at all times. Their power is therefore subject to
µd d0+ Kd Ptd, 8t 2 T , 8d 2 DM, (7) with µd the minimum power output level, expressed as a percentage of the capacity. Furthermore, some dispatchable technologies d 2 DC
systems, and additional constraints modelling the conversion process must be introduced. Such equations are presented in the next subsection. Besides the standard cost structure introduced in Eq. (3), dispatchable technologies d 2 DF
✓ D burning exogenous fuels incur additional costs
Cf ueld = X t2T
✓df uelPtd t/⌘d, (8) with ✓d
f uel the cost of the fuel on which d relies, and ⌘d its efficiency. Likewise, dispatchable technologies d 2 DCO2 ✓
D whose operation emits CO2 are penalised through Cd CO2 = X t2T ✓CO2⌫ d f uelPtd t, (9) with ✓CO2 the CO2 price, ⌫
d
f uel the specific emissions of technology d for a given fuel. For those technologies burning exogenous fuels, an efficiency term must be included at the denominator on the right-hand side of Eq. (9).
3) Curtailment: The aggregate curtailed electrical power PC t is constrained by PtC X r2R Ptr, 8t 2 T . (10)
Curtailment is not penalised in the objective function, as curtailed production has already been paid for either through investment or operational expenses.
4) Electricity Imports & Exports: A bi-directional inter-connection is considered, with a capacity IE
max capping the absolute value of the exchanged power PIE
t 2 R,
IEmax PtIE IEmax, 8t 2 T . (11) Furthermore, the latter can be decomposed into
PtIE = PtI PtE, 8t 2 T , (12) where PI
t 2 R 0and PtE2 R 0denote the imported and ex-ported powers, respectively. This decomposition is warranted as energy imports appear on their own in policy constraints presented later on. The energy exchange gives rise to money flows integrated in
CIE=X t2T
✓IEt PtIE t, (13)
where ✓IE
t stands for the value at time t of a time series of wholesale electricity prices. It is worth noting that imports correspond to costs whilst exports bring in revenue.
5) Unserved Electricity Demand: It may happen that the total available generation fails to supply the electricity demand. For the optimisation problem to remain feasible in such cases, a (slack) variable LEN S
t modelling the lost load is introduced and capped by the load E
t at all times,
LEN St Et , 8t 2 T . (14) Energy not served is penalised through
CEN S=X t2T
&EN SLEN St t, (15) with &EN S the value of lost load.
B. Coupling Technologies
Let C be the set of all coupling technologies, and E that of all energy carriers. Only technologies simultaneously coupling two energy carriers are envisaged. More formally, let us define mappings M : E ⇥ E ! E and W : E ⇥ E ! E associating to each ordered pair of energy carriers their first and second elements, respectively, e.g. for i = (e1, e2)2 E ⇥ E, M(i) = e1 and W(i) = e2. Then, let IC be the set of ordered pairs of energy carriers for which a coupling technology c 2 C is assumed to exist such that there is a bijection B : C ! IC, i.e. a single technology is available to couple a given pair of carriers. Further denoting by ¯m = M B and ¯¯m = W B the compositions of the aforementioned mappings, the scalar relationships describing the conversion processes can be stated as Ptm(c)¯¯ = ⌘cP ¯ m(c) t , 8t 2 T , 8c 2 C, (16) where Pm(c)¯¯ t and P ¯ m(c)
t stand for the active output and input powers, whilst ⌘crepresents the conversion process efficiency. By convention, when coupling technologies are sized, their output power is taken as the reference variable, so that
Ptm(c)¯¯ Kc cmax, 8t 2 T , 8c 2 C. (17) The costs of investing in and operating any c 2 C have the standard structure described in Eq. (3).
C. Storage Technologies
Let S be the set of all storage technologies. Different storage technologies may store different carriers or have distinct tech-nical characteristics. Hence, as done earlier for dispatchable technologies, a series of non-mutually exclusive subsets of S will be introduced throughout this subsection, each associated with a set of constraints describing particular technical or economic aspects of storage technologies.
Constraints common to all of them write as s ⌃s
0+ Ss Ets ⌃s0+ Ss ⌃smax, (18) which holds 8t 2 T , 8s 2 S, and where Ss
2 R 0
and Es
t 2 R 0 denote the energy capacity and the energy stored. ⌃s
0, ⌃smaxand srepresent the pre-installed, maximum capacities and minimum acceptable storage level, respectively. The storage dynamics are then described by
Es
t = ⌘sEt 1s + ⌘s,CP s,C
t t Pts,D t/⌘s,D, (19) valid 8t 2 T \{0}, 8s 2 S, and where Ps,C
t , P s,D
t stand for the charge and discharge powers, respectively. Parameters ⌘s, ⌘s,C and ⌘s,Ddenote the self-discharge, charge and discharge efficiencies of technology s, respectively.
The bounds on charge and discharge powers for certain storage systems are implicit and arise from the (coupling) tech-nologies the storage facilities are connected to. This implies both that physical channels conveying energy may be distinct and that energy and power capacity are sized independently. By contrast, for some technologies s 2 SR
the capacity of the physical channel used for charge and discharge is assumed proportional to the energy capacity,
Ks= Ss/ s, 8s 2 SR, (20) with sthe duration ratio, indicating the time needed to empty the storage at the rated power. By convention, the installed capacity defines the rated output power, which bounds the discharge power at all times
Pts,D s0+ Ks, 8t 2 T , 8s 2 SR. (21) Additionally, the rated input and output powers may be dif-ferent. This is expressed by
Pts,C ⇢s ⇣
s0+ Ks ⌘
, 8t 2 T , 8s 2 SR, (22) with ⇢sthe ratio of the rated input to rated output powers. For technologies charging and discharging energy via the same channel, as for technologies s 2 SE
✓ S storing electricity, simultaneous charge and discharge must be prevented. This can be achieved through
⌘s,CPs,C
t smaxBst, 8t 2 T , 8s 2 SE, (23) and
Pts,D smax 1 Bts , 8t 2 T , 8s 2 SE, (24) with Bs
t 2 {0, 1} and smax an upper bound on the rated output power. It is also handy to define the net power
Pts= P s,C t + P
s,D
t , 8t 2 T , 8s 2 SE, (25) where the power fed into s is taken as negative by convention. The costs of investing in and operating a storage system are
Cs=⇣⇣s+ ✓fs ⌘
Ss, 8s 2 S\{B}, (26)
which includes CAPEX and FOM, and B 2 S refers to batteries. For this technology, the cost function writes as
CB = ⇣BSB+ ✓BfKB, (27) as FOM expenditures are generally related to the discharge power capacity of the system, and not its energy capacity [12]. D. Carrier Network Physics
The physics of the electricity carrier is reduced to a nodal balance equation, X r2R Ptr+ X d2D\DC Ptd+ PtIE+ LEN St + X s2SE Pts+ X c2CE Ptm(c)¯¯ X c2CE Ptm(c)¯ PtC= Et, (28) which holds 8t 2 T and where CE=
{c 2 C| ¯¯m(c) = E} and CE = {c 2 C| ¯m(c) = E} with E 2 E denoting electricity. These sets comprise coupling technologies producing and con-suming electricity, respectively. For the natural gas system, the only constraint considered models the system-wide linepack cap N G t + X c2CN G Ptc N GN etmax (29)
which holds 8t 2 T , where CN Gis defined analogously to its electricity counterpart, N G
t is the natural gas demand besides power plants and N GN et
max is the linepack cap. Put simply, Eq. (29) ensures that the total gas demand never exceeds the maximum amount of energy that can be stored in the pipes. No network is considered for other carriers.
E. Policy Drivers
Two types of policy constraints are modelled, namely elec-tricity import and CO2 emissions quotas. The former can be
expressed as X t2T PI t µI X t2T E t (30)
with µI the ratio of imports to total consumption. The CO 2 emissions quota constraint can be written as
X t2T X c2CCO2 ⌫cPtm(c)¯ + X d2DCO2\CCO2 ⌫dPtd/⌘d t COmax2 (31) with CCO2 = {c 2 C| ¯¯m(c) = E, ¯m(c) = N G_ ¯m(c) =
CH4}, and COmax2 the yearly CO2 quota. The second term on the left-hand side represents emissions from (non-coupling) dispatchable technologies whose thermal side is not modelled, hence the efficiency at the denominator, as specific emissions are given per unit of fuel energy, not electrical output. F. Planning Model
The optimisation variables are active powers for each tech-nology and carrier, and the capacities of all technologies sized. The objective function, to be minimised, is formed by summing costs in Eqs. (3), (8), (9), (13), (15), (26) and (27). All other equations are used to describe the operation, sizing of the system, and policy drivers. As a reminder, an optimisation horizon of five years with investment costs reduced to five-year equivalents is used to approximate the full planning horizon of twenty years and reduce the computational burden. The resulting model, available at [13], is implemented in Pyomo (Python) and solved with Gurobi in about 10 minutes on a laptop with i7 processor and 16GB of RAM.
IV. CASESTUDY
A. Description
The case study aims at identifying the optimal energy mix and the resulting short and long-term storage requirements under CO2 emissions and energy security constraints. In this context, energy security signifies little reliance on electric-ity imports for adequacy, and implies a pre-specified yearly imports budget. This approach is interesting as it indicates what technologies (and in what quantities) to deploy in order to reach pre-specified decarbonisation and energy security targets, under a set of technical, economic and RES resource quality and availability assumptions. Two scenarios are con-sidered. In the first scenario, the energy system configuration
matching 2018 emissions levels without any nuclear power (which approximately amount to a 40% cut from 1990 levels and is in line with 2030 European climate policy objectives) and only 10% of imports (down from the current 30%) is identified. In the second scenario, the configuration satisfying identical energy security requirements and a 80% reduction in emissions from 1990 levels is sought.
Time steps of one hour are used over the five year optimisa-tion horizon. The electrical and gas networks are collapsed into a single node each, with their loads aggregated. The topology, set of technologies available and their interactions are shown in Figure 1.
Fig. 1. Configuration of the multi-carrier system considered in the case study. Dispatchable generation includes H2 fuel cells, gas-fired turbines (CCGT
using natural gas and CH4interchangeably, the latter with specific emissions
of 10% of the former) and other aggregated dispatchable units (biomass, CHP and waste). VRE encompasses on/offshore wind turbines and solar PV panels. PtG and H2tCH4represent electrolysers and methanators, respectively, whilst
H2and CH4stand for hydrogen and methane storage facilities.
B. Data
Input data includes normalised RES production, electricity and non-power gas load, as well as wholesale electricity prices time series, all at hourly resolution. All time series were obtained for years from 2014 to 2017 from sources detailed in [13] and juxtaposed (with 2014 repeated at the end). The demand has been scaled to have a 14GW peak load, resulting in a total consumption of about 89.7 TWh/yr.
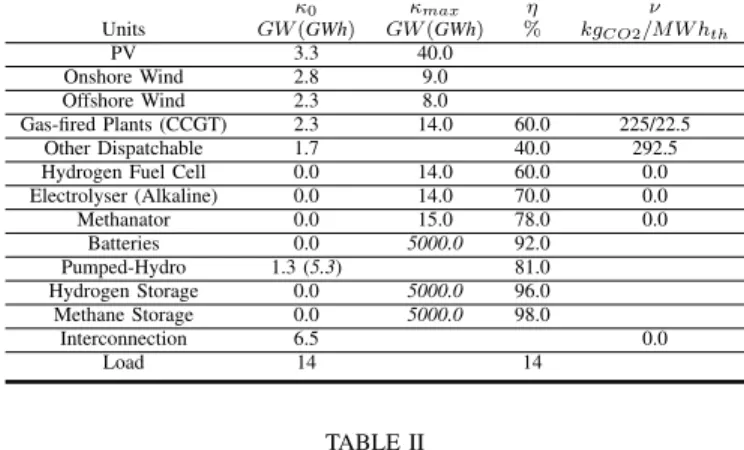
Key technical and economic parameters are shown in Tables I and II. Pre-existing capacities reflect the 2025 Belgian power system, and no technology replacement is assumed to take place. Bounds on RES capacity represent maximum RES potential, whilst bounds on storage capacities are set arbitrarily high to allow for physically-unconstrained cost-optimal selection and sizing. Equivalent CAPEX costs were obtained by multiplying full CAPEX costs by the ratio of optimisation horizon length to lifetime for each technology. The net specific emissions for synthetic CH4 burned in gas turbines are taken as 10% of those of natural gas, i.e. 22.5 kg/MWhth, as the methanation process consumes CO2. Fuel cost for natural gas is taken as 30e/MWh and 10e/MWh for other (aggregated) dispatchable. The value of lost load and costs of CO2 emissions are set to 3000e/MWh and 70e/t, respectively. 2018 Belgian CO2 emissions levels for
TABLE I TECHNICALPARAMETERS 0 max ⌘ ⌫ Units GW (GWh) GW (GWh) % kgCO2/M W hth PV 3.3 40.0 Onshore Wind 2.8 9.0 Offshore Wind 2.3 8.0 Gas-fired Plants (CCGT) 2.3 14.0 60.0 225/22.5 Other Dispatchable 1.7 40.0 292.5 Hydrogen Fuel Cell 0.0 14.0 60.0 0.0 Electrolyser (Alkaline) 0.0 14.0 70.0 0.0 Methanator 0.0 15.0 78.0 0.0 Batteries 0.0 5000.0 92.0 Pumped-Hydro 1.3 (5.3) 81.0 Hydrogen Storage 0.0 5000.0 96.0 Methane Storage 0.0 5000.0 98.0 Interconnection 6.5 0.0 Load 14 14 TABLE II ECONOMICPARAMETERS
CAPEX FOM VOM Lifetime Units M e/GW (h) M e/GW· yr e/GW h yr
PV 800 20 0.0 20
Onshore Wind 1000 29 0.0 25
Offshore Wind 2200 77 0.0 20
Gas-fired Plants (CCGT) 850 21 0.003 30
Other Dispatchable 40 0.0035 30
Hydrogen Fuel Cell 750 30 0.005 7.5 Electrolyser (Alkaline) 800 20 0.0 20 Methanator 250 15 0.0 20 Batteries 200 20 0.0 10 Pumped-Hydro 45 0.0 55 Hydrogen Storage 5 0.25 0.0 50 Methane Storage 0.1 0.025 0.0 80 TABLE III CASESTUDYRESULTS
Case 1 Case 2 Capacity Cap. Factor Capacity Cap. Factor Units GW (GWh) % GW (GWh) % PV 17.6 11.4 31.4 11.4 Onshore Wind 9 19.0 9.0 19.0 Offshore Wind 8 38.0 8.0 38.0 Gas-fired Plants 6.3 40.0 5.0 31.1 Other Disp. 1.7 73.0 1.7 60.0 H2Fuel Cells 0.0 0.0 0.54 36.0 Electrolysers 0.0 0.0 1.8 27.2 Methanators 0.0 0.0 0.06 26.0 Batteries 0.0 0.0 5.4 (10.7) 38 H2Storage 0.0 0.0 93.9 51.1 CH4Storage 0.0 0.0 10.3 42.2 Interconnection 6.5 17 6.5 17
power generation are estimated at 19Mt/yr and a 80% cut from 1990 levels yields a budget of 6.3Mt/yr. Self-discharge efficiencies are set to 1 and 0.999 for gas storages and batteries, respectively. All parameters are referenced in [13]. C. Results
Results are displayed in Table III. The first case reveals that about 35GW of RES capacity along with 6.3GW of gas-fired and 1.7GW of other dispatchable (pre-existing) capacity are needed to supply the load at all times, as no unserved demand is recorded. The total yearly system cost is 4.62Be, resulting in an average electricity cost of approximately 51.5e/MWh.
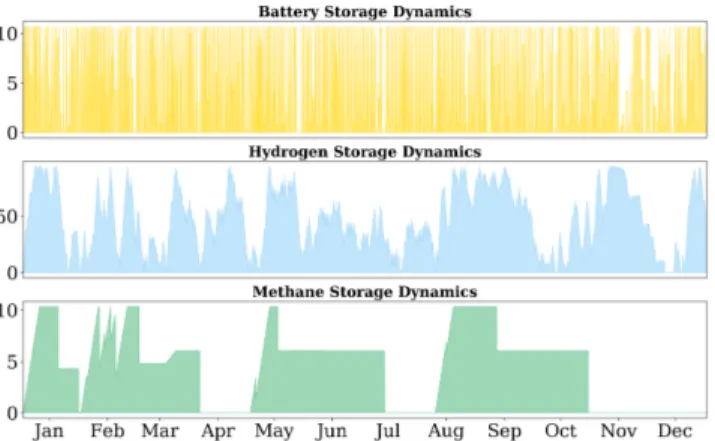
Fig. 2. Typical battery, H2and CH4storage dynamics. Batteries display very
short term periodic behaviour, typically a day, whereas hydrogen is used for short to medium-term storage. Methane storage dynamics seem event-driven, probably by renewable production peaks, and can be discharged very fast in the gas network.
In this set-up, no storage is needed thanks to the ramping capacity of gas-fired power plants, assumed to be able to ramp-up (resp. down) to (resp. from) full capacity (resp. minimum) capacity within an hour. Only 0.5% percent of RES production is curtailed, whilst 8.6% of it is exported, i.e. a yearly average of 0.4 and 6.6TWh, respectively. The interconnection capacity factor has a value of 17%, corresponding to 10% of the yearly energy consumption.
The second case yields starkly different results. Indeed, to achieve the desired emissions reduction targets, RES capacity nearing 49GW is required. The gas-fired capacity drops to 5GW, with a 9% decrease in capacity factor. The use of other polluting dispatchable units is substantially reduced. The total system cost is 5.07Be, which translates into an average electricity cost of 56.52e/MWh, with no unserved demand. Furthermore, all storage technologies are built. The much-increased RES capacity and limits on storage input capacities give rise to increased exports and curtailment amounting to 1.5% and 9.9% of RES production, i.e. 1.2 and 7.6TWh, respectively. H2storage is preferentially built, owing to its rel-atively low cost and high efficiency. Batteries are built in much smaller proportions, mostly for very short-term storage, along with pumped-hydro. Finally, CH4storage facilities are built to store and re-power low-CO2 synthetic methane. Typical state of charge (SOC, in GWh) dynamics of batteries, H2and CH4 storage systems are shown in Figure 2. Typical H2 storage cycling occurs a handful of times a month, whilst the CH4 storage dynamics seem event-driven rather than displaying an obvious seasonal pattern.
The cost of the energy system satisfying ambitious CO2 reduction targets is 9.7% higher, despite strong technology costs reduction and performance improvement assumptions, and the absence of lost load. It is also worth mentioning that the interconnection serves as a slack, despite hard constraints on the instantaneous and yearly amounts of exchanged power. Thus, some power can always be imported in times of scarcity on the Belgian territory, which implies regional adequacy and may not always be true in practice. Storage needs may
therefore be underestimated as a result of this approximation. V. CONCLUSION& FUTUREWORK
A MILP formulation is proposed to tackle long-term cen-tralised planning problems of integrated energy systems in-cluding RES, conventional dispatchable, power-to-gas, short and long-term storage technologies under policy constraints. The model uses an equivalent five-year planning horizon, hourly resolution and high techno-economic operational detail. A case study explores possible configurations of the Belgian power system beyond 2025, and identified both the cost-optimal energy mix and (short and long-term) storage require-ments under energy security and CO2 emissions reduction constraints. Results highlight the need for power-to-gas, gas storage facilities as well as batteries to achieve ambitious climate and energy security goals.
In the future, performing sensitivity analyses on costs, CO2 emissions and imports quotas constraints would bring valuable insight for the identification of robust optimal system design. The addition of other markets for power-to-gas products as well as other energy carriers, e.g. heat, can be investigated to provide a more complete picture of multi-carrier opportunities.
REFERENCES
[1] K. Poncelet, E. Delarue, D. Six, J. Duerinck, and W. D’haeseleer, “Impact of the level of temporal and operational detail in energy-system planning models,” Applied Energy, vol. 162, pp. 631 – 643, 2016. [2] P. Mancarella, “Mes (multi-energy systems): An overview of concepts
and evaluation models,” Energy, vol. 65, pp. 1 – 17, 2014.
[3] M. Qadrdan, M. Abeysekera, M. Chaudry, J. Wu, and N. Jenkins, “Role of power-to-gas in an integrated gas and electricity system in great britain,” International Journal of Hydrogen Energy, vol. 40, no. 17, pp. 5763 – 5775, 2015.
[4] S. Clegg and P. Mancarella, “Integrated modeling and assessment of the operational impact of power-to-gas (p2g) on electrical and gas transmission networks,” IEEE Transactions on Sustainable Energy, vol. 6, no. 4, pp. 1234–1244, Oct 2015.
[5] A. Zlotnik, L. Roald, S. Backhaus, M. Chertkov, and G. Andersson, “Coordinated scheduling for interdependent electric power and natural gas infrastructures,” IEEE Transactions on Power Systems, vol. 32, no. 1, pp. 600–610, Jan 2017.
[6] M. Geidl and G. Andersson, “Optimal coupling of energy infrastruc-tures,” in 2007 IEEE Lausanne Power Tech, July 2007, pp. 1398–1403. [7] A. Belderbos, E. Delarue, and W. D’haeseleer, “Possible role of power-to-gas in future energy systems,” in 2015 12th International Conference on the European Energy Market (EEM), May 2015, pp. 1–5. [8] A. Shahmohammadi, M. M. Dalvand, M. S. Ghazizadeh, and A.
Salem-nia, “Energy hubs’ structural and operational linear optimization with energy storage elements,” in 2011 2nd International Conference on Electric Power and Energy Conversion Systems (EPECS), Nov 2011, pp. 1–6.
[9] G. Giannakoudis, A. I. Papadopoulos, P. Seferlis, and S. Voutetakis, “Optimum design and operation under uncertainty of power systems using renewable energy sources and hydrogen storage,” International Journal of Hydrogen Energy, vol. 35, no. 3, pp. 872 – 891, 2010. [10] V. François-Lavet, Q. Gemine, D. Ernst, and R. Fonteneau, “Towards
the minimization of the levelized energy costs of microgrids using both long-term and short-term storage devices,” in Smart Grid: Networking, Data Management, and Business Models, 295-319. CRC Press, 2016. [11] P. Gabrielli, M. Gazzani, E. Martelli, and M. Mazzotti, “Optimal design of multi-energy systems with seasonal storage,” Applied Energy, vol. 219, pp. 408 – 424, 2018.
[12] N. DiOrio, A. Dobos, and S. Janzou, “Economic analysis case studies of battery energy storage with sam.” [Online]. Available: https://www.nrel.gov/docs/fy16osti/64987.pdf
[13] M. Berger, “Optimal multi-carrier system planning repository.” [Online]. Available: https://github.com/MathiasPBerger/MultiCarrierPlanning