Tectonic vs. shallow origin of geodetically inferred ground
movements: an NE Ardenne (Belgium) case
Alain Demoulin
a;*, Bernard Vliegen
b, Robert Charlier
ba Research Associate NFSR, Departement of Physical Geography and Quaternary, Universite¨ Lie©ge, Sart Tilman,
Baªt. B11, 4000 Lie©ge, Belgium
b Departement MSM, Universite¨ Lie©ge, quai Banning, 6, Baªt. C2, 4000 Lie©ge, Belgium
Received 3 February 2000; received in revised form 10 June 2000; accepted 19 June 2000
Abstract
In order to get a better insight into the temporal pattern of height change variations in a moderately seismic intraplate area, a 1 km long section has been weekly leveled from April, 21, 1997 to January, 12, 1998 in NE Ardenne (Belgium). As this section is located very close to a small reservoir of 25U106 m3, it also allowed the influence of lake level
variations on the nearby ground motion to be studied. The measured height difference variations show a maximum amplitude of 3.45 mm, with weekly values not exceeding 1 mm. A two-dimensional (2D) finite element modeling confirms that waterload variations in the lake are the primary cause of movement of the section, inducing maximum ground subsidence of about 2 cm and seasonal tilting of 3^4 Wrads within a range of 2^3 km. We also show that a fault passively alters the spatial distribution of the waterload-dependent movements. The removal of this component from the observed ground motion leaves oscillating residual displacements characterized by an amplitude of 1^1.5 mm and a `period' of about 2 months. We demonstrate that these displacements are independent of rainfall and probably of groundwater fluctuation too. Although most of the residual motions take place on the fault straddled by the leveling section, no credible mechanism can be found to ascribe these motions to a tectonic process. ß 2000 Elsevier Science B.V. All rights reserved.
Keywords: Holocene; crustal; movement; leveling; loading; Western Europe
1. Introduction
It is widely accepted that geodetically inferred rates of vertical crustal motion in intraplate set-tings are mostly inconsistent with geological rates. Indeed, they are generally one order of magnitude higher than the latter [1] and moreover show in
some cases sense reversals which hitherto remain poorly explained (e.g. [2^6]). Many authors have thus interpreted these present-day ground move-ments as a noise of atmospheric or hydrological origin [7], also partly related to the instability of the geodetic monuments [8] and interfering with possible tectonic displacements. Although most ground tilting studies record very local deforma-tion, they also con¢rm the prominent in£uence of the hydrological factor especially on short-term motions [9^12]. However, this opinion rather complicates the understanding of the local
move-* Corresponding author. Tel.: +32-4-366 5660; Fax: +32-4-366 5722; E-mail: [email protected]
ments inferred from leveling comparison since it implies that only the highest of them would be tectonically signi¢cant, therefore increasing the discrepancy between long-term and short-term rate estimates. It seems highly improbable that in so many intraplate areas with limited Quater-nary uplift rates, geodetic data only record `par-oxystic' tectonic movements which, in spite of their rapidity, appear unrelated to seismic activity. Furthermore, most geodetically inferred motions are tied to existing geological structures and do not show any clear relation with near-surface phe-nomena. Following a recent paper by Demoulin and Collignon [6] who dealt with yearly high pre-cision levelings spanning a 5-yr period in NE Ard-enne, we thus discuss here the respective in£uence of near-surface factors and deeper-seated causes on weekly measurements of vertical ground move-ments along a 1 km long section in the same area. The Ardenne is a Paleozoic massif whose recent tectonic activity is weak to moderate. This activity principally appears in the NE part of the massif where it is manifested by a strong regional uplift (amounting to about 500 m since the Oligocene, from which 150 m during the Quaternary) and superimposed fault displacements. The latter take place on NNW-striking normal faults (often showing an additional strike-slip component) par-allel to the major bounding faults of the nearby Rur graben. Indeed, the subsidence of the Rur graben, which belongs to the northern segment of the W-European Cenozoic rift, determines up-lift mode and timing in NE Ardenne since the upper Oligocene.
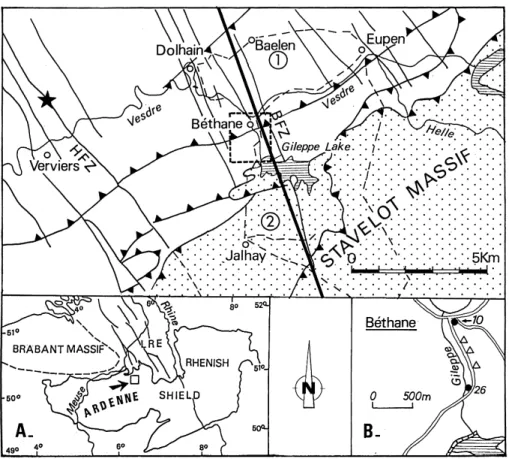
Comparison of the high precision levelings car-ried out by the Belgian IGN (Institut Ge¨ographi-que National) in 1946^48 and 1972^80 demon-strates signi¢cant vertical motion located on several of the NNW-striking faults of NE Ard-enne [13]. Moreover, instrumental and historical seismicities (e.g. the 1692 Verviers earthquake whose moment magnitude is estimated between 6.3 and 6.5, Camelbeeck, oral communication) characterize at least one of these faults. This is the reason why a local leveling network comprised of two loops and totaling 48 km was set up in the Gileppe Lake area where it runs in several places across one of the main active fault zones (Fig. 1).
Yearly reiterated surveys of this network revealed very high height change variations from one year to the other in the 1993^1998 time interval [6]. Tilt values of 0.9^1.2 Wrad/yr have been recorded for 10 km long segments of the leveling route. Smaller segments (4^5 km in length and contain-ing 6^7 regularly spaced benchmarks) even showed yearly tilting between 1.2^2.0 Wrad. Dis-crete motion was also observed at least for two NNW-striking faults. These fault displacements amount to 3^16 mm between two successive sur-veys but the cumulative movement remains lim-ited due to frequent sense reversals.
The absence of signi¢cant systematic errors in the levelings, the nature of the local geology and especially of the surface deposits, the good quality of the geodetic monuments and the distribution of the recorded motions all converge on ruling out a shallow cause for most displacements and thus strongly suggest a tectonic origin [6]. However, several important questions are not yet solved re-garding their temporal pattern. Firstly, the sense reversals which frequently characterize the mo-tion, with an apparent periodicity of 2^3 yr, de-serve more detailed investigation. Indeed, they are probably the main cause of the general inconsis-tency between geodetic and geologic movement rates in intraplate settings [1]. Secondly, if we wish to understand the true nature of the ob-served phenomenon, even a yearly frequency of survey repeating does not provide su¤cient in-sight into the rate of displacement. Since we ob-serve sense reversals within a few years, the move-ment is clearly not uniform at this timescale. However, we have no idea of its evolution be-tween two surveys. Is it uniform through the year? Does it result from numerous uninterrupted up-and-down displacements (which themselves could be periodic ^ daily, seasonal ^ or random) or is it caused by short episodic motions brie£y perturbing an otherwise still structure?
In order to answer this last question, we have carried out weekly levelings of a section of the Gileppe Lake network. 37 measurements have been performed from April 21, 1997 to January 12, 1998. The measured section, limited by bench-marks 10 and 26, is located at Be¨thane in the downstream part of the small Gileppe valley
(Fig. 1). This choice was dictated by a double purpose. On one hand, it was one of the sections which had regularly shown signi¢cant yearly ver-tical displacements in the 1993^1998 time interval [6]. On the other hand, it lies in a radial position at about 1 km to the north of the Gileppe reser-voir and thus provides an opportunity for esti-mating the in£uence of load variations in the lake on ground movements.
2. Database
The Be¨thane section is 923 m long with a height di¡erence of 10.74 m between both benchmarks,
corresponding to a slope of 11.6x. Beyond the endmarks, which the Belgian IGN set up in well-founded brick buildings more than 50 yr ago [14], it was equipped with three new benchmarks an-chored in the Paleozoic bedrock at regular distan-ces and additional topographic nails put in the asphalt road every 50 m, so that the sight length never exceeded 25 m. The measurements were per-formed using a LEICA NA-3000 numerical level and 3 m long code-bar invar rods. The sections have been double run with a ¢eld tolerance L = 1 mm/kkm. During each releveling, the same rod was put on the same nails. At the end of the back run, the fore and back readings were com-pared for every internail distance, a discrepancy in
Fig. 1. Location map. Top: The Gileppe leveling network is in dashed line. The Be¨thane section is located at the western inter-section of both leveling loops (marked by encircled numbers). The modeled cross-inter-section is denoted by a bold line. Solid lines are for normal and thrust (with solid triangles) faults in the Paleozoic basement. HFZ, Hockai fault zone. BFZ, Baelen fault zone. The star indicates the approximate location of the historical Verviers, 1692 earthquake (Mws 6). Inset A: LRE, lower
Rhine Embayment. Inset B: Black circles numbered 10 and 26 correspond to the endmarks of the Be¨thane section. Open trian-gles are for intermediate benchmarks anchored in the Paleozoic rocks.
excess of 0.2 mm compelling the remeasurement of the concerned internail distance. Air temper-ature readings were taken every 30 min.
2.1. Leveling errors
Owing to this careful procedure, the standard error of the whole data set is only 0.19 mm/kkm. However, systematic errors can contaminate the levelings, and an error analysis is thus necessary. The most signi¢cant systematic errors are gen-erally height-dependent, closure-independent er-rors related to rod miscalibration and unequal atmospheric refraction e¡ects [15,16]. The un-equal refraction error arises from the vertical strati¢cation of the air mass traversed by the sight line when leveling along inclined ground. How-ever, the Be¨thane section is almost horizontal. Moreover, we always kept the sight length (which is the most in£uential factor) under 25 m and never sighted to the bottom 50 cm of the rods (92% of the readings are made between 0.9 and 2.1 m). With regard to rod miscalibration prob-lems, we always used the same rods on the same nails and the level station points were also the same for each successive survey. These precau-tions are thought to have rendered di¡erential refraction and rod miscalibration errors negli-gible.
Although regularly reassessed level collimation error is automatically taken into account by the NA-3000 level, we observed equal foresight and backsight lengths (to þ 0.1 m), which also cancels this error. The thermal error, due to thermal ex-pansion of the invar tapes (coe¤cient of linear expansion V = 0.8 ppm/³C), was also corrected. The error linked to earth tides and their derived gravitational e¡ects was not computed. Combin-ing the e¡ect of the tidal variations of gravity on an assumed rigid Earth with the response of the real deformable Earth to tidal stresses, the max-imum possible range of lunisolar tidal in£uence on leveled height di¡erences is V0.08 mm/km [17]. Finally, a possible instrument-related error linked to di¡erences in rod illumination may also be ruled out. Indeed, for several relevelings carried out during sunny days, no signi¢cant mis-closure value arose from the fact that the fore run
was performed in the morning shadow and the back run under bright sun.
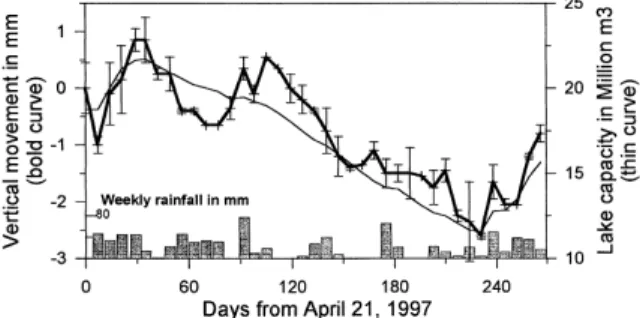
Therefore, in summary, not only could any sys-tematic error be detected but also the exact repro-duction of the working conditions from one week to the other makes the di¡erential in£uence of a possible undetected systematic error tend to zero. The curve in bold of Fig. 2 shows the time de-pendence of the vertical position of benchmark 10 ^ the endmark to the north of the section, i.e. the most distant from the lake ^ with respect to that of benchmark 26 at the other end. The measured height di¡erence variations between benchmarks 10 and 26 show a maximum amplitude of 3.45 mm. Weekly values do not exceed 1 mm. How-ever, most of them are not only higher than the standard error but they also combine within ob-vious trends extending over a few months and no signi¢cant tilt excursion is found. The tempera-ture-corrected values do not exhibit any direct relationship between ground movement and rain-fall. Unfortunately, no groundwater data were available but the similar geomorphic setting of both benchmarks at barely 1 km from each other makes it improbable that di¡erential variations in groundwater level be large enough to cause a tilt-ing of the ground surface [9]. Moreover, the ver-tical motion of the `intrasection' benchmarks an-chored in the outcropping Paleozoic basement perfectly ¢ts that of the endmarks 10 and 26, therefore evidencing that possible groundwater £uctuation within the alluvial deposits on which
Fig. 2. Di¡erential vertical movement recorded by weekly measurements of the Be¨thane section from April 21, 1997 to January 12, 1998 and its relation to rainfall and level varia-tions of the Gileppe Lake. Vertical bars give the weekly val-ues of section misclosure.
the endmark-bearing buildings rest does not in£u-ence the latter's stability. On the contrary, the temporal pattern of tilt variations of the Be¨thane section displays a striking parallelism with the curve of waterload variations within the Gileppe Lake, this small reservoir of 25U106 m3 maxi-mum capacity.
3. 2D ¢nite element modeling of the e¡ect of waterload variations on ground movement In order to determine the area of in£uence of the varying lake level on the vertical movement of the nearby ground surface and to remove this in£uence from the recorded motion, we modeled the e¡ect of such load variations by a 2D ¢nite element analysis of the resulting upper crustal £exure. The modeled cross-section, which includes the leveled Be¨thane section, is centered on the Gileppe Lake and strikes NNW, almost perpen-dicularly to the lake long axis. Along this cross-section, we considered a rectangular elastic do-main 20 km long and 15 km deep, the upper limit of which includes the topography (Fig. 3). The mesh density is high in the upper 3 km of the central part of the domain, with an average inter-node distance of about 100 m at the surface. The side areas of the domain are wider-meshed, more
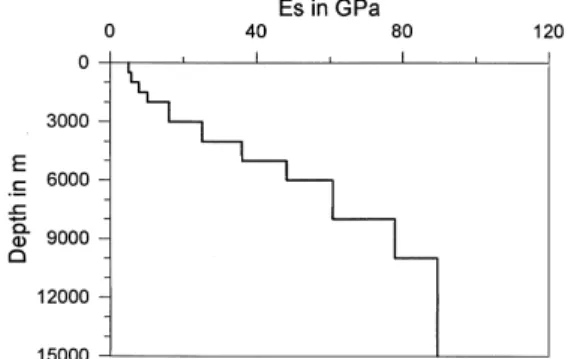
especially as the latter has been de¢ned large enough with respect to the expected size of the deformed zone in order to avoid arti¢cial bound-ary e¡ects. The load was applied as an uniform pressure on a 551 m wide area corresponding to the intercepted lake surface (divided in three seg-ments distributed in the central 1076 m of the cross-section). The plane strain calculations are based on the assumptions of small strains and linear elasticity. No vertical locking was imposed along the lateral boundaries of the domain although its size rules out any signi¢cant bound-ary disturbances. This domain is comprised of stacked horizontal layers whose Young's moduli increase with depth. To obtain a realistic estimate of the vertical pro¢le of elasticity modulus (Fig. 4), we used the 10 km deep vertical seismic pro¢le of shear wave velocity Vscalculated by Jongmans and Camelbeeck [18] for the Stavelot massif (NE Ardenne) from seismograms recording quarry blasts. Using Vs, we can determine the dynamic modulus of elasticity Ed by using the following relationship:
Ed 2bW 1 XWV2s
where we take b, the density of upper crustal rocks, 2700 kg/m3andX, the Poisson's coe¤cient, 0.25.
To convert Ed into Es, the static modulus of elasticity, we use a coe¤cient of reduction Cr tak-ing the `quality' of the massif (mainly related to its degree of fracturation) into account. In the absence of ¢eld determination of this quality
fac-Fig. 4. Vertical pro¢le of static modulus of elasticity com-puted from shear wave velocity data.
Fig. 3. Schematic diagram of the node distribution in the modeled section. The arrowing solid rectangles above the to-pography locate the areas where the pressure is applied.
tor, we estimated it by means of an empirical relationship linking the coe¤cient of reduction to the wavelength of the shear waves [19]. We thus obtained a value of 0.16 for Cr in the frac-tured bedrock near the surface. This value was taken for the upper 3 km of the model, down to the main interface corresponding to the Eifel thrust (i.e. the northern Variscan front in NW Europe). Below the thrust fault, we assumed a
linear increase of Cr with depth, due to the pro-gressive closure of the fractures with increasing con¢ning pressure. Finally, we took Cr= 1 for the bottom 5 km of the domain. Of course, the obtained Es values can only be considered as rough estimates.
We calculated the vertical ground displacement for a pressure of 123.2 kPa, corresponding to the maximum lake level variation of 12.56 m recorded
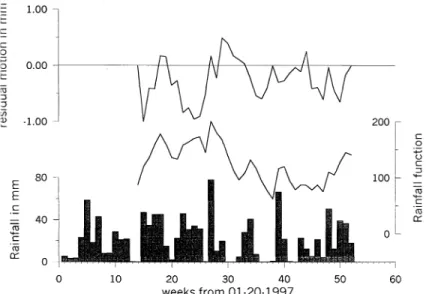
Fig. 6. Upper curve: Residual (observed modeled) motion of the Be¨thane section after removal of the in£uence of waterload var-iations in the Gileppe Lake. Lower curve: Rainfall function calculated for a time constantd = 6 (weeks).
Fig. 5. Modeling of ground subsidence (bold line) and tilting (thin line) in the Gileppe area for an applied pressure of 123.2 kPa centered in X = 10 400 (intersection of the lake long axis with the modeled cross-section). The location of the leveled Be¨thane sec-tion is also shown.
in the 1993^1998 time period (during which the yearly levelings of the Gileppe Lake network were performed). The calculated curve given in Fig. 5 shows a maximum subsidence of 18 mm straight below the lake axis. This value is only a rough estimate of the true amount of subsidence since 3D e¡ects are not accounted for. Namely, the calculated subsidence strongly depends on the ori-entation of the modeled cross-section with respect to the lake, which determines the intercepted lake length where the pressure is applied. Nevertheless, it looks like a realistic ¢gure because the cross-section runs almost at right angle to the axis of this narrow lake, thus reducing the problem to that of bending under a line load. More interest-ingly, the ground lowering rapidly damps down when going away from the reservoir axis. At a distance of 2.5 km, it becomes negligible ( 6 1 mm).
For the Be¨thane section whose endmarks are respectively 0.8 and 1.7 km away from the lake axis, the same pressure of 123.2 kPa causes an average tilt of about 3.5 Wrads toward the lake,
i.e. a di¡erential vertical movement of 3.2 mm between both endmarks. However, the maximum variation of the lake level during the 1997^1998 campaign of weekly levelings did not exceed 10.55 m, corresponding to a pressure of 103.5 kPa. This yields a calculated di¡erential motion of 2.7 mm between benchmarks 10 and 26.
4. Discussion
4.1. The in£uence of waterload variations
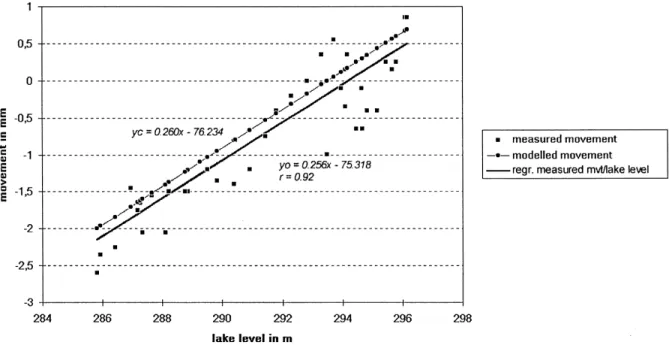
This calculated motion of 2.7 mm is clearly of the same order of magnitude as the measured 3.45 mm. Moreover, except for a few transient excur-sions discussed below, the temporal evolution of measured height change variations of the Be¨thane section closely follows that inferred from model-ing (Fig. 6). The Pearson's coe¤cient of correla-tion between measured tilt at Be¨thane and load variations within the lake is 0.92 for the 1997^ 1998 data set, and the regression equation is
al-Fig. 7. Regression of the observed vertical ground motion on the lake level variations. The equation of the linear regression (yo)
is given in the right part of the diagram with the Pearson's coe¤cient of correlation. The equation of the modeled in£uence of waterload variations (yc) is given in the left part of the diagram.
most identical with the calculated relationship be-tween both parameters (Fig. 7). This undoubtedly con¢rms that in this particular place vertical ground movements are primarily caused by the varying water level in the Gileppe reservoir.
An internal report of EDF France dealing with the elastic deformation of the ground caused by the ¢lling of the Vouglans reservoir (590U106 m3) on the Ain River (SE France) in 1968 yields com-parable results by a di¡erent approach taking into account the total load (Du¡aut, written commu-nication). It suggests a maximum subsidence at the gravity center of the loaded area amounting to 9.3 cm for a meanczof about 750 kPa. Similar results have also been obtained from the compu-tation of the elastic ground response to the M2 (principal lunar semi-diurnal) component of sea tide loading in the Bay of Fundy, where a tide amplitude of about 14 m (V137 kPa) would be responsible for a maximum vertical displacement of 24 mm [17].
The reliability of our calculations is further con¢rmed by the ground movements measured after ¢lling of several very large reservoirs. Lo-cated on the Zambezi River (Zambia-Zimbabwe), the Kariba Lake (150U109 m3) is one of the world's largest arti¢cial reservoirs. Subsidence of up to 13 cm has been measured in the vicinity of the deepest part of the lake (125 m deep, corre-sponding to a local pressure of 1.2 MPa) [20]. High precision levelings carried out from 1935 to 1950 after the Lake Mead (Nevada, AZ, USA) was ¢lled showed a ground depression of about 18 cm near the gravity center of the 200 m deep reservoir [21]. In both these cases, the mea-sured vertical displacement is about 30% smaller than the computed motion (even a little more for the elastic depression in the Lake Mead area, where the above mentioned value of subsidence has been obtained with a 15 yr time lag with re-spect to the lake ¢lling and thus includes a viscous component of the deformation). This slight dis-crepancy is simply due to the location of the lev-eled points, which cannot actually coincide with the drowned places of maximum loading.
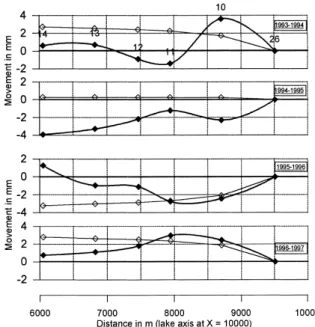
With regard to the area of in£uence, the com-parison, based on yearly leveling data for the 1993^1997 period, of measured and computed
vertical displacements in the network part more distant from the Gileppe Lake unequivocally demonstrates that the e¡ect of such small water-load variations indeed is limited to a 2^3 km wide peripheral area (Fig. 8). For example, the oscilla-tory tilting observed since 1994 between bench-marks 11 and 14 (immediately to the NNW of the Be¨thane section) is completely independent of this in£uence, as well as all other geodetically signi¢cant displacements recorded elsewhere in the Gileppe network [6].
4.2. The passive in£uence of faults
Although the signi¢cance of motion of individ-ual nails inside the section may be questioned, comprehensive information on the evolution of the nail positions in time and space corroborates that given by the behavior of the intermediate bedrock marks to suggest that the section is not uniformly tilted but rather is comprised of two zones of markedly di¡erent movement separated
Fig. 8. Yearly record of vertical ground movements to the north of the Gileppe Lake from 1993 to 1997, showing the spatially limited in£uence of waterload variations within the lake. Bold lines display the measured movements and thin lines the modeled displacements. Benchmark numbers are in-dicated along the upper curve.
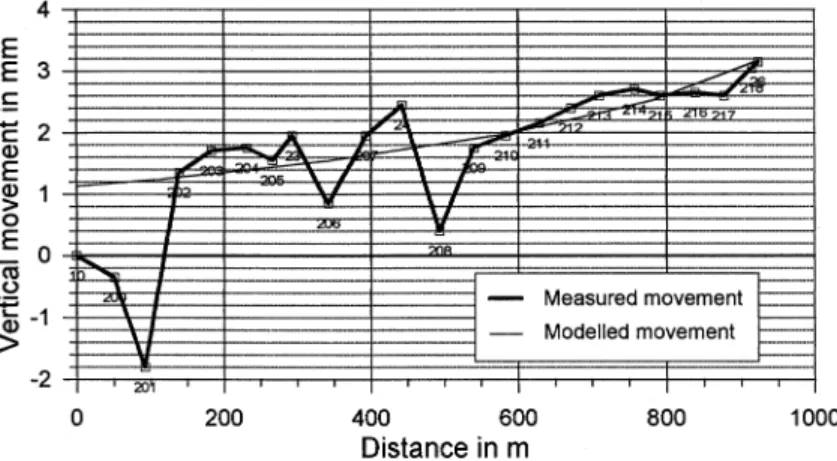
by a sharp cuto¡. Considering for instance the time interval between August, 4 and December 8, 1997 during which no other important displace-ment interferes with the ground response to waterload variations, it appears that the spatial coincidence between measured and calculated nail positions is excellent, except for the three most remote marks of the section (benchmark 10+2 nails) (Fig. 9). This abrupt discontinuity may be interpreted as resulting from the presence of an NNW-striking fault crossing the leveling route between nails 201 and 202. Indeed, recent activity of that Variscan fault following the Gi-leppe valley is evidenced by terrace deformations in the nearby Vesdre Valley [22]. However, the di¡erential motion on both walls of the fault is here determined solely by the ground response to the varying lake level, such passive fault motion only highlighting that the upper part of the fault is not locked.
The presence of this fault (that we shall call the Be¨thane fault) could contribute to explain why the measured maximum amplitude of 3.45 mm of vertical movement for the Be¨thane section ex-ceeds by 25% the calculated value of 2.7 mm. In-deed, the stress transfer is partly hampered by the fault, thus increasing the amount of waterload-dependent motion on the lake side of the fault and diminishing it on the other side. Since the Be¨thane section straddles the fault, the di¡erential movement it records is therefore enhanced.
4.3. The superimposition of possible tectonic motion
As already stated, only few signi¢cant devia-tions from the time response curve of ground mo-tion to waterload are observed along the Be¨thane section. The main one appears in June and July 1997 (Fig. 6, weeks 18^29). It corresponds to a 1.1 mm high transient motion which developed in 5 weeks and was more than recovered (1.5 mm) in a period of similar length immediately after. Spatially, this movement is located between nails 201 and 202, again taking place along the Be¨thane fault. Furthermore, some minor tilt excursions (Fig. 6, week 15) are also linked to sudden small displacements on this fault. Besides these tilt ex-cursions within the Be¨thane section, other sections of the Gileppe network also showed some non-reversible fault displacements (Fig. 8: 2.7 mm be-tween benchmarks 11 and 10 in the 1993^1994 interleveling period).
Despite the particular location of these short-term residual up-and-down movements on fault traces, their possible relation to atmospheric or especially hydrological causes needs further con-sideration. Indeed, many such ground deforma-tions which had been previously ascribed to a tectonic source were later demonstrated to result from the in£uence of rainfall and subsequent soil moisture and water table changes [23^25]. How-ever, the sensitivity of di¡erent geodetic
instru-Fig. 9. Spatial coincidence of measured and modeled movements along the Be¨thane section for the August 4, 1997^December 8, 1997 period. Benchmarks anchored in the Paleozoic bedrock are located in 23, 24 and 211.
ments, in most cases tiltmeters and strainmeters, to rainfall in£uence is strongly linked to their baselength [10]. In this respect, leveling is far less sensitive to ground response to rainfall than tilt measurements, whose results cannot therefore be transposed to the leveling scale. Nevertheless, we must check whether the seasonal variations of the residual vertical motions observed at Be¨thane correlate with the rainfall distribution.
Rainfall data (Fig. 6) are recorded at the Gi-leppe Dam, 1 km apart from the Be¨thane section. To take into account the assumption that a single rain causes an impulse-like ground deformation followed by exponential recovery corresponding to the subsequent progressive drying out of the soil, we calculated a cumulative function from the convolution of rainfall with an exponential function [26]:
fi Xi ki3p
rkWe tk3ti=d
where rkis the amount of rain for the kth week,d, the time constant, has been taken successively equal to 4 and 6 weeks and p = 12, corresponding to the model order. After removal of the water-load-dependent component of the observed verti-cal ground displacement, we regressed the residual motion onto this rainfall function (Fig. 6). In or-der to account for possible phase shift, we also searched for lagged correlations but in spite of considering ground response delays of up to 10 weeks, we found no signi¢cant relationship link-ing both variables.
As mentioned above, the absence of any kind of water table data clearly prevents de¢nitive con-clusions to be drawn regarding the role of its var-iations. However, several lines of evidence strongly suggest a limited, most probably insignif-icant in£uence on ground movements of the Be¨-thane section. Firstly, the similar geomorphic set-ting of both section endmarks at barely 1 km from each other makes it improbable that di¡er-ential changes in groundwater level be large enough to determine a measurable tilt of the ground surface. From the observations of Evans and Wyatt [10], we note for example that, despite signi¢cant induced changes in hydraulic gradient,
daily purging of several tens of meters of water from a borehole in low-porosity granodiorites (in-cluding an hydrothermally altered zone at 94 m depth) caused downward ground displacement of only 0.01^0.02 mm in the close vicinity of the hole. Secondly, water table variations are gener-ally not independent from rainfall [12], and we may make an argument of the absence of corre-lation between ground motion and the calculated rainfall function for further discarding the in£u-ence of groundwater. Furthermore, the vertical movement of the additional benchmarks anchored in the outcropping Paleozoic basement within the Be¨thane section remarkably ¢ts that of the end-marks 10 and 26, thus highlighting that possible groundwater £uctuation in the alluvial deposits on which the endmark-bearing buildings rest does not in£uence the latter's stability.
Compared to the hydrologically caused ground deformation, the thermoelastic e¡ects [27] and the in£uence of atmospheric pressure changes are much smaller and can be neglected here [9,28]. The absence of correlation with any considered atmospheric or hydrological factor as well as the particular location of the residual movements dis-played in Fig. 6 thus suggest that they could be related to deeper-seated causes, of direct or indi-rect tectonic origin. With regard to this possible origin, we have to discuss two characteristics of the displacement: amplitude and reversibility. Considering ¢rstly the amplitude, the millimetric size of the residual fault displacements (and their short-term episodicity as well) makes them very similar to the so-called `fault-creep' events charac-terizing some segments of major strike-slip faults [29,30]. However, the tilt excursions described here for the Be¨thane section are rapidly more or less completely recovered. This is further con-¢rmed by the recovering of most geodetically in-ferred fault displacements in NE Ardenne [6]. Although Demoulin and Collignon [6] interpreted them as typical of the `tectonic noise' which would characterize the zones of maximum strain along the limbs of crustal buckles in areas of neo-tectonic uplift, no known neo-tectonic faulting process can as yet provide a satisfying mechanical explan-ation of these reversible motions. Thus, despite frequent descriptions of similar geodetically
in-ferred up-and-down ground movements [2], their tectonic origin remains questionable.
5. Conclusion
Weekly levelings of a 1 km long section located close to a small reservoir of 25U106 m3 in NE Ardenne and a 2D ¢nite element modeling of the in£uence of waterload variations in the reservoir on ground displacement have shown that this in-£uence is restricted to a 2^3 km wide peripheral area where it causes seasonal tilt of up to 3^4 Wrads. A localized spatial discrepancy between measured and modeled movement is explained by the presence of a fault. While its Quaternary activity is demonstrated by river terrace deforma-tion, the in£uence of this fault is here passive. However, after removal of the waterload-depen-dent component of motion, there remain oscillat-ing residual displacements of 1^1.5 mm amplitude with a typical `period' of about 2 months. Most of these movements also take place on the fault and we thus addressed the question of their near-sur-face vs. tectonic origin. The observed residual dis-placements appeared to be unrelated to all
hydro-logical and atmospheric parameters we
considered. Though highly improbable, only a possible role of water table variations could not be de¢nitely ruled out. However, no alternative tectonic mechanism is able to satisfactorily ex-plain the occurrence of such short-term sense re-versals of motion, whose true nature remains enigmatic.
Acknowledgements
we are greatly indebted to A. Pissart, J.L. Ge¨n-icot (bene¢ting from a `prime' contract of the Walloon Region), R. Ancion and T. Dewez for ¢eld assistance. We also acknowledge useful dis-cussion with J.P. Radu, A. Pissart and D. Jong-mans. Constructive comments of reviewer M. Kasser also led to considerable improvement of the paper.[AC]
References
[1] H. Kooi, P. Johnston, K. Lambeck, C. Smither, R. Mo-lendijk, Geological causes of recent (V100 yr) vertical land movement in the Netherlands, Tectonophysics 299 (1998) 297^316.
[2] P. Sychev, V. Zacharov, V. Semakin, On the origin of recent and modern vertical movements in the island sys-tems of northeastern Asia, Tectonophysics 122 (1986) 283^305.
[3] J. Fourniguet, Ge¨odynamique actuelle dans le nord et le nord-est de la France, Me¨m. BRGM 127, Orle¨ans, 1987, 160 pp.
[4] A. Demoulin, A. Pissart, K. Zippelt, Neotectonic activity in and around the southwestern Rhenish shield (West Germany): indications of a levelling comparison, Tecto-nophysics 249 (1995) 203^216.
[5] A. Demoulin, T. Launoy, K. Zippelt, Recent crustal movements in the southern Black Forest (western Ger-many), Geol. Rundsch. 87 (1998) 43^52.
[6] A. Demoulin, A. Collignon, The nature of the recent ver-tical ground movements inferred from high precision lev-eling data in an intraplate setting: NE Ardenne, Belgium, J. Geophys. Res. (2000), in press.
[7] R. Reilinger, M. Bevis, G. Jurkowski, Tilt from relevel-ing: an overview of the US data base, Tectonophysics 107 (1984) 315^330.
[8] F. Wyatt, Displacement of surface monuments: vertical motion, J. Geophys. Res. 94 (1989) 1655^1664.
[9] R. Edge, T. Baker, G. Je¡ries, Borehole tilt measure-ments: aperiodic crustal tilt in an aseismic area, Tectono-physics 71 (1981) 97^109.
[10] K. Evans, F. Wyatt, Water table e¡ects on the measure-ment of earth strain, Tectonophysics 108 (1984) 323^337. [11] H. Ku«mpel, J. Peters, D. Bower, Nontidal tilt and water table variations in a seismically active region in Quebec, Canada, Tectonophysics 152 (1988) 253^265.
[12] C. Braitenberg, Estimating the hydrologic induced signal in geodetic measurements with predictive ¢ltering meth-ods, Geophys. Res. Lett. 26 (1999) 775^778.
[13] A. Demoulin, N. Lenoªtre, J. Moxhet, A. Pissart, Les re¨-gions ne¨otectoniques de la Belgique de¨¢nies par la com-paraison de nivellements, Ann. Soc. Ge¨ol. Belg. 115 (1992) 99^111.
[14] Institut Ge¨ographique militaire (IGM), Deuxie©me nivelle-ment ge¨ne¨ral. Re¨pertoire des de¨¢nitions et des altitudes des repe©res, Bruxelles, 1949, 148 pp.
[15] R. Stein, Discrimination of tectonic displacement from slope-dependent errors in geodetic leveling from southern California, 1953^1979, in: Earthquake Prediction. An In-ternational Review, Maurice Ewing Ser. Vol. 4, AGU, Washington, 1981, pp. 441^456.
[16] R. Stein, C. Whalen, S. Holdahl, W. Strange, W. Thatch-er, Saugus-Palmdale, California, ¢eld test for refraction error in historical leveling surveys, J. Geophys. Res. 91 (1986) 9031^9044.
[17] P. Vanicek, E. Krakiwsky, Geodesy. The Concepts, 2nd Edn., Elsevier, Amsterdam, 1986, 697 pp.
[18] D. Jongmans, T. Camelbeeck, Structure super¢cielle de la crouªte en Ardenne belge obtenue a© partir des enregistre-ments de tirs de carrie©re: me¨thodologie et premiers re¨sul-tats, Ann. Soc. Ge¨ol. Belg. 116 (1994) 119^127. [19] A. Monjoie, C. Schro«der, Auscultation des massifs
ro-cheux par sismique re¨fraction et proprie¨te¨s ge¨odynami-ques des terrains, in: Proceedings III International Con-gress IAEG, Section IV 2, 1978, pp. 29^36.
[20] D.I. Gough, W.I. Gough, Stress and de£ection in the lithosphere near Lake Kariba, Geophys. J. 21 (1970) 65^78 (Part I), 79^101 (Part II).
[21] J.M. Raphael, Crustal disturbances in the Lake Mead area, Eng. Monograph Vol. 21, Bureau of reclamation (Technical Information Branch), Denver Federal Center, Denver.
[22] A. Demoulin, Quaternary tectonics in the northern Ard-ennes, Belgium, Tectonophysics 163 (1989) 315^321. [23] Y. Tanaka, I. Naito, Gradual crustal movements with
some periodicity and the related phenomena, J. Geod. Soc. Jpn. 22 (1976) 311^313.
[24] K. Kasahara, Migration of crustal deformation, Tectono-physics 52 (1979) 329^341.
[25] M. Kasahara, R. Shichi, Y. Okada, On the cause of long-period crustal movement, Tectonophysics 97 (1983) 327^ 336.
[26] J. Langbein, R. Burford, L. Slater, Variations in fault slip and strain accumulation at Park¢eld, California: initial results using two-color geodimeter measurements, 1984^ 1988, J. Geophys. Res. 95 (1990) 2533^2552.
[27] J. Harrison, K. Herbst, Thermoelastic strain and tilts re-visited, Geophys. Res. Lett. 4 (1977) 535^537.
[28] G. Dal Moro, M. Zadro, Subsurface deformations in-duced by rainfall and atmospheric pressure: tilt/strain measurements in the NE-Italy seismic area, Earth Planet. Sci. Lett. 164 (1998) 193^203.
[29] K. Steinbrugge, E. Zacher, D. Tocher, C. Whitten, C. Claire, Creep on the San Andreas fault, Bull. Seismol. Soc. Am. 50 (1960) 389^415.
[30] C. Scholz, The Mechanics of Earthquakes and Faulting, Cambridge University Press, Cambridge, 1990, 439 pp.