arXiv:1009.2597v1 [astro-ph.EP] 14 Sep 2010
September 15, 2010
Transiting exoplanets from the CoRoT space mission XIV.
CoRoT-11b: a transiting massive “hot-Jupiter” in a
prograde orbit around a rapidly rotating F-type star
⋆
D. Gandolfi1
,2, G. H´ebrard3, R. Alonso4, M. Deleuil5, E.W. Guenther1, M. Fridlund2, M. Endl6,
P. Eigm¨
uller1, Sz. Csizmadia7, M. Havel8, S. Aigrain9, M. Auvergne10, A. Baglin10, P. Barge5,
A. S. Bonomo5, P. Bord´e11, F. Bouchy3
,12, H. Bruntt10, J. Cabrera7
,13, S. Carpano2, L. Carone14,
W. D. Cochran6, H. J. Deeg15, R. Dvorak16, J. Eisl¨offel1, A. Erikson7, S. Ferraz-Mello17, J.-C. Gazzano5
,8,
N. P. Gibson9, M. Gillon4
,18, P. Gondoin2, T. Guillot8, M. Hartmann1, A. Hatzes1, L. Jorda5, P.
Kabath7
,19, A. L´eger11, A. Llebaria5, H. Lammer20, P. J. MacQueen6, M. Mayor4, T. Mazeh21,
C. Moutou5, M. Ollivier11, M. P¨
atzold14, F. Pepe4, D. Queloz4, H. Rauer7
,22, D. Rouan10, B. Samuel11,
J. Schneider13, B. Stecklum1, B. Tingley15, S. Udry4, and G. Wuchterl1
(Affiliations can be found after the references) Received ; accepted
ABSTRACT
The CoRoT exoplanet science team announces the discovery of CoRoT-11b, a fairly massive hot-Jupiter transiting a V =12.9 mag F6 dwarf star (M∗= 1.27±0.05 M⊙, R∗= 1.37±0.03 R⊙, Teff = 6440±120 K), with an orbital period of P = 2.994329±0.000011 days
and semi-major axis a = 0.0436±0.005 AU. The detection of part of the radial velocity anomaly caused by the Rossiter-McLaughlin effect shows that the transit-like events detected by CoRoT are caused by a planet-sized transiting object in a prograde orbit. The relatively high projected rotational velocity of the star (v sin i⋆ = 40 ± 5 km/s) places CoRoT-11 among the most rapidly
rotating planet host stars discovered so far. With a planetary mass of Mp= 2.33 ± 0.34 MJupand radius Rp= 1.43 ± 0.03 RJup,
the resulting mean density of CoRoT-11b (ρp= 0.99 ± 0.15 g/cm3) can be explained with a model for an inflated hydrogen-planet
with a solar composition and a high level of energy dissipation in its interior.
Key words.stars: planetary systems - techniques: photometry - techniques: radial velocities - techniques: spectroscopic
1. Introduction
Discovering and studying extrasolar planets, and in gen-eral planetary systems other than ours, aims at under-standing whether the solar system is peculiar and unique or usual and unremarkable. In this context, the discov-ery of a large population of Jupiter-like planets with a semi-major axis . 0.1 AU (i.e., hot-Jupiters), as well as the detection of massive planets in very eccentric orbits (Moutou et al. 2009a; O’Toole et al. 2009) or even strongly misaligned with the stellar spin axis (H´ebrard et al. 2008; Pont et al. 2009), has proven how the properties of extraso-lar planets can be surprisingly different from those observed in the solar system’s planets.
From this point of view, studies of transiting extrasolar planets are cornerstones for understanding the nature of planets beyond the solar system, since a wealth of precious information can be gained (Winn 2010). Indeed, the pecu-liar geometry of transiting planets makes them very special targets for obtaining direct measurements of the planet-to-star radius (e.g., Rosenblatt 1971; Borucki & Summers
⋆ The CoRoT space mission, launched on 2006 December 27,
has been developed and is operated by CNES, with the con-tribution of Austria, Belgium, Brazil, ESA (RSSD and Science Programme), Germany and Spain.
1984). By combining time-series photometric observations acquired during the transit with radial velocity (RV) mea-surements of the host star, it is possible to derive the ra-dius and mass of the planet, and therefore its mean density, once the mass and radius of the star has been determined. Transits also offer a unique opportunity to measure the sky-projected angle (λ) between the orbital angular momentum vector and the spin axis of the star (Gaudi & Winn 2007). This can be done by detecting the Rossiter-McLaughlin (RM) effect, i.e., the spectral distortion observed in the line profile of a rotating star as a second object passes in front of the stellar disc.
Furthermore transit surveys have the potential to en-large the parameter space of planet host stars by detecting planets around stars that are usually not observed in radial velocity surveys. As is well known, Doppler surveys typi-cally focus on slowly rotating solar-like stars because high RV precision can easily be achieved. They usually discard more massive main-sequence stars for which accurate RV measurements are rendered unfeasible by the rapid stellar rotation rate and the paucity of spectral lines. Indeed, a few RV searches have been conducted up to now around A- and F-type stars (e.g., Lagrange et al. 2009; Guenther et al. 2009; Bowler et al. 2010; Johnson et al. 2010). Transit de-tections are not affected by the stellar rotation and can lead
to the discovery of planets around rapidly rotating F-type stars.
Space missions like CoRoT (Convection, Rotation, and planetary Transits, Baglin et al. 2006; Auvergne et al. 2009) and Kepler (Borucki et al. 2010; Koch et al. 2010) are crucial to increase the number of planets with well-known orbital and physical parameters, and consequently improve the database that is needed to investigate all the aspects of the exoplanets population, down to the Earth-like mass-regime. The recent discoveries announced by the CoRoT exoplanet science team fully demonstrate the ca-pability of the mission to determine the radius and the mean density of the transiting extrasolar planets, from the “transition desert regime” between brown dwarfs and planets (Deleuil et al. 2008), across hot and temperate Jupiter-like objects (Barge et al. 2008; Alonso et al. 2008; Bouchy et al. 2008; Aigrain et al. 2008; Moutou et al. 2008; Rauer et al. 2009; Fridlund et al. 2010; Deeg et al. 2010), and down to the Earth-like radius regime (L´eger et al. 2009; Queloz et al. 2009).
In the present paper the CoRoT Exoplanet Science Team announces its eleventh transiting planet, namely CoRoT-11b, a fairly massive Jupiter-like planet in a rel-atively short-period orbit (about three days) around a rapidly rotating F6 dwarf star. By combining the high-precision photometric data from CoRoT with RV mea-surements and high signal-to-noise spectroscopy from the ground, we fully characterised the planet’s orbit and de-rived the main physical parameters of the planet-star sys-tem. Thanks to time-series RV measurements acquired dur-ing the transit we observed part of the RM effect and con-firm the planetary transit event.
2. CoRoT observations, data reduction, and
analysis
2.1. Satellite observations
CoRoT-11b was discovered during the CoRoT’s second long run towards the Galactic centre direction, i.e., the CoRoT LRc02 run.1 The observations lasted 145 days,
from 2008 April 15 to September 7. The LRc02 field is centred at α ≈ 18h42m and δ ≈ 6◦39′ (J2000),
be-tween the Ophiuchus and the Serpens Cauda constella-tions. The planet was detected transiting the CoRoT star2
with ID=0105833549. The main designations of the planet host star CoRoT-11 along with its equatorial coordi-nates and optical and near-infrared photometry, are re-ported in Table 1 as retrieved from the ExoDat database (Deleuil et al. 2009) and 2MASS catalogue (Cutri et al. 2003).
The transiting planet was detected after 51 days of observations in the so-called CoRoT alarm-mode (Quentin et al. 2006; Surace et al. 2008). This observing strategy consists in processing and analysing a first set of photometric data in order to single out planetary transits while the CoRoT run is still on-going. This enabled us to
1 The ‘LR’ prefix means that the field is a long-run field
(typ-ically 150 days of observations). The letter ‘c’ refers to the Galactic centre direction. The last two digits ’02 ’ indicate that the observed field is the second CoRoT long-run towards the Galaxy centre.
2 See Carpano et al. (2009) for a full description of the
CoRoT target nomenclature.
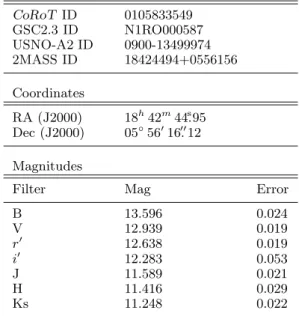
Table 1. CoRoT, GSC2.3, USNO-A2, and 2MASS identi-fiers of the planet host star CoRoT-11. Equatorial coordi-nates, optical, and near infrared photometry are from the ExoDat catalogue (Deleuil et al. 2009) and 2MASS cata-logue (Cutri et al. 2003).
Main identifiers CoRoT ID 0105833549 GSC2.3 ID N1RO000587 USNO-A2 ID 0900-13499974 2MASS ID 18424494+0556156 Coordinates RA (J2000) 18h42m44.s95 Dec (J2000) 05◦56′16.′′12 Magnitudes
Filter Mag Error
B 13.596 0.024 V 12.939 0.019 r′ 12.638 0.019 i′ 12.283 0.053 J 11.589 0.021 H 11.416 0.029 Ks 11.248 0.022
switch the time sampling of the light curve from 512 to 32 seconds and trigger the ground-based follow-up observa-tions (see Sect. 3). Thanks to an objective prism in the opti-cal path of the CoRoT exoplanet channel (Auvergne et al. 2009), CoRoT-11 was observed in three broad-band colours (red, green, and blue), according to the specific photomet-ric mask selected at the beginning of the run. This usually allows us to remove false positives that mimick planetary transit events, such as stellar activity or eclipsing binaries. A total of 261 917 photometric data-points were collected for each colour channel, 8 349 of those were obtained with a time sampling of 512 sec, and 253 568 with 32 sec. The transit signal was detected in all three colour channels with the similar depth and the same duration and ephemeris as expected for a bona-fide planetary transit.
At the end of the LRc02 observing run, the whole photometric data-set of CoRoT-11 was processed using the CoRoT reduction and calibration package described in Auvergne et al. (2009). The pipeline also flags bad pho-tometric data-points collected during the entrance into and exit from the Earth’s shadow or data-points that are strongly affected by hits of high-energy particles resulting from the crossing of the South Atlantic Anomaly (SAA).
2.2. CoRoT light curve and transit fit
In order to increase the signal-to-noise (S/N) ratio, the analysis of the photometric data was performed using the white light curve, as derived by adding together the sig-nal from the three colour channels. CoRoT-11 has a close neighbour star at about 2′′ northwest, falling well inside
the CoRoT photometric aperture, as well as a handful of faint nearby stars that are spatially located around the CoRoT mask (see also Sect. 3.1 and Fig. 3). According to the ExoDat database, the closest neighbour star is 2.1 mag-nitudes fainter than CoRoT-11 in the r′-band. Following
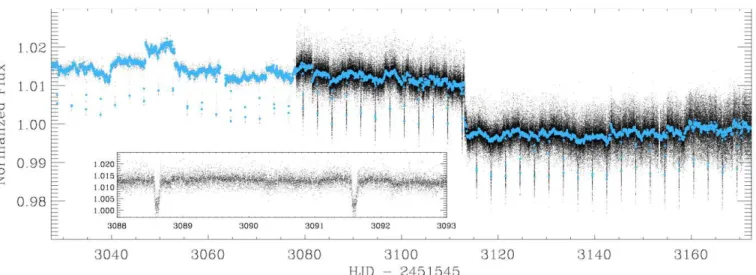
Fig. 1. Whole (145 days) cleaned light curve of CoRoT-11, sampled at 512 seconds from the first ∼ 50 days, and at 32 seconds until the end of the run. For the sake of clarity, the blue dots represent 1-hour binned points. The inset plot is a zoom of the light curve showing two transits of CoRoT-11b. The “jumps” observed in the plot are caused by the impacts of high-energy particles onto the CCD’s lattice. The light curve has been arbitrarily normalised to the median value of the flux. See the online edition of the Journal for a colour version of this figure.
the method described in previous CoRoT papers (e.g., Alonso et al. 2008), we estimated that it contributes about 12.2 % of the total flux of the photometric mask of CoRoT-11. Taking also into account the light coming from the fainter neighbours, the total contamination fraction rises up to 13.0 ± 1.5 %. This fraction was removed from the whole data-set prior to analysing the white light curve.
A first cleaning of the raw CoRoT data was performed applying an iterative sigma-clipping algorithm. Most of the photometric points rejected according to this criterion (about 7.8 %) resulted from the crossing of the SAA and matched the photometric data previously flagged as outlier by the CoRoT automatic pipeline (Auvergne et al. 2009). The cleaned white light curve is plotted in Fig. 1. It shows 49 transits with a depth of ∼ 1 %, occurring about every three days. The transits are clearly visible, as shown in the inset of Fig. 1. Out of 49 transits, 17 were detected with a 512 seconds time sampling, whereas 32 were observed with the oversampled rate (32 seconds). The light curve is moderately affected by sudden “jumps” in intensity re-sulting from the impact of high-energy particles onto the CoRoT CCDs (Pinheiro da Silva et al. 2008). The high-frequency scatter of the light curve (Fig. 1) is compati-ble with other sources of similar brightness observed by CoRoT Aigrain et al. (2009).
The CoRoT light curves are affected by a modulation of the satellite orbital period, which changes its shape and amplitude during a long run observation. Following the pre-scription of Alonso et al. (2008), the orbital signal of each jth orbit was corrected with the signals from the previous and the following 30 orbits. The data points acquired dur-ing the transits were not considered in the estimate of the mean orbital signal of the jth orbit.
In order to determine the period P and transit epoch Ttr, we first used an approximate ephemeris to build a
phase-folded curve of the transit. A simple trapezoidal model was fitted to this curve to get the parameters of the average transit, i.e., depth, duration, centre, and
Fig. 2. Binned and phase-folded curve of the transit of CoRoT-11b, with the best-fit model over-plotted and the residuals of the fit. The standard deviation of the points outside transit is of 230 ppm (with a phase sampling of 5 × 10⁻⁴, corresponding to about 129 seconds). The mean
error bar of the bins is of 239 ppm, revealing an insignificant amount of red noise in the phase-folded light curve after the corrections described in the text have been performed.
ingress/egress time. This model was then fitted to each in-dividual transit, leaving only the centre as free parameter. A linear fit to the final observed-calculated (O − C) dia-gram of the transit centres served to refine the ephemeris, and we iterated the process until the fitted line had no sig-nificant slope. Once the orbital period and transit epoch were derived (Table 4), we constructed a combined phase-folded transit curve to this ephemeris by successively
nor-malising each transit to the regions surrounding it. In this case, because the star is not very active (see Fig. 1), we used simple line fits to the phases between [ −0.06, −0.02 ], and [ 0.02, 0.06 ], using the ephemeris of Table 4, and ap-plied this normalisation to the whole section from phases [ −0.06, 0.06 ]. We used a Savitzky-Golay filter to recognize a few remaining outliers before binning in phase. Taking into account the photometry rejected according to the first sigma-clipping algorithm, this process removed about 1.6 % of the remaining data points, leading to a final duty cycle of ∼ 90 %.
Finally, the data-points were binned in blocks of 0.0005 in phase, and the error bars were estimated as the standard deviation of the data points inside each bin divided by the square root of the number of points inside the bin. The phase-folded curve of the transit is shown in Fig. 2.
The transit was fitted to a model using the formalism of Gim´enez (2006). To find the solution that best matches our data, we minimized the χ2 using the algorithm AMOEBA
(Press et al. 1992). The fitted parameters were the centre of the transit, the phase of start of the transit θ1, the
planet-to-star radius ratio k = Rp/R∗, the orbital inclination i and
the two non-linear limb darkening coefficients u+= ua+ ub
and u− = ua−ub. We used a quadratic law for the limb
darkening, given by I(µ) = I(1)[1 − ua(1 − µ) − ub(1 − µ)2],
where I is the distribution of brightness over the star and µ is the cosine of the angle between the normal to the local stellar surface and the line of sight. The use of u+and u−is
a better choice to avoid correlations between the two limb darkening coefficients ua and ub, as described in Gim´enez
(2006). To estimate the errors in each of the parameters we performed the χ2minimization to five hundred different sets
of data. These data-sets were constructed with different val-ues for the contamination factor (estimated at 13.0±1.5 %), and different starting values to the AMOEBA minimiza-tion. To build each set, we first subtracted the best solu-tion to the data, and then shifted circularly the residuals by a random quantity to keep the low-frequency content of the noise. The best-fit solution was finally added to these new residuals. For each of the fitted parameters in all data-sets, we calculated the standard deviation as an estimate of the errors. In order to take into account the effect of the non-Gaussian distributions of the parameters, we also forced a Gaussian fit to the measured distributions. The adopted (conservatively larger) error bar was the biggest error among the standard deviation of the fitted parameters and the σ of the fitted Gaussian distribution. The parame-ters and associated errors are listed in Table 4, along with the scaled semi-major axis a/R∗, as derived using Eq. 12
in Gim´enez (2006). Assuming a circular orbit (i.e., e = 0) and combining the scaled semi-major axis a/R∗ with the
orbital period P via the Kepler’s laws, we derived the pa-rameter M∗1/3/R∗ = 0.787 ± 0.010 in solar units, which
leads to a mean stellar density ρ∗ = 0.62 ± 0.02 g/cm3
(see Seager & Mall´en-Ornelas 2003; Winn 2010, for the rel-evant formulas). The transit fit yielded the limb darken-ing coefficients u+ = 0.61 ± 0.06 and u− = 0.02 ± 0.04
(Table 4), in very good agreement with the theoretical val-ues u+= 0.64±0.01 and u−= 0.06±0.01 predicted by Sing
(2010) for a star with the same fundamental parameters as CoRoT-11 (Sect. 3.4).
Note that the standard deviation of the residuals out-side the transit phase is 230 ppm, which is within the
uncer-tainties identical to the mean error bar of each of the bins (239 ppm), thus revealing the small low-frequency noise in the phase-folded light curve after the analysis described above.
2.3. Planetary eclipse upper limits
We searched for the eclipse of the planet in the CoRoT light curve with the same techniques as described in Alonso et al. (2009a,b) and Fridlund et al. (2010). To account for a pos-sible eccentric orbit, we mapped the χ2 levels of a fit to a
trapezoid (with the shape parameters estimated from the transit) for different orbital phases. We did not obtain any significant detection above 100 ppm in depth. We can thus set an upper 3 σ limit for the planetary eclipse depth of 100 ppm, which we translated into an upper limit to the brightness temperature of 2650 K (Alonso et al. 2009b).
3. Ground-based observations, data reduction, and
analysis
As already described in previous CoRoT discovery papers, intensive ground-based observations are mandatory to es-tablish the planetary nature of the transiting candidates detected by CoRoT. These follow-ups are crucial to rule out possible false positives, i.e., physical configurations that mimick planetary transits, which cannot be excluded on the basis of meticulous light curve analyses only. Out of about 50 promising candidates detected per CoRoT long run field (see Carpano et al. 2009; Moutou et al. 2009b; Cabrera et al. 2009; Carone et al. 2010), usually only a handful turns out to be bona fide planetary objects. Furthermore, ground-based observations are needed to as-sess the planetary nature of the transiting object, derive the true mass of the planet, and measure the stellar parameters of the host star needed to accurately compute the planet radius3.
Follow-up campaigns of the planetary transit candidates detected by the alarm-mode in the LRc02 field started in early Summer 2008. In the following subsection we will de-scribe the complementary photometric and spectroscopic ground-based observations of CoRoT-11.
3.1. Photometric follow-ups
The objective prism placed along the optical path of the CoRoTexoplanet channel spreads the light of the observed targets over about 50 pixels on the CCDs, correspond-ing to a projected sky area of about 20′′×10′′. The
to-tal flux of each CoRoT target is then computed by in-tegrating the pixel signal over a preselected photometric mask elongated along the dispersion direction and cover-ing most of the point spread function (PSF). As already described in Sect. 2.2, this increases the possibility that the light of neighbour stars could contaminate the flux of the CoRoT target. Furthermore, what is believed to be a “good” planetary transit might actually turn out to be the eclipse of a faint nearby binary system, whose light is di-luted by the CoRoT target star.
To reproduce the observed ∼1.1 % deep transit, a generic contaminant star cannot be more than ∼5 mag
3 We remind the reader that transits provide the direct
Fig. 3. Sky area around CoRoT-11. Left : r′-filter image
as retrieved from the ExoDat database. CoRoT-11 is the brightest source in the centre of the image. The nearby contaminant star, about 2′′northwest from the main target,
is clearly visible. Right : image acquired by CoRoT, at the same scale and orientation. The thick line around the target delimits the photometric mask used to integrate the signal of CoRoT-11. Note how the target and the contaminant are completely blurred and blended. The crosses in the image mark the position of the stars in the field.
fainter than CoRoT-11. As already mentioned above, CoRoT-11 has a close, 2.1 mag fainter neighbour star that might thus actually be the potential source of false alarm (Fig. 3). In order to exclude this scenario, we took advantage of the CoRoT ephemeris to perform the so-called “on-off” photometry. In this procedure, candidates are photometrically observed with ground-based facilities at higher spatial resolution than CoRoTduring the transit (on-observation) and out of the transit (off-observation). The brightness of the candidates, as well as that of any nearby stars, is then monitored to unveil any potential background eclipsing binary. Full details of this method are described in Deeg et al. (2009).
According to this observing strategy, R-band photome-try was carried out on 2008 July 4, using the CCD camera mounted on the Swiss Leonard Euler 1.2 m telescope at La Silla Observatory (Chile), under photometric sky con-dition. Four sets of five consecutive exposures of 45 sec-onds each were acquired. The first set was obtained during the predicted transit (on-observation), whereas the remain-ing three were taken out of transit (off-observations). The data were reduced with standard IRAF routines4; aperture
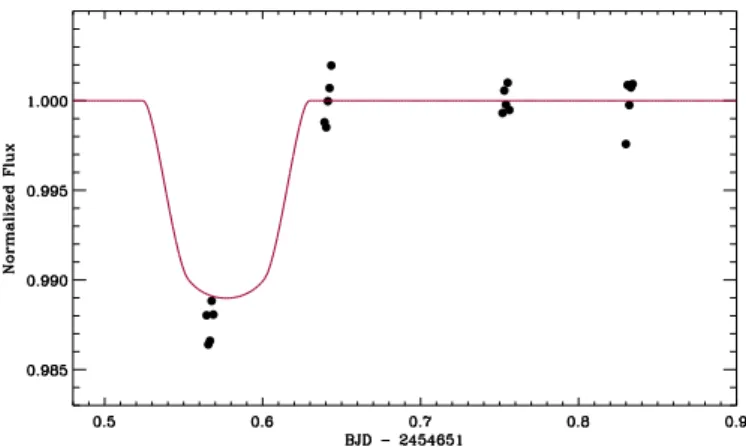
photometry was performed with the DAOPHOT package under the IRAF environment. Differential photometry was obtained for CoRoT-11, as well as for the nearby contam-inants, using a set of nearby comparison stars. The on-off Euler observations clearly show that CoRoT-11 is the source of the transit events detected by CoRoT (Fig. 4). The first photometric data-set shows a dimming of the light of CoRoT-11 at the expected time and with roughly the
4 IRAF is distributed by the National Optical Astronomy
Observatory, which is operated by the Association of Universities for Research in Astronomy (AURA), inc., under cooperative agreement with the National Science Foundation.
Fig. 4. r-band light curve of CoRoT-11 as seen with the CCD camera mounted on the Swiss Leonard Euler 1.2 m telescope at La Silla Observatory (Chile). The black circles mark each single exposure. The transit fit is over-plotted as derived from the CoRoT light curve analysis.
same depth at mid-transit. The 2.1 mag fainter star lo-cated at about 2′′ northwest of the target should undergo
eclipses with depths of about 0.1 mag, something which the ground-photometry clearly excluded. By centring and co-adding the best-seeing Euler images, we excluded the presence of a third nearby object down to R ≈ 17.5 mag and up to 1.5′′from CoRoT-11.
More Johnson R-band photometric observations of CoRoT-11 were carried out using the 30 cm TEST telescope at the Th¨uringer Landessternwarte (TLS), Tautenburg (Germany), on 2008 September 7. Full details of the instru-ment, observing strategy, and data reduction can be found in Eisl¨offel et al. (2007) and Eigm¨uller & Eisl¨offel (2009). Although these observations were performed at higher time-sampling than those at Euler, they were affected by poor weather conditions, especially in the second half of the night. Nevertheless, we succeeded to observe the transit ingress of CoRoT-11b at the expected CoRoT ephemeris and exclude significant photometric variations in the nearby contaminant stars.
3.2. Reconnaissance low-resolution spectroscopy
Low-resolution reconnaissance spectroscopy of the planet host star was performed with the long-slit spectrograph mounted at the Nasmyth focus of the 2 m Alfred Jensch telescope of the TLS observatory, Tautenburg, Germany. These observations were part of an intensive programme devoted to the spectroscopic “snap-shot” of the plane-tary candidates detected by the alarm-mode in the LRc02 CoRoT field. They were useful to quickly classify the stars and derive a first estimate of their photospheric parame-ters. Furthermore, they allowed us to identify and remove giant stars, for which the transiting object would result in a low-mass stellar companion, as well as B-type objects and rapidly rotating early-type stars, for which high-precision radial velocity measurements cannot be achieved.
CoRoT-11 was observed on 2008 August 8, under clear and stable weather conditions. Three consecutive exposures of 20 minutes each were acquired and subsequently com-bined to remove cosmic ray hits and improve the S/N ratio. The data reduction was performed with a
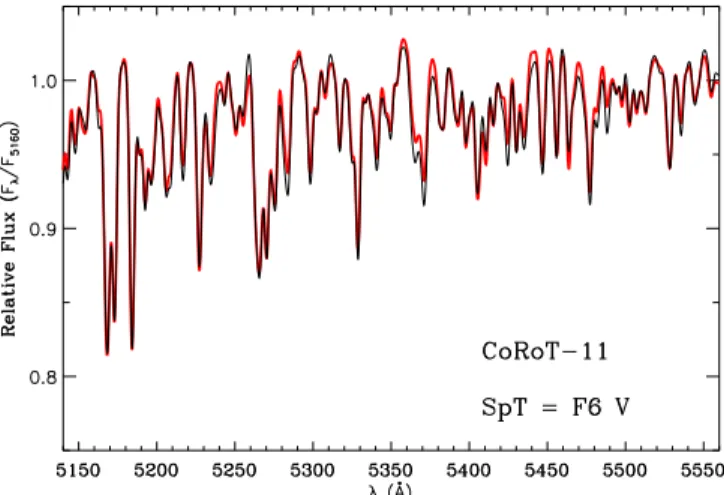
semi-Fig. 5. Section of the TLS low-resolution spectrum of CoRoT-11 (thin black line). Overplotted with a thick red line is the best-fitting F6 V template. The spectra have been arbitrarily normalised to the flux at 5160 ˚A. See the online edition of the Journal for a colour version of this figure.
automatic pipeline developed under the IDL5
environ-ment. Relative flux calibration was performed observing two spectro-photometric standard stars. The final extracted and co-added spectrum covers the wavelength range 4950– 7320 ˚A, with a resolving power R ≈ 2100 and an average S/N ≈ 60. The spectral type and the luminosity class of CoRoT-11 was derived by fitting the observed spectrum with a grid of suitable template spectra, as described in Frasca et al. (2003) and Gandolfi et al. (2008) and shown in Fig. 5. We found that CoRoT-11 is an F6 V star, with an accuracy of about ± 1 sub-class (Table 4).
3.3. Radial velocity observations
The RV follow-up of the host star CoRoT-11 was started in summer 2008 by acquiring two high-resolution spec-tra with the SOPHIE spectrograph (Bouchy et al. 2009) attached to the 1.93 m telescope of the Haute-Provence Observatory (France). The instrument was set in its high efficiency (HE), leading to a resolving power of R ≈ 40 000. These observations revealed a rapidly rotating star with rel-atively broad spectral lines, corresponding to a projected rotational velocity (v sin i⋆) of ∼ 40 km/s. According to
the CoRoT ephemeris, the SOPHIE spectra were secured around the extreme orbital phases (i.e., phase 0.25 and 0.75), and showed a RV variation of ∼ 450 m/s in phase with the CoRoT ephemeris. Because the F6 V spectral type of the host star translates into a stellar mass of about 1.3 M⊙, the measured RV variation is compatible with a
∼2 MJup Jupiter planet. Twelve additional RV
measure-ments were obtained in summer 2008 and 2009 using the HARPS spectrograph (Mayor et al. 2003) mounted at the 3.6 m ESO telescope on La Silla (Chile). The spectra were acquired at different orbital phases, under good weather conditions and without strong moonlight contamination. The data were acquired setting the spectrograph both in
5 IDL is distributed by ITT Visual Information Solutions,
Boulder, Colorado.
the EGGS and HARPS standard modes, yielding a resolv-ing power of R ≈ 70 000 and R ≈ 115 000, respectively.
The extraction of both the SOPHIE and HARPS spec-tra was performed using the respective pipelines. Following the techniques described by Baranne at al. (1996) and Pepe at al. (2002), the radial velocities were measured from a weighted cross-correlation of the spectra with a numerical mask. We used a standard G2 mask that includes more than 3500 lines. Cross-correlations with F0 and K5 masks gave similar results. One SOPHIE spectrum and three HARPS spectra were corrected for small moonlight contamination following the method described in Pollacco et al. (2008) and H´ebrard et al. (2008), which uses a reference back-ground sky spectrum obtained through a second fiber spa-tially located near the target. This led to a radial velocity correction of 700 ± 80 m/s and below 450 ± 50 m/s for the SOPHIE and HARPS spectra, respectively.
Two complementary RV measurements were acquired using the echelle spectrograph mounted on the 2 m Alfred Jensch telescope of the TLS observatory, Tautenburg (Germany), in July and August 2009. For each observing night, two consecutive exposures of 30 minutes each were recorded to increase the S/N ratio and remove cosmic ray hits. The adopted instrument set-up yielded a spectral res-olution of about R ≈ 30 000. The data were reduced us-ing standard IRAF routines. The wavelength solution was improved acquiring ThAr spectra immediately before and after each stellar observation. After accounting for instru-mental shifts with telluric lines, the radial velocities were measured cross-correlating the target spectra with a spec-trum of the RV standard star HR 5777 observed with the same instrument set-up.
As part of NASA’s key science programme in support of the CoRoT mission, more RV measurements were obtained with the HIRES spectrograph (Vogt et al. 1994) mounted on the Keck I 10 m telescope, at the Keck Observatory (Mauna Kea, Hawai’i). With the aim of detecting the Rossiter-McLaughlin effect, 13 RV measurements were se-cured during the expected transit on 2009 July 1 (UT). The observations were performed with the red cross-disperser and the I2 absorption cell to correct for instrumental shifts
of the spectrograph. The 0.′′861 wide slit together with the
14′′ tall decker was employed to allow proper background
subtraction, yielding a resolving power of R ≈ 50 000. In order to adequately sample the RM anomaly, the exposure time was set to 900 seconds. Two extra spectra of 1200 sec-onds each were also acquired out of transit, on 2009 June 30 (UT). The spectra were reduced with IRAF standard rou-tines. The HIRES RV measurements were derived with the iodine data modelling code “Austral” (Endl et al. 2000).
The final RV measurements of CoRoT-11 are reported in Table 2, along with error bars, exposure times, and S/N ratio. In spite of the good RV stability of the spec-trographs used in the present work, the relatively high v sin i⋆ of CoRoT-11 strongly affected the RV precision of
our measurements and led to an accuracy in the range ∼100 − 200 m/s, with a typical error bar of about 100 m/s even for the HARPS and HIRES data. The five data-sets, i.e., the SOPHIE, HIRES, and TLS data, and the two HARPS modes, were simultaneously fitted with a Keplerian model, assuming a circular orbit. The HIRES RV measure-ments acquired during the transit were not used in the fit. Both period and transit central time were fixed according
Table 2.Radial velocities of the planet host star CoRoT-11 obtained with the SOPHIE, HARPS (EGGS and standard HARPS mode), COUD´E@TLS, and HIRES spectrographs. The systemic velocities for each instrument, as derived from the circular Keplerian fit to the data, are reported on the right of the listed spectrographs. The footnote indicates the RV measurements that have been corrected for moonlight contamination.
HJD RV σRV Bisector Texp S/N per resolution
(days) (km/s) (km/s) (km/s) (sec) element at 5500 ˚A SOPHIE - HE Mode Vr= −0.920 ± 0.160 km/s
2454643.60252a -1.164 0.218 1402 42
2454683.42036 -0.714 0.206 1607 50
HARPS - EGGS Mode Vr= −1.229 ± 0.041 km/s
2454731.52836 -0.932 0.067 -0.531 2700 88 2454742.51115 -1.364 0.104 -0.149 2700 54 2454745.51100 -1.370 0.087 -0.476 2700 66 2454746.51455 -0.986 0.071 -0.583 2700 81 2454747.51953 -1.509 0.115 -0.892 1800 48
HARPS - Standard Mode Vr= −1.336 ± 0.044 km/s
2455023.66206a -1.663 0.149 -0.286 3600 34 2455024.63997a -1.405 0.111 -0.705 3600 48 2455045.69605a -1.013 0.114 -0.747 3600 52 2455064.60739 -1.166 0.083 -0.408 3300 64 2455067.51277 -1.085 0.092 -0.204 3300 59 2455068.49041 -1.547 0.130 0.472 3300 42 2455069.51299 -1.384 0.110 -0.497 3300 48 COUD´E@TLS Vr= −0.640 ± 0.130 km/s 2455035.46055 -0.951 0.174 2 × 1800 25 2455057.40390 -0.541 0.175 2 × 1800 25 HIRES Vr= −0.207 ± 0.040 km/s 2455012.80417 -0.033 0.050 1200 61 2455013.06216 0.181 0.086 1200 71 2455013.78975 -0.165 0.089 900 54 2455013.80073 -0.083 0.090 900 56 2455013.81181 -0.170 0.135 900 56 2455013.82275 0.173 0.111 900 57 2455013.83360 -0.012 0.142 900 57 2455013.84473 0.099 0.073 900 56 2455013.85572 0.037 0.119 900 56 2455013.86677 0.274 0.108 900 55 2455013.87785 0.240 0.078 900 55 2455013.88881 0.017 0.100 900 56 2455013.89978 0.089 0.080 900 56 2455013.91097 -0.263 0.086 900 54 2455014.05389 -0.386 0.119 900 58 Notes.
(a)Corrected for moonlight contamination.
to the CoRoT ephemeris. An RV shift was let free to vary in the fit between the five data sets.
The RV measurements are plotted in Fig. 6 together with the best-fitting circular orbit. The derived orbital pa-rameters are reported in Table 4, along with error bars that were computed from χ2 variations and Monte Carlo
ex-periments. The RV measurements led to a semi-amplitude K = 280 ± 40 m/s. The standard deviation of the resid-uals to the fit is σO−C = 88 m/s, in agreement with the
expected accuracy of the RV measurements. The reduced χ2is 1.1 for the 22 RV measurements used in the fit.
We explored the possibility that the observed RV vari-ations of CoRoT-11 do not result from the planet’s orbital motion, but are instead caused by a periodic distortions in the spectral lines caused by either stellar magnetic activ-ity or the presence of a hypothetical unresolved eclipsing binary, whose light is diluted by CoRoT-11. In order to ex-clude these scenarios, we performed an analysis of the cross-correlation function (CCF) profile. Using the highest res-olution spectra in our data-set (i.e., the HARPS measure-ments) and following the line-bisector technique described in Queloz et al. (2001), we derived the difference in veloc-ity space between the lower and upper part of the HARPS
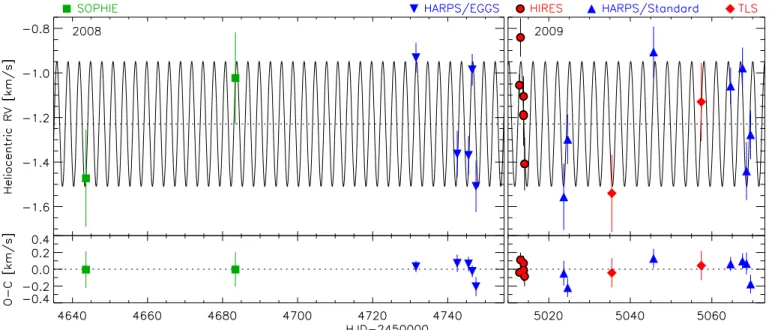
Fig. 6.Top: Radial velocity measurements of CoRoT-11 with 1-σ error bars as a function of time and the Keplerian fit to the data. The data are from SOPHIE (green squares), HARPS (blue downward and upward triangles for EGGS and HARPS modes, respectively), HIRES (red circles), and COUD´E@TLS (red diamonds). The left and right panels show the two observational seasons in 2008 and 2009. The systemic radial velocity of Vr = −1.229 ± 0.041 km/s, as derived
from the HARPS/EGGS data-set only, is plotted with a horizontal dotted line. Bottom: Residuals of the fit.
CCFs (i.e., bisector span). The value of the bisector span velocities are listed in Table 2. The uncertainty was set to twice that of the corresponding HARPS radial velocity measurements. We found that the CCFs show a system-atic asymmetric profile, translating into a negative value of the bisector span velocities (Table 2 and Fig. 7), which is usually observed in rapidly rotating F-type stars (Gray 1986, 1989). Nevertheless, the CCF bisector spans show neither significant variations nor any trend as a function of both RV measurements and orbital phases (Fig. 7). The lin-ear Plin-earson correlation coefficient between the HARPS RV measurements and the corresponding CCF bisector spans is −0.25. Removing the only outlier point with positive bi-sector span (i.e., 0.472 km/s), the correlation coefficient approaches zero, being −0.03. Thus the observed RV ations seem not to be caused by spectral line profile vari-ations to any significant degree, but are mainly due to the Doppler shift induced by the orbital motion of CoRoT-11b. The RV observations and the transit-signal detected by CoRoT point to a hot-Jupiter-sized planet that orbits the star.
The phase-folded RV measurements are plotted in Fig. 8. As already described, the orbit was assumed to be circular, which is a reasonable assumption for close-in hot-Jupiters. The radial velocities are not accurate enough to constrain the eccentricity with the orbital fit only. Indeed, a Keplerian fit with an eccentricity of about 0.6 provides a solution that agrees with the CoRoT ephemeris, with a RV semi-amplitude K which is 15 % larger than the one obtained for a circular orbit. The standard deviation of the residuals to this eccentric fit (σO−C = 95 m/s) is marginally
higher than the circular fit. Only extremely eccentric or-bits with e > 0.7 produce low-quality fits, with dispersions larger than 120 m/s. Nevertheless, we put some constraints on the possible value for the planet eccentricity, taking
ad-Fig. 7.Bisector spans versus radial velocity measurements (top panel) and orbital phases (bottom panel) as derived from the HARPS data (blue downward and upward tri-angles for EGGS and HARPS modes, respectively). The horizontal dotted line marks the average negative value of the CCF bisector span, i.e. −0.417 km/s.
vantage of the transit fit parameter M∗1/3/R∗, from which
ob-Fig. 8. Phase-folded radial velocity measurements of CoRoT-11, and Keplerian fit to the data. The horizon-tal dotted line marks the systemic radial velocity Vr =
−1.229 ± 0.041 km/s, as derived from the HARPS/EGGS data-set only.
tained value of M∗1/3/R∗depends on the eccentricity of the
orbit. We found that for e & 0.2 the mean stellar density would be incompatible with a F6 dwarf star, because it is significantly higher than the expected value (Cox 2000).
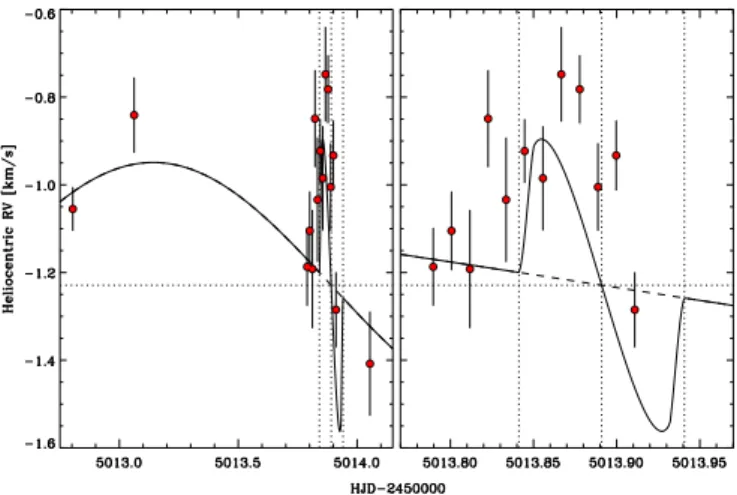
The on-transit RV data of CoRoT-11 are plotted in Fig. 9. Unfortunately, the HIRES observations were per-formed according to an old, slightly incorrect, transit ephemeris based on the analysis of the alarm-mode data only. Nevertheless, although the HIRES measurements cover only the first half of the transit, they clearly show that the Rossiter-McLaughlin (RM) anomaly has been detected, which also confirms the occurrence of the transit events. The RM amplitude is large (∼ 400 m/s), because of the fast stellar rotation. This also proves that the transiting object has a planetary size. The first part of the spectroscopic tran-sit shows radial velocities that are blue-shifted compared to the Keplerian fit, which clearly indicates that the orbit is prograde. In addition, systematics seem to be present in the data at a level above the expected uncertainties for some measurements. It is thus difficult to constrain the spin-orbit angle with the current data. In Fig. 9 we show a model with λ = 0◦ and v sin i
⋆ = 40 km/s, using the analytical
approach developed by Ohta et al. (2005). The fit is not satisfying, suggesting in particular a v sin i⋆ value higher
than the one we derived from the SOPHIE RV data and the spectral analysis (Sect. 3.4), in order to have a larger amplitude for the anomaly. It is known that a discrepancy could be found between the v sin i⋆ values measured from
the RM effect and from the spectral modelling of line broad-ening, especially for fast rotators (see e.g., Simpson et al. 2010). Concerning the spin-orbit angle, the data are com-patible with λ = 0◦. However, as for v sin i
⋆, the moderate
quality of the data-set prohibits accurate measurements. Additional RM observations of CoRoT-11 should be per-formed, with a full coverage of the event.
3.4. High-resolution spectroscopy and stellar analysis
To derive the fundamental atmospheric parameters of the planet host star, we observed CoRoT-11 with the
high-Fig. 9. Radial velocities of CoRoT-11 measured with the HIRES spectrograph around the transit that occurred on July 1st, 2010. The left panel shows all the RV data and
the right panel shows a magnification on the transit. The dashed line shows the Keplerian fit without transit. The solid line shows the Rossiter-McLaughlin anomaly fit for λ = 0◦. The vertical dotted lines show the transit first
contact, mid-time, and fourth contact. The data have been arbitrarily shifted to the systemic radial velocity of Vr =
−1.229 ± 0.041 km/s (horizontal dotted line), as derived from the HARPS/EGGS data-set only.
resolution spectrograph UVES mounted at the 8.2 m Very Large Telescope (ESO-VLT; Paranal Observatory, Chile). Two consecutive spectra of 2380 seconds each were acquired in service mode on 2008 September 17, under the ESO pro-gramme 081.C-0413(C). The star was observed through a 0.′′5 wide slit, setting the UVES spectrograph to its
Dic-1 mode (346+580). The adopted configuration yielded a resolving power of about 65 000, with a spectral coverage λ ≈ 3000 − 6800 ˚A. The spectra were extracted and com-bined with standard IRAF packages, giving a final S/N ra-tio of about 160 at 5500 ˚A.
The effective temperature (Teff), surface gravity (log g),
metallicity ([Fe/H]), and projected rotational velocity (v sin i⋆) of CoRoT-11 were derived following the
pro-cedure already adopted for other CoRoT host stars (e.g., Deleuil et al. 2008; Fridlund et al. 2010; Bruntt et al. 2010). We took advantage of different spectral analy-sis packages applied independently by different teams within the CoRoT community, e.g., the SME 2.1 (Valenti & Piskunov 1996; Valenti & Fischer 2005), the VWA (Bruntt et al. 2004, 2008, 2010) software. We found that the estimated values of the above mentioned physical parameters agree within the error bars. The final adopted values are Teff = 6440 ± 120 K, log g = 4.22 ± 0.23,
[Fe/H] = −0.03 ± 0.08, and v sin i⋆= 40 ± 5 km/s (Table 4),
with the latter value in perfect agreement with the one de-rived from the RV data (Sect. 3.3).
We also used the VWA software package to perform a detailed abundance analysis of the UVES spectrum of CoRoT-11, by iteratively fitting reasonably isolated spec-tral lines. Atmosphere models were interpolated in a grid of MARCS models (Gustafsson et al. 2008) and atomic data were extracted from VALD (Kupka et al. 1999). However, owing to the relatively high v sin i⋆ of the star, only 71
Fig. 10. Small section of the observed UVES spectrum (thin black line) together with the best-fitting synthetic template (dashed line). The spectral lines used for the abundance analysis and the neighbouring lines are shown with black and red colours, respectively. See the online edi-tion of the Journal for a colour version of this figure.
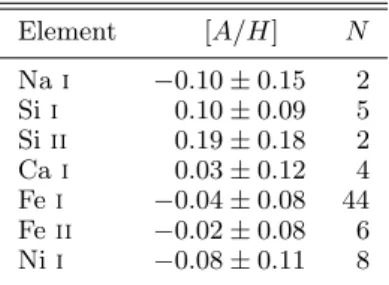
lines turned out to be sufficiently isolated and thus suitable for spectral analysis. A small section of the observed and fitted synthetic spectra is shown in Fig. 10. Abundances were computed relative to the Sun to correct the oscillator strengths (see Bruntt et al. 2008; Bruntt 2009). We deter-mined the atmospheric parameters by adjusting them to minimise the correlation of iron (Fe) with equivalent width (EW) and excitation potential (EP). Furthermore, we re-quired that Fe i and Fe ii have the same mean abundance within the uncertainty. To evaluate the uncertainty on the atmospheric parameters, we perturbed them to determine when the correlations of Fe i with EW or EP become sig-nificant or the Fe i and Fe ii abundances deviate by more than 1 σ (see Bruntt et al. 2008, for details). In Table 3 we list the abundances relative to the Sun for the five elements Na, Si, Ca, Fe, and Ni.
4. Results
4.1. Stellar parameters of the parent star CoRoT-11
To determine the mass and radius of the CoRoT-11 host star we took advantage of the stellar parameter (M∗1/3/R∗) as derived from the CoRoT light curve analysis
(Sect. 2.2), and of the effective temperature and metallic-ity (Teff and [Fe/H]) as obtained from the spectral analysis
(Sect. 3.4). We thus compare the location of the star on a log(M∗1/3/R∗) vs. log(Teff) H-R diagram with evolutionary
tracks computed with the CESAM code (Morel & Lebreton 2008). According to these theoretical models we obtained a stellar mass of M⋆= 1.27 ± 0.05 M⊙ and a stellar radius
of R⋆= 1.37 ± 0.03 R⊙, with an age of about 2.0 ± 1.0 Gyr
(Table 4). From these results we derived a surface gravity of log g = 4.26 ± 0.06, in good agreement with the spec-troscopically determined value of log g = 4.22 ± 0.23. We also checked whether the high rotation rate of the star can account for a significant flattening at the poles. According to the equation by Claret (2000) and assuming that the star is seen almost edge-on, the equatorial and polar radii should differ by only ∼ 0.6 %, making the flattening effect negligible.
We computed the interstellar extinction to the star fol-lowing the general guidelines described in Gandolfi et al.
Table 3.Abundances relative to the Sun for five elements in CoRoT-11. The number of spectral lines used in the VWA abundance analysis are given in the last column.
Element [A/H] N Na i −0.10 ± 0.15 2 Si i 0.10 ± 0.09 5 Si ii 0.19 ± 0.18 2 Ca i 0.03 ± 0.12 4 Fe i −0.04 ± 0.08 44 Fe ii −0.02 ± 0.08 6 Ni i −0.08 ± 0.11 8
(2008). The seven BV r′i′JHKs broad-band magnitudes
as retrieved from the ExoDat database enabled us to con-struct the spectral energy distribution (SED) of CoRoT-11, covering a wide spectral range, from optical to near-infrared wavelengths (see Table 1). Simultaneously using all the photospheric colours encompassed by the SED, we derived the interstellar extinction to the star (AV) by
fit-ting the observed SED with a theoretical one progressively reddened with an increasing value of AV. The
theoreti-cal SEDs were computed with the NextGen stellar atmo-sphere model (Hauschildt et al. 1999) with the same Teff,
log g, and [Fe/H] as the star, the response curve of the ExoDat photometric system, and the extinction law by Cardelli et al. (1989). Assuming a total-to-selective extinc-tion RV= AV/EB−V = 3.1 (typical of the diffuse
interstel-lar medium in our Galaxy), as well as a black body emission at the star’s effective temperature and radius, we derived an extinction AV= 0.55 ± 0.10 mag and a distance to the
star d = 560 ± 30 pc (Table 4).
We attempted to derive the rotation period of the star from the CoRoT light curve. The Lomb-Scargle peri-odogram (Scargle 1982) applied to the out-of transit data-points shows only one significant broad peak at about 8.5 ± 2 days, with a light curve amplitude of ∼ 0.25 %. This period is not compatible with the maximum rotation period of 1.73 ± 0.22 days derived from the projected ro-tational velocity and radius of the planet host star. The detected signal at 8.5 ± 2 days might be due to a 0.02 mag periodic variation of the nearby contaminant star located at about 2′′from CoRoT-11 (see Sect. 2.2 and 3.1). On the
other hand, a low-level of magnetic activity of CoRoT-11 might account for no significant signals at . 2.0 days, as confirmed from the absence of emission features in the core of the Ca ii H & K and Balmer lines.
4.2. Planetary parameters of CoRoT-11b
Based on the stellar mass and radius (Sect. 4.1), the RV curve semi-amplitude (Sect. 3.3), the planet-to-star radius ratio, and the planet orbit inclination (Sect. 2.2), we de-rived a mass for CoRoT-11b of Mp= 2.33 ± 0.34 MJup and
a radius of Rp= 1.43 ± 0.03 RJup, yielding a mean
plan-etary density ρp = 0.99 ± 0.15 g/cm3. The planet orbits
its host star at a distance of a = 0.0436 ± 0.005 AU in 2.994339 ± 0.000011 days. The planetary mass has been obtained assuming an eccentricity e = 0. According to the results presented in Sect. 3.3, we cannot exclude a slightly eccentric orbit, with 0 . e . 0.2. Nevertheless, for e = 0.2 the planetary mass would decrease of about 4 %, i.e., well
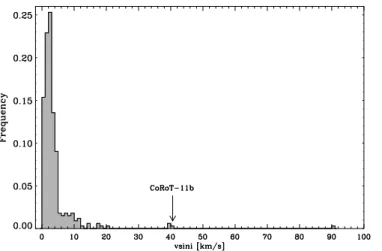
Fig. 11.v sin i⋆ distribution of the known extrasolar
plan-ets. The position of CoRoT-11b is highlighted with an ar-row.
within the error bar of our estimation. A summary of the planetary parameters derived in the present work is re-ported in Table 4.
5. Discussion
Together with 30 Ari Bb (Guenther et al. 2009), OGLE2-TR-L9b (Snellen et al. 2009), and WASP-33b (Collier Cameron et al. 2010) orbiting a F6 V (v sin i⋆= 39 km/s), F3 V (v sin i⋆= 39.3 km/s), and A5 V
star (v sin i⋆ = 90 ± 10 km/s), respectively, CoRoT-11b is
the fourth extrasolar planet discovered around a rapidly rotating main sequence star (v sin i⋆ = 40 ± 5 km/s; see
Fig. 11). Furthermore, the planet host star CoRoT-11, with its effective temperature of Teff = 6440 ± 120 K, is
one of the hottest stars known to harbour an extrasolar planet.
Most of the bulk of known extrasolar planets have been detected with the RV method. Although this technique has dramatically increased the number of discoveries in the last fifteen years, it suffers from a strong selection bias, because it is mostly restricted to planets around slowly rotating stars (v sin i⋆.10 km/s). This observational bias limits our
knowledge of extrasolar planets to mainly late-type solar-like stars. One of the big advantages of the transit method is that it is insensitive to the stellar rotation, enabling us to single out planets even around intermediate-mass stars (Collier Cameron et al. 2010). This allows us to enlarge the parameter space of planet host stars and gives us a chance to study the planet formation around A and F stars. Even if CoRoT-11b has been confirmed and studied thanks to a complementary and intensive RV campaign, it would have likely been rejected from any RV search sample because of the fast rotation of its parent star. Indeed, about 20 RV measurements were needed to assess the planetary nature of CoRoT-11b and constrain its mass within ∼ 15 %. But the RV signature of CoRoT-11b has been detected because of its high mass. Taking into account the accuracy of our RV measurements (100 − 200 m/s), if the mass of CoRoT-11b had been Mp.0.5 MJup, it would not have been detected
by the RV survey.
Fig. 12. Semi-major axis versus planetary mass for the known extrasolar planets detected in radial velocity (trian-gles) and transit surveys (circles). The position of CoRoT-11b is highlighted with an arrow.
According to our planetary mass determinations (Mp=
2.33 ± 0.34), CoRoT-11b is among the most massive tran-siting hot-Jupiters discovered so far. It actually belongs to the poorly populated sub-group of objects with planetary masses around 2 MJup. As already noticed by Torres et al.
(2010), there seems to be a lack of transiting hot-Jupiters with masses larger than about 2 MJup. Based on the list
of currently known transiting planets6, hot-Jupiters with
masses in the range 0.5 .Mp. 1.5 MJup seem to be ∼ 5
times more numerous than those with masses 1.5 .Mp.
2.5 MJup. This trend is also confirmed by the number of
planets discovered with the RV method. In Fig. 12 the semi-major axis of the planets detected in radial velocity and transit surveys is plotted as a function of the planetary mass. Let us consider only the objects with a . 0.1 AU and Mp& 0.2 MJup, i.e., hot-Saturn and Jupiter planets.
There is a clear clump of hot-giant planets with masses between the mass of Saturn (∼ 0.30 MJup) and Jupiter,
or-biting their parent star at about 0.04 − 0.06 AU. Starting from ∼ 1.0 MJup, the number of hot-Jupiters seems to
drop off, whereas the spread in the semi-major axis in-creases. For Mp&2 MJup the number of hot-Jupiters falls
off significantly. The same trend is not seen for planets with 1 . a . 5 AU. The lack of Saturn planets orbiting their parent at such a distance might be owing to an observa-tional bias of the RV technique. Nevertheless, since both the Doppler and transit methods are strongly sensitive in detecting close-in massive planets, we conclude that hot-Jupiters with Mp> 2 MJup are significantly less common
than “normal” hot-Saturn and Jupiter planets.
By assuming that CoRoT-11b is a hydrogen-rich gas gi-ant we estimated the planet’s thermal mass loss by apply-ing the method outlined in detail in Lammer et al. (2009). Because the planet orbits a F6-type star with an age be-tween 1.0 and 3.0 Gyr, we used the soft X-rays and EUV flux scaling law of Eq. 12 of Lammer et al. (2009) and in-tegrated the thermal mass loss during the planet’s history
6 We refer the reader to the Extra Solar Planets Encyclopedia
for a constantly updated list of known extra solar planets (http://exoplanet.eu/).
up to the two age values given above. By using the stel-lar and planetary parameters and a heating efficiency η for hydrogen-rich thermospheres, which can be considered be-tween 10 - 25 % (Lammer et al. 2009; Murray-Clay et al. 2009), we obtained a present time mass loss rate for CoRoT-11b of about 2.0 × 10¹⁰ g/s or an integrated loss of 0.07 %
of its present mass (η = 10 %), and about 5.0 × 10¹⁰ g/s,
or 0.18 % (η = 25 %) if the host star and planet are 1.0 Gyr old. If the the star/planet system is 3.0 Gyr old, we estimated a mass loss rate of about 3.0 × 10⁹ g/s, or
0.1 % (η = 10 %) and about 7.7 × 10⁹ g/s, or 0.25 %
(η = 25 %) during the planet lifetime. These loss rates agree well with hydrodynamic escape model results for typ-ical hot Jupiters (Yelle et al. 2008). Although the planet radius is 1.43 ± 0.03 RJup, the main reason why the
ther-mal mass loss of CoRoT-11b is not significant is related to the large mass of the planet of 2.33 ± 0.34 MJup. According
to Lammer et al. (2009), only hot gas giant planets with ρp<< 1 g/cm3 should experience large thermal mass loss.
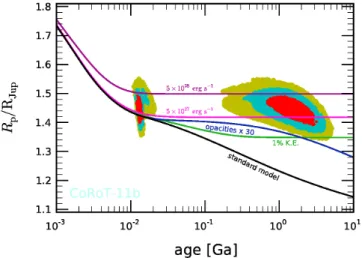
In order to investigate whether a standard model for an irradiated planet can account for the density of CoRoT-11b, we computed stellar and planetary evolution mod-els using CESAM (Morel & Lebreton 2008) and CEPAM (Guillot & Morel 1995), as described in Bord´e et al. (2010) and Guillot & Havel (2010). The results are shown in Fig. 13 where the evolution of the size of CoRoT-11b is plotted as a function of the system age. The colours indicate the distance in standard deviations from the inferred effec-tive temperature and mean stellar density, i.e., less than 1σ (red), 2σ (blue) or 3σ (green). These constraints are compared to planetary evolution models for a homogeneous solar-composition hydrogen-planet, with different hypothe-ses: (1) using a “standard model”, i.e., without additional sources of heat; (2) by increasing interior opacities by a factor 30; (3) by adding a fraction (∼ 1%) of the incoming stellar energy and dissipating it at the centre; (4) and (5) by dissipating 5×1027and 5×1028erg/s at the centre of the
planet. The first three cases correspond to standard recipes used to explain the inflated giant exoplanets (Guillot 2008). The last two cases correspond to higher dissipation levels that are required to explain the planet size for the oldest ages.
Interestingly, as for CoRoT-2b (Guillot & Havel 2010), two classes of solutions are found: (i) the standard solu-tion for which the host star is on the main sequence (with an age of about 2.0 ± 1.0 Gyr) and the planet requires a high level of dissipation in its interior in order to ac-count for its large size; (ii) a very young class of solu-tions in which the star is still on the pre-main sequence (PMS) phase (with an age of about 12 ± 2 Myr) and the planet size can be quite naturally explained with a “stan-dard model”. However, the latter scenario is in contradic-tion with the absence of the detectable Li i λ6708 ˚A line in the spectra of CoRoT-11. According to our effective tem-perature determination (Teff = 6440 ± 120 K), CoRoT-11
would belong to the narrow class of F-stars, which have suffered strong surface lithium depletion during the first billion years of their life. Indeed, studies of the lithium con-tent in the photosphere of F-type stars in galactic clusters and field stars have revealed the presence of a narrow dip in the lithium abundance for effective temperature between 6500 and 6800 K (Mallik et al. 2003; B¨ohm-Vitense 2004). While the so-called “lithium-dip” is absent in the Pleiades (Pilachowski et al. 1987) and in general in all the young
Fig. 13. Evolution of the size of CoRoT-11b (in Jupiter units, 1 RJup = 71 492 km) as a function of the age of
the system (in Ga=109years). The coloured areas
corre-spond to constraints derived from stellar evolutionary mod-els matching the mean stellar density and effective temper-ature within a certain number of standard deviations: less than 1σ (red), 2σ (blue) or 3σ (green). The curves are evo-lutionary tracks for CoRoT-11b computed assuming a plan-etary mass of M = 2.33 MJup and equilibrium temperature
Teq= 1657 K), and using different models as labelled (see
text for more details and the online edition of the Journal for a colour version of this figure).
cluster (. 100 Myr), this dip is well observed in older clus-ter like the Hyades (700 Myr; Boesgaard & Tripicco 1986a), NGC 752 (1.7 Gyr; Hobbs & Pilachowski 1986), as well as in many field F-stars (e.g., Boesgaard & Tripicco 1986b). We thus believe that an age of 2.0 ± 1.0 Gyr is more plau-sible for the planet-star system.
Acknowledgements. We thank the anonymous referee for his/her careful reading, useful comments, and suggestions, which helped to improve the manuscript.
This paper is based on observations carried out at the European Southern Observatory (ESO), La Silla and Paranal (Chile), under ob-serving programs numbers 081.C-0388, 081.C-0413, and 083.C-0186. The authors are grateful to the staff at ESO La Silla and ESO Paranal Observatories for their support and contribution to the success of the HARPS and UVES observing runs.
This paper is also based on observations performed with SOPHIE at the Observatoire de Haute-Provence, France, under observing pro-gram PNP.08A.MOUT.
Part of the data presented herein were obtained at the W.M. Keck Observatory from telescope time allocated to the National Aeronautics and Space Administration through the agency’s scien-tific partnership with the California Institute of Technology and the University of California. The Observatory was made possible by the generous financial support of the W.M. Keck Foundation. The authors wish to recognize and acknowledge the very significant cultural role and reverence that the summit of Mauna Kea has always had within the indigenous Hawaiian community. We are most fortunate to have the opportunity to conduct observations from this mountain.
The team at IAC acknowledges support by grant ESP2007-65480-C02-02 of the Spanish Ministerio de Ciencia e Innovacion. The German CoRoT Team (TLS and the University of Cologne) acknowl-edges DLR grants 50OW0204, 50OW0603, and 50QP07011.
This research has made use of the SIMBAD database, operated at CDS, Strasbourg, France.
Table 4.CoRoT-11b - Planet and star parameters.
Ephemeris
Planet orbital period P [days] 2.994330 ± 0.000011 Planetary transit epoch Ttr[HJD-2 400 000] 54597.6790 ± 0.0003
Planetary transit duration dtr[h] 2.5009 ± 0.0144
Results from radial velocity observations
Orbital eccentricity e 0 (fixed) Radial velocity semi-amplitude K [m/s] 280.0 ± 40.0
O-C residuals [m/s] 88
Fitted transit parameters
Planet-to-star radius ratio k = Rp/R∗ 0.1070 ± 0.0005
Linear limb darkening coefficient u+ 0.61 ± 0.06
Linear limb darkening coefficient u− 0.02 ± 0.04
Orbital phase of planetary transit ingress (θ1) −0.0174 ± 0.0001
Deduced transit parameters
Scaled semi-major axis a/R∗ 6.890 ± 0.080
M∗1/3/R∗[solar units] 0.787 ± 0.010
Mean stellar density ρ∗[g/cm3] 0.69 ± 0.02
Inclination i [deg] 83.170 ± 0.150 Impact parameterab 0.818 ± 0.008
Spectroscopic parameters
Effective temperature Teff [K] 6440 ± 120
Surface gravity log gb[dex] 4.22 ± 0.23
Surface gravity log gc[dex] 4.26 ± 0.06
Metallicity [Fe/H] [dex] −0.03 ± 0.08 Stellar rotational velocity v sin i⋆[km/s] 40.0 ± 5.0
Spectral type F6 Vd
Stellar physical parameters from combined analysis
Star mass M⋆[M⊙] 1.27 ± 0.05
Star radius R⋆[R⊙] 1.37 ± 0.03
Age of the star t [Gyr] 2.0 ± 1.0 Interstellar extinction AV[mag] 0.55 ± 0.10
Distance of the system d [pc] 560 ± 30 Planetary physical parameters from combined analysis
Planet mass Mp[MJ]e 2.33 ± 0.34
Planet radius Rp[RJ]e 1.43 ± 0.03
Planet density ρp[g/cm3] 0.99 ± 0.15
Orbital semi-major axis a [AU] 0.0436 ± 0.005 Equilibrium temperaturefT
eq[K] 1657 ± 55
Notes.
(a)The impact parameter is defined as b =a·cos i
R∗
(b) Derived from the spectroscopic analysis. (c)Derived using the light curve parameter M1/3
∗ /R∗and the stellar mass as inferred from stellar evolutionary models. (d) With an accuracy of ± 1 sub-class.
(e)Radius and mass of Jupiter taken as 71492 km and 1.8986×1030g, respectively. (f ) Zero albedo equilibrium temperature for an isotropic planetary emission.
References
Aigrain, S., Collier Cameron, A., Ollivier, M., et al. 2008, A&A, 488, 43
Aigrain, S., Pont, F., Fressin, F., et al. 2009, A&A, 506, 425 Alonso, R., Auvergne, M., Baglin, A., et al. 2008, A&A, 482, L21 Alonso, R., Guillot, T., Mazeh, T. , et al. 2009, A&A, 501, L23
Alonso, R., Alapini, A., Aigrain, S. et al. 2009, A&A, 506, 353 Anderson, D. R., Hellier, C., Gillon, M., et al. 2010,ApJ709, 159 Auvergne, M., Bodin, P., Boisnard, L., et al. 2009, A&A, 506, 411 Baglin, A., Auvergne, M., Boisnard, L., et al. 2006, 36th COSPAR
Scientific Assembly, 36, 3749 B¨ohm-Vitense E. 2004, AJ, 128, 2435
Barge, P., Baglin, A., Auvergne, M., et al. 2008, A&A, 482, L17 Boesgaard, A. M. & Tripicco, M. J. 1986, ApJ, 302, 49 Boesgaard, A. M. & Tripicco, M. J. 1986, ApJ, 303, 724 Bord´e P., Bouchy F., Deleuil M., et al. 2010, A&A, submitted Borucki, W. J. & Summers, A. L. 1984, Icarus, 58, 121 Borucki, W. J., et al. 2010, ApJ, 713, L126
Bouchy, F., Queloz, D., Deleuil, M., et al. 2008, A&A, 482, L25 Bouchy, F., H´ebrard, G., Udry, S., et al. 2009, A&A, 505, 853 Bowler, B. P., Johnson, J. A., Marcy, G. W., et al. 2010, ApJ, 709,
396
Bruntt, H., Bikmaev, I. F., Catala, C., et al. 2004, A&A, 425, 683 Bruntt, H., De Cat, P. & Aerts, C. 2008, A&A, 478, 487
Bruntt, H. 2009, A&A, 506, 235
Bruntt, H., Deleuil, M., Fridlund M. et al. 2010, eprint arXiv:1005.3208
Cabrera, J., Fridlund, M., Ollivier, M., et al. 2009, A&A506, 501 Collier Cameron, A., G¨unther, E., Smalley, B., et al. 2010, MNRAS,
407, 507
Carpano, S., Cabrera, J., Alonso, R., et al. 2009, A&A506, 491 Cardelli J. A., Clayton G. C. & Mathis J. S. 1989, ApJ345, 245 Carone, L., Gandolfi, D. et al., A&Asubmitted
Claret, A. 2000, A&A, 359, 289
Cox, A.N. 2000, “Allen’s astrophysical quantities”, 4thed., edited by
A.N. Cox, AIP Press
Cresswell, P., Dirksen, G., Kley, W. nad Nelson, R.P. 2007, A&A473, 329
Cutri R. M., Skrutskie M. F., van Dyk S. et al. 2003, 2MASS All-Sky Catalog of Point Sources, NASA/IPAC Infrared Science Archive Deeg, H. J., Gillon, M., Shporer, A., et al. 2009, A&A, 506, 343 Deeg, H. J., Moutou, C., Erikson, A., et al. 2010, Nature, 464, 384 Deleuil, M., Deeg, H. J., Alonso, R., et al. 2008, A&A, 491, 889 Deleuil, M., Meunier, J. C., Moutou, C., et al. 2009, AJ, 138, 649 Eigm¨uller. P. & Eisl¨offel, J. 2009, Transiting Planets, Proceedings of
the International Astronomical Union, IAU Symposium “Trasiting Planet”, 253, 340
Eisl¨offel, J., Hatzes, A. P., Rauer, H., et al. 2007, Solar and Stellar Physics Through Eclipses ASP Conference Series, 370, 91 Endl, M., K¨urster, M., Els, S. 2000, A&A, 362, 585 Frasca A., Alcal´a J.M., Covino E. et al. 2003, A&A405, 149 Fridlund, M., Hebrard, G., Alonso, R., et al. 2010, A&A, 512, A14 Gandolfi, D., Alcal´a, J. M., Leccia, S., et al. 2008, ApJ, 686, 1303 Gaudi, B. S. & Winn J. N 2007, ApJ, 655, 550
Guenther, E. W., Hartmann, M., Esposito, M., et al. 2009, A&A, 507, 1659
Guillot, T. & Morel, P. 1995, A&AS, 109, 109 Guillot, T. 2008, Physica Scripta, 130, 014023 Guillot, T. & Havel, M. 2010, A&A, submitted Gray D. F., PASP, 98, 319
Gray D. F., PASP, 101, 832 Gim´enez, A. 2006, A&A, 450, 1231
Gustafsson, B., Edvardsson, B., Eriksson, K., et al. 2008, A&A, 486, 951
Hauschildt P.H., Allard F. & Baron E. 1999, ApJ, 512, 377 H´ebrard, G., Bouchy, F., Pont, F., et al. 2008, A&A, 481, 52 Hobbs, L. M. & Pilachowski, C. 1986, ApJ, 309, 17
Johnson, J. A., Howard, A. W., Bowler, B. P., et al. 2010, PASP, 122, 701
Kallrath, J. & Milone, E.F. 2009, “Eclipsing Binary Stars: Modeling and Analysis”, Springer-Verlag New York
Koch, D., et al. 2010, ApJ, 713, L79
Kupka, F., Piskunov, N., Ryabchikova, T. A., Stempels, H. C., Weiss, W. W., 1999, A&AS, 138, 119
Lammer, H., Odert, P., Leitzinger, M. et al. 2009, A&A, 506, 399 Lagrange, A.-M., Desort, M., Galland, F., et al. 2009, A&A, 495, 335 L´eger, A., Rouan, D., Schneider, J., et al. 2009, A&A, 506, 287 Lubow, S.H. & Ogilvie, G.I. 2001 ,ApJ 560, 997
Mayor, M., Queloz, D. 1995, Nature, 378, 355
Mayor, M., Pepe, F., Queloz, D., et al. 2003, Msngr., 114, 20 Mallik, Sushma V., Parthasarathy, M. & Pati, A. K. 2003,A&A, 409,
251M
Morel, P. & Lebreton, Y. 2008, Ap&SS, 316, 61
Moutou, C., Bruntt, H., Guillot, T., et al. 2008, A&A, 488, L47 Moutou, C., H´ebrard, G., Bouchy, F., et al. 2009, A&A, 498, L5 Moutou, C., Pont, F., Bouchy, F., et al. 2009, A&A, 506, 321 Murray-Clay, R. A., Chiang, E. I., & Murray, N. 2009, ApJ, 693, 23 O’Toole, S. J., Tinney, C. G., Jones, H. R. A., et al. 2009, MNRAS,
392, 641
Ohta, Y., Taruya, A., and Suto, Y. 2005, ApJ, 622, 1118
Papaloizou, J.C.B. & Terquem, C. 2006, Reports on Progress in Physics, 69, 119
Pepe, F., Mayor, M., Galland, F., et al. 2002, A&A, 388, 632 Pilachowski, C. A., Booth, J. & Hobbs, L. M. 1987, PASP, 99, 1288 Pinheiro da Silva, L., Rolland, G., Lapeyrere, V. and Auvergne, M.
2008, MNRAS, 384, 1337
Pollacco, D., Skillen, I., Collier Cameron, A., et al. 2007, MNRAS, 385, 1576
Pont, F., Endl, M., Cochran, W. D., et al., 2009, MNRAS, 402, 1 Press, W.H., Teukolsky, S.A., Vetterling, W.T. and Flannery, B.P.
1992, “Numerical recipes in C. The art of scientific computing”, Cambridge: University Press, 2ndedition
Queloz, D., Henry, G. W., Sivan, J. P., et al. 2001, A&A, 379, 279 Queloz, D., Bouchy, F., Moutou, C., et al. 2009, A&A, 506, 303 Quentin, C. G., Barge, P., Cautain, R., et al. 2006, in ESA Special
Publication, 1306, 409
Rauer, H., Queloz, D., Csizmadia, S., et al. 2009, A&A, 506, 281 Rosenblatt F. 1971, Icarus, 14, 71
Scargle, J. D. 1982, ApJ, 263, 835
Seager, S., Mall´en-Ornelas, G. 2003, ApJ, 585, 1038
Simpson, E. K., Pollacco, D., H´ebrard, G., et al. 2010, MNRAS, 405, 1867
Sing D.K 2010, ˚a, 510, A21
Snellen, I. A. G., Koppenhoefer, J., van der Burg, R. F. J., et al. 2009, A&A, 497, 545
Surace, C., Alonso, R., Barge, P., et al. 2008, SPIE, 7019, 111 Torres, G., Bakos, G. ´A., Hartman, J. et al. 2010, ApJ, 715, 458 Valenti, J. A. & Piskunov, N., 1996, A&AS, 118, 595
Valenti, J. A. & Fischer, D. A., 2005, ApJS, 159, 141
Vogt, S.S., Allen, S.L. & Bigelow, B.C., et al. 1994, SPIE, 2198, 362 Winn J. N. 2010, eprint arXiv:1001.2010
Yelle, R., Lammer, H. & Ip, W.-H. 2008, Space Sci. Rev., 139, 437
List of Objects
‘CoRoT-11b’ on page 2 ‘CoRoT-11’ on page 2 ‘HR 5777’ on page 6 ‘30 Ari Bb’ on page 11 ‘OGLE2-TR-L9b’ on page 11 ‘WASP-33b’ on page 11 ‘Pleiades’ on page 12 ‘Hyades’ on page 12 ‘NGC 752’ on page 121 Th¨uringer Landessternwarte, Sternwarte 5, Tautenburg,
D-07778 Tautenburg, Germany
2 Research and Scientific Support Department, ESTEC/ESA,
PO Box 299, 2200 AG Noordwijk, The Netherlands
3 Institut d’Astrophysique de Paris, UMR7095 CNRS,
Universit´e Pierre & Marie Curie, 98bis boulevard Arago, 75014 Paris, France
4 Observatoire de l’Universit´e de Gen`eve, 51 chemin des
Maillettes, 1290 Sauverny, Switzerland
5 Laboratoire d’Astrophysique de Marseille, 38 rue Fr´ed´eric
Joliot-Curie, 13388 Marseille cedex 13, France
6 McDonald Observatory, University of Texas at Austin,
Austin, TX 78712, USA
7 Institute of Planetary Research, German Aerospace Center,
Rutherfordstrasse 2, 12489 Berlin, Germany
8 Universit´e de Nice-Sophia Antipolis, CNRS UMR 6202,
Observatoire de la Cˆote d’Azur, BP 4229, 06304 Nice Cedex 4, France
9 Oxford Astrophyiscs, Denys Wilkinson Building, Keble
Road, Oxford OX1 3RH
10 LESIA, Observatoire de Paris, Place Jules Janssen, 92195
Meudon cedex, France
11 Institut d’Astrophysique Spatiale, Universit´e Paris XI,
F-91405 Orsay, France
12 Observatoire de Haute Provence, 04670 Saint Michel
l’Observatoire, France
13 LUTH, Observatoire de Paris, CNRS, Universit´e Paris
Diderot; 5 place Jules Janssen, 92195 Meudon, France
14 Rheinisches Institut f¨ur Umweltforschung an der Universit¨at
zu K¨oln, Aachener Strasse 209, 50931, Germany
15 Instituto de Astrof´ısica de Canarias, E-38205 La Laguna,
Tenerife, Spain
16 University of Vienna, Institute of Astronomy,
T¨urkenschanzstr. 17, A-1180 Vienna, Austria
17 IAG, University of S˜ao Paulo, Brasil
18 University of Li`ege, All´ee du 6 aoˆut 17, Sart Tilman, Li`ege
1, Belgium
19 European Southern Observatory, Alonso de Crdova 3107,
Casilla 19001, Santiago de Chile, Chile
20 Space Research Institute, Austrian Academy of Science,
Schmiedlstr. 6, A-8042 Graz, Austria
21 School of Physics and Astronomy, Raymond and Beverly
Sackler Faculty of Exact Sciences, Tel Aviv University, Tel Aviv, Israel
22 Center for Astronomy and Astrophysics, TU Berlin,
Hardenbergstr. 36, 10623 Berlin, Germany
23 Dpto. de Astrof´ısica, Universidad de La Laguna, 38206 La
Laguna, Tenerife, Spain
24 Laboratoire d’Astronomie de Lille, Universit´e de Lille 1, 1
impasse de l’Observatoire, 59000 Lille, France
25 Institut de M´ecanique C´eleste et de Calcul des Eph´em´erides,
UMR 8028 du CNRS, 77 avenue Denfert-Rochereau, 75014 Paris, France