Canonical correlation analysis applied to selection index methodology in
quails
André Marubayashi Hidalgoa,b,*, Luciano Pinheiro da Silvac, Rodrigo Reis Motad and Elias
Nunes Martinse
a Animal Breeding and Genomics Centre, Wageningen University, 6708WD, Wageningen,
the Netherlands.
b Department of Animal Breeding and Genetics, Swedish University of Agricultural Sciences,
75651, Uppsala, Sweden
c Departamento de Zootecnia, Universidade Federal do Ceará, 60356-901, Fortaleza, Brazil. d Departamento de Zootecnia, Universidade Federal de Viçosa, 36570-900, Viçosa, Brazil. e Universidade Tecnológica Federal do Paraná, 85660-000, Dois Vizinhos, Brazil.
*Corresponding author:
Tel.: +46 18671933.
E-mail addresses: [email protected], [email protected].
Postal Address: Department of Animal Breeding and Genetics, Swedish University of Agricultural Sciences, Gerda Nilssons Väg 2, 75651, Uppsala, Sweden
1 2 3 4 5 6 7 8 9 10 11 12 13 14 15 16 17 18 19 20 21 22 23 24 25
Abstract - Genetic evaluations in dual-purpose quails (Coturnix coturnix) have demonstrated
that genetic progress not only depends on a specific trait, but on several. The most common technique to use all this information is the selection index. Another alternative may be the canonical-correlation analysis applied to selection index. There is, however, a lack of studies using canonical correlation in quails. Hence, the objectives of this study were to apply canonical-correlation analysis to estimate the relationship of nine traits and to compare genetic gains obtained by this methodology to desired-gain selection index in three lines of quails.
Data for three lines of layer quails consisted of body weight at 28 days (W28), egg weight (EW), age at first egg (AFE) and egg production at 30, 60, 90, 120, 150 and 180 days after onset of lay. Two sets of traits were established: the first one contained predictor variables (W28, EW and AFE) and the second one contained variables related to egg production. A selection index was constructed using the standardized coefficients of canonical covariates as weighting factors when a given canonical correlation was significant. We constructed two desired-gain selection indices: DG-SI1and DG-SI2. The difference between them is that DG-SI2 had a desired gain for body weight set to 0.
The estimated canonical correlations were: 0.811, 0.058 and 0.003 for the yellow, 0.821, 0.181 and 0.076 for the red, and 0.825, 0.117 and 0.038 for the blue line. Only the first pair of canonical variates was significant (P<0.05). AFE and early stages of egg production were very influent and showed great importance in defining the canonical variates and, consequently, the estimated canonical correlations. All lines had, in general, similar results for the canonical analysis indicating that traits that drive management decisions in these lines would be the same. The indices under study showed differences in response to selection; however, they generally resulted in consistent favorable genetic gains. For all lines, the canonical selection index resulted in the lowest AFE and highest egg production at 30 days.
26 27 28 29 30 31 32 33 34 35 36 37 38 39 40 41 42 43 44 45 46 47 48 49 50
The DG-SI1 showed the highest genetic gains for W28 in all lines. There was a general lower genetic gain of other traits for DG-SI1 at the expense of the desired genetic gain for W28.
Selection for AFE, according to the canonical correlation analysis, would have a great impact on the number of eggs produced. Canonical selection index was a good alternative for a desired-gain selection index.
Keywords: Coturnix coturnix japonica, Genetic gain, Multivariate analysis.
51 52 53 54 55 56 57 58 59 60 61 62 63 64 65 66 67 68 69 70 71 72 73 74 75 76
1.
Introduction
Over the years, genetic evaluations in dual-purpose quails (Coturnix coturnix) have demonstrated that genetic progress not only depends on a specific trait, but on several economic traits, such as age at first egg, body weight, egg mass and egg production (Hidalgo
et al., 2011; Ribeiro et al., 2012; Silva et al., 2013). Therefore, to increase genetic progress,
records of all economic traits become necessary to understand them and how they related to each other.
The most common technique used to apply multi-trait selection is the selection index. In the selection index, all economically important traits are combined into an index, which is based on economic weights or desired gains, resulting in selection without considerable loss in any of the traits (Smith, 1936; Hazel, 1943; Pešek and Baker, 1969). This procedure, however, has some limitations clearly recognized on the difficulty to establish economic weights for the traits or to set the desired gains. Nonetheless, selection index is still widely used because, in general, it provides larger total genetic gains (Shahin et al., 2000; Martins et
al., 2003; Nath et al., 2011).
Another feasible alternative may be the canonical-correlation analysis applied to a selection index. Canonical-correlation analysis is a multivariate technique that measures interrelationships between dependent and independent sets of variables, and estimates the maximum correlation and the common portion of variance between them by linear combination (Akbaş and Takma, 2005; Ventura et al., 2011).
A substantial number of studies have been reported in different areas of interest using canonical correlation in animal breeding for different species, such as pigs (Flores et al., 1988; Ventura et al., 2011), beef cattle (Piedrafita et al., 2003), dairy cattle (Meyer et al., 1989) and poultry (Akbaş and Takma, 2005; Yang et al., 2006; Mendeş and Akkartal, 2007; Cankaya et al., 2008). There is, however, a lack of studies using canonical correlation in
77 78 79 80 81 82 83 84 85 86 87 88 89 90 91 92 93 94 95 96 97 98 99 100 101
quails. Hence, the objectives of this study were to apply canonical-correlation analysis to estimate the relationship of nine traits and to compare genetic gains obtained by this methodology to desired-gain selection index in three lines of quails.
2.
Material and Methods
2.1. Data
Data were collected from September 2007 through April 2008 in the quail sector of the Fazenda Experimental de Iguatemi – Universidade Estadual de Maringá. Data for three lines (yellow, red and blue) of layer quails consisted of body weight at 28 days (W28), egg weight (EW), age at first egg (AFE) and egg production at 30 (P30), 60 (P60), 90 (P90), 120 (P120), 150 (P150) and 180 (P180) days after onset of lay (Table 1). Egg weight consisted of a mean egg weight (g) of two weights: the first at 70 days and the second at 120 days of age.
2.2. Statistical analyses
The following multi-trait animal model was applied fitting all nine traits for each line:
Y =μ+a+e
where Y is a vector of observations of the recorded traits, μ is the overall mean, a is a random additive genetic effect of each individual and e is the random error associated with the
Y vector. There is no fixed effect because all animals were females born on the same day and
raised under the same conditions, i.e. same housing, feed and management.
Variance components and genetic parameters were estimated via restricted maximum likelihood (REML) using the software DMU (Madsen and Jensen, 2010). The genetic correlations were used to calculate the canonical correlation. Canonical correlation analysis was used to identify and quantify the relationship between two sets of traits by using PROC CANCORR procedure of SAS 9.0 (2002).
Canonical correlation analysis is based on correlation between a linear combination of a set of variables (Xi) and a linear combination of another set of variables (Wi). Linear
102 103 104 105 106 107 108 109 110 111 112 113 114 115 116 117 118 119 120 121 122 123 124 125 126
combinations of variables are very useful for comparison and prediction (Johnson and Wichern, 1986). Thus, linear combinations of sets of variables can be defined as:
1 11 1 12 2 ... 1p p
U a X a X a X
1 11 1 12 2 ... 1q q
V b W b W b W
canonical variates U1 and V1 form the first pair of canonical variates which is associated to the first canonical correlation, as:
1 1 1 1 1 ˆ ( , ) ˆ ( ). ˆ ( ) Cov U V r Var U Var V .
The percentage of variance explained by the first canonical variates UX2iand 2 i W V is: 2 1 2 i p ij j X a U p
and 2 1 2 i q ij j W b V q
where p and q are numbers of variables of X and W, respectively.
Two sets of traits were established: the first one contained predictor variables (W28, EW and AFE) and the second one contained variables related to egg production (P30, P60, P90, P120, P150 and P180).
2.3. Selection indices
Desired-gain selection index (Pešek and Baker, 1969) was used to compute the genetic gain. We constructed two desired-gain selection indices: DG-SI1 - economic weights to construct the selection index were set to one genetic standard deviation (Crosbie et al., 1980), DG-SI2 - similar to the previous selection index except W28 desired gain was set to 0. These two indices were constructed considering that the lines under study are breed for egg production, therefore, one may argue whether it is better to select for low body weight or for no change in it. Thereafter, we applied these desired-gain selection indices to the individuals of each line, yielding scores for each individual enabling the selection of the best ones.
127 128 129 130 131 132 133 134 135 136 137 138 139 140 141 142 143 144 145 146 147 148
A selection index was constructed using the standardized coefficients of canonical covariates as weighting factors when a given canonical correlation was significant (P < 0.05). Subsequently, we applied this canonical selection index (Can-Index) to the individuals of each line, yielding scores for each individual enabling the selection of the best ones.
The next step was to calculate the genetic gains for both selection indices (desired-gain and canonical) using the well-known breeder’s equation:
ΔG=h2ΔS
where ΔG is the genetic gain, h2 is the heritability of the trait and ΔS is the
selection differential. ΔS was calculated by selection of top 10% animals based on the selection index under study.
Finally, correlations between the rankings of the animals using different selection indices were calculated by Spearman’s rank correlation coefficient for the three lines under study.
3. Results and Discussion
Canonical correlations between economically important traits were estimated in quails. From this analysis, the standardized canonical coefficients were used to construct a selection index which was compared to the two desired-gain selection indices to determine which of them yields higher genetic gains.
3.1. Canonical-correlation analysis
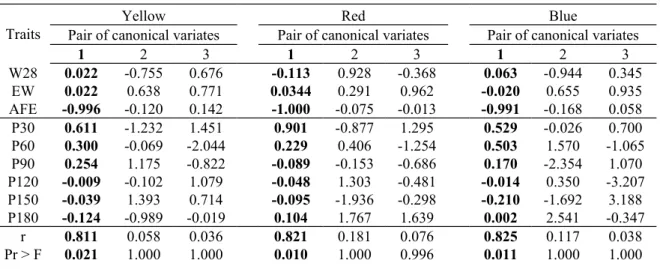
The estimated canonical correlations between the two sets of variables (U1 and V1) were the highest for the first pair of canonical variates whereas was not significant for the second and third pairs (P<0.05; Table 2). The estimated canonical correlations were: 0.811, 0.058 and 0.003 for the yellow, 0.821, 0.181 and 0.076 for the red, and 0.825, 0.117 and 0.038 for the blue line. Henceforth only the first pair of canonical variates will be considered on the next steps of the study as it was significant. Greater values for the first pair of
149 150 151 152 153 154 155 156 157 158 159 160 161 162 163 164 165 166 167 168 169 170 171 172 173
canonical variates were observed in all lines because these values are always equal or greater than any simple or multiple correlation coefficients among traits of the first and second set of variables (Cruz et al., 2004).
The high values of squared canonical correlations (r2)indicate that the two sets of
variables are highly correlated in all lines tested revealing an association between these variates (Table 2). Values of the estimated canonical correlations between the two sets of variables found in our study were similar to those found by Akbaş and Takma (2005), who reported canonical correlations of 0.813 for the first pair of canonical variates and 0.152 for the second. They performed canonical correlation analysis between egg production traits and body weight, egg weight and age at first egg in chicken laying hens. In our study, the first set of variates was largely influenced by AFE over the other traits analysed. This result agrees with recent studies; to increase egg production in laying quails, a first step should be to select for early AFE and/or high egg production in early stages of laying (Hidalgo et al., 2011; Ribeiro et al., 2012). These results may be biased by the short period of egg production recording (180 days max), which may lead to support the idea that precocious quails are more productive, no matter how long the laying period is. Persistence of egg laying, however, might be a new subject on breeding of laying quails, just as it is currently observed in laying hens (Wolc and Szwaczkowski, 2009) and female broiler lines (Farzin et al., 2013).
Values of the standardized canonical coefficients or canonical weights of the variables
X and W represent their relative contribution to the corresponding canonical variate (Akbaş
and Takma, 2005). AFE had a negative and high standard canonical coefficient for the canonical variate U1 for the three lines under study; whereas P30 had a positive and high standard canonical coefficient for the canonical variate V1 for the yellow and red lines (Table 2). For the blue line, however, P60 and P30 were similarly important to the canonical variate
V1 (P30 = 0.529, P60 = 0.503). For the canonical variate that contained W28, EW and AFE,
174 175 176 177 178 179 180 181 182 183 184 185 186 187 188 189 190 191 192 193 194 195 196 197 198
standard canonical coefficients found by Akbaş and Takma (2005) also showed high contribution of AFE to the canonical variate whereas body and egg weight had a low contribution. Whereas, for the canonical variate that contained egg production, we found high canonical coefficients for the initial stage of egg production (P30 and P60) while a high contribution of egg production was found in their study throughout the whole productive period. The high correlation among the two sets of variables might be due to the high canonical loadings of AFE in U1 and of P30 and P60 in V1 showing that these indices are highly influenced by the reduction of AFE and high initial egg production.
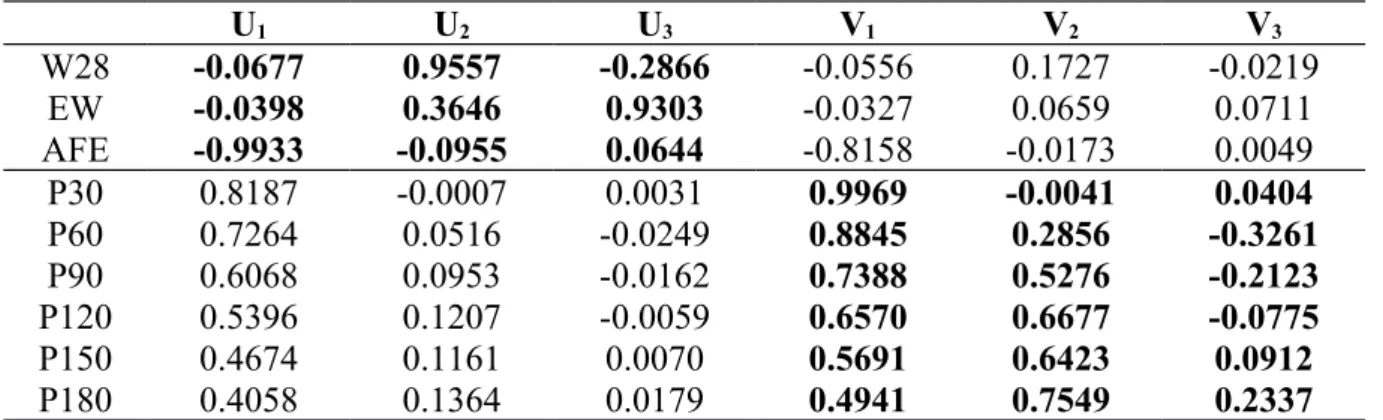
Canonical loadings indicate the correlation between the variables and their respective canonical variate, whereas canonical cross loadings indicate the correlation between the variables and the opposite canonical variate. The loadings of the canonical variate U1, for all lines, suggest that AFE is the most important variable whereas W28 and EW have minor roles in forming this canonical variate (Tables 3, 4, 5). The loadings of the canonical variate V1, for all lines, suggest that early stages of egg production have more importance in defining this canonical variate and it decreases as it gets to later stages of egg production (Tables 3, 4, 5). Body weight had low influence on the sexual maturity and egg production in the indices under study. For the yellow and blue lines, W28 had a positive correlation with U1 and V1, whereas for the red line W28 had a negative correlation. These results agree with Reddish et al. (2003), who reported positive and negative correlations depending on the studied lines between body weight and carcass traits versus age at sexual maturity. Regarding egg production, Silva et al. (2013) studying two lines of meat-type quails also found positive and negative correlations between body weight from hatch to seven-week old and total egg number (365 days).
Canonical cross loadings of canonical variates U1 and V1 showed a similar behavior from their canonical loadings, in which AFE is very influent, W28 and EW have minor roles,
199 200 201 202 203 204 205 206 207 208 209 210 211 212 213 214 215 216 217 218 219 220 221 222 223
and early stages of egg production have more importance than later stages (Tables 3, 4, 5). The sign of canonical cross loadings indicates that a lower AFE will positively affect egg production.
In sum, AFE and early stages of egg production (P30 and P60) were very influent and showed great importance in defining the canonical variates and, consequently, the estimated canonical correlations. All lines had, in general, similar values for estimated canonical correlations, standardized canonical coefficients, loadings and cross loadings indicating that traits that drive management decisions in these lines would be the same.
3.2. Selection indices
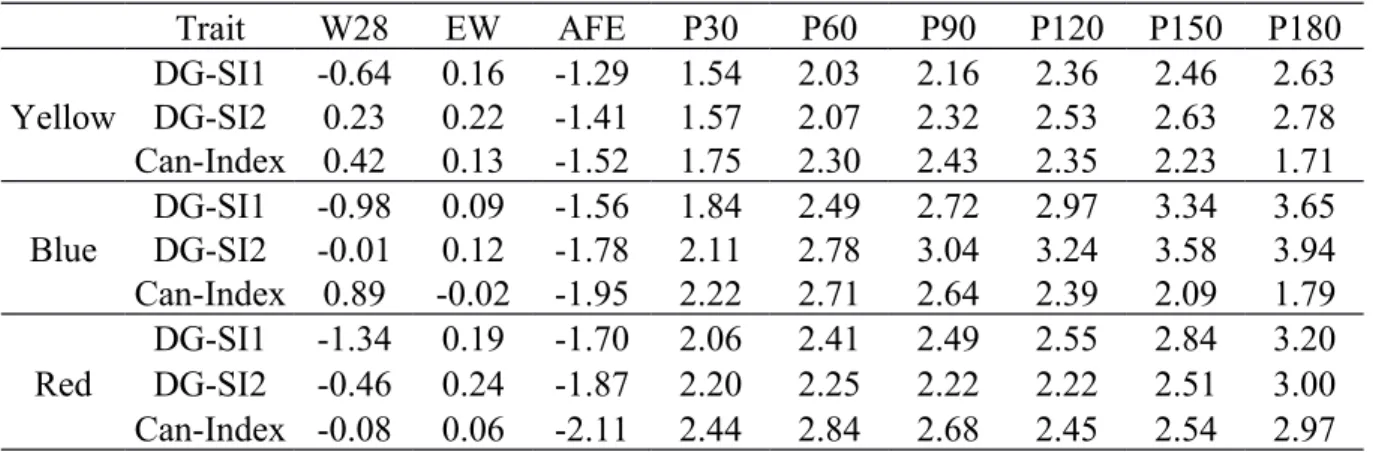
A canonical selection index was constructed and compared to desired-gain selection indices to determine which of them yields higher genetic gains (Table 6). The indices under study showed differences in response to selection; however, they generally resulted in consistent favorable genetic gains. For all lines, the Can-Index resulted in the lowest AFE and highest P30 showing that great weight was given to these traits in the canonical correlation analysis. The DG-SI1 showed the highest genetic gains for W28 in all lines because it was set to have a desired gain of one genetic standard deviation. There was a general lower genetic gain of other traits for DG-SI1 at the expense of the desired genetic gain for W28. DG-SI2 showed the highest genetic gains for EW and some stages of egg production for the yellow and blue line. Martins et al. (2003) studying multivariate criteria in the selection of
Eucalyptus grandis found that canonical variables did not distributed the genetic gains
accordingly the purpose of the study. These gains, however, for some traits were expressive and in the desired direction.
Spearman’s rank correlation coefficients between the Can-Index and the two DG-SIs for the three lines under study were calculated. These correlations showed solid agreement between the indices (Table 7). This agreement indicates that there was low re-ranking of
224 225 226 227 228 229 230 231 232 233 234 235 236 237 238 239 240 241 242 243 244 245 246 247 248
animals selected to be parents of the next generation using the canonical and the desired-gain selection indices. In general, Index and DG-SI2 had higher rank correlation than Can-Index and DG-SI1. This can be explained by the low influence of W28 in the Can-Can-Index and DG-SI2, whereas a desired gain of one genetic standard deviation was set for DG-SI1.
Economic importance of traits, such as egg weight or body weight must be investigated so that selection decisions can be correctly taken. For example, heavier animals have higher economic value at slaughter when discarded, but in most of the current production systems this benefit is not seek because it implies high maintenance costs due to low feed conversion ratio. Egg weight is another trait of importance in a selection index because if the egg is marketed per unit and not by weight, the egg number can be greatly improved by selection. This will occur because the indices would have one less parameter that is negatively correlated to egg production. Thus, the response in egg weight for selection using the Can-Index will depend on the genetic correlations in the quail line.
4. Conclusions
Selection for AFE, according to the canonical correlation analysis, would have a great impact on the number of eggs produced. Canonical selection index was a good alternative for a desired-gain selection index, however further studies regarding economical weight of the traits need to be carried on.
Acknowledgments
We thank the Departmento de Zootecnia - Universidade Estadual de Maringá for providing the data for the study. The first author benefited from a joint grant from the European Commission and TOPIGS Research Center IPG within the framework of the Erasmus-Mundus joint doctorate “EGS-ABG”.
249 250 251 252 253 254 255 256 257 258 259 260 261 262 263 264 265 266 267 268 269 270 271 272 273
References
Akbaş, Y., Takma, Ç., 2005. Canonical correlation analysis for studying the relationship between egg production traits and body weight, egg weight and age at sexual maturity in layers. Czech J. Anim. Sci. 50, 163–168.
Cankaya, S., Ocak, N., Sungu, M., 2008. Canonical correlation analysis for estimation of relationships between sexual maturity and egg production traits upon availability of nutrients in pullets. Asian-Australasian J. Anim. Sci. 21, 1576–1584.
Crosbie, T.M., Mock, J.J., Smith, O.S., 1980. Comparison of gains predicted by several selection methods for cold tolerance traits of two maize populations. Crop Sci. 20, 649– 655.
Cruz, C.D., Regazzi, A.J., Carneiro, P.C.S., 2004. Modelos biométricos aplicados ao melhoramento genético.
Farzin, N., Vaez Torshizi, R., Gerami, A., Seraj, A., 2013. Estimates of genetic parameters for monthly egg production in a commercial female broiler line using random regression models. Livest. Sci. 153, 33–38.
Flores, J., Biron, C., Izquierdo, L., Nieto, P., 1988. Characterization of green hams from Iberian pigs by fast analysis of subcutaneous fat. Meat Sci. 23, 253–262.
Hazel, L.N., 1943. The genetic basis for constructing selection indexes. Genetics 28, 476– 490.
Hidalgo, A.M., Martins, E.N., Santos, A.L. dos, Quadros, T.C.O. De, Ton, A.P.S., Teixeira, R., 2011. Genetic characterization of egg weight, egg production and age at first egg in quails. Rev. Bras. Zootec. 40, 95–99.
Johnson, R.A., Wichern, D.W., 1986. Applied multivariate statistical analysis.
Madsen, P., Jensen, J., 2010. A user’s guide to DMU: a package for analysing multivariate mixed models, version 6, release 5.0. 1–32.
Martins, I.S., Cruz, C.D., Regazzi, A.J., Pires, I.E., Martins, R. de C. de C., 2003. Avaliação de critérios multivariados aplicados na seleção em Eucalyptus grandis Hill ex Maiden. Floresta E Ambient. 38–47.
Mendeş, M., Akkartal, E., 2007. Canonical correlation analysis for studying the relationships between pre- and post slaughter traits of Ross 308 broiler chickens. Arch. Geflügelk 71, 267–271.
Meyer, K., Graser, H.-U., Hammond, K., 1989. Estimates of genetic parameters for first lactation test day production of Australian black and white cows. Livest. Prod. Sci. 21, 177–199. 274 275 276 277 278 279 280 281 282 283 284 285 286 287 288 289 290 291 292 293 294 295 296 297 298 299 300 301 302 303 304 305 306 307
Nath, D.N., Sheriff, F.R., Prabakaran, R., Rajini, R.A., 2011. Response to short term index selection for economic traits in meat type Japanese quail. J. Indian Vet. Assoc. 9, 10–14. Pešek, J., Baker, R.J., 1969. Desired improvement in relation to selection indices. Can. J.
Plant Sci. 49, 803–804.
Piedrafita, J., Quintanilla, R., Sañudo, C., Olleta, J.-L., Campo, M.-M., Panea, B., Renand, G., Turin, F., Jabet, S., Osoro, K., Oliván, M-C., Noval, G., García, P., García, M-D., Oliver, M-A., Gispert, M., Serra, X., Espejo, M., García, S., López, M., Izquierdo, M., 2003. Carcass quality of 10 beef cattle breeds of the Southwest of Europe in their typical production systems. Livest. Prod. Sci. 82, 1–13.
Reddish, J.M., Nestor, K.E., Lilburn, M.S., 2003. Effect of selection for growth on onset of sexual maturity in randombred and growth-selected lines of Japanese quail. Poult. Sci. 82, 187–191.
Ribeiro, J.C., Silva, L.P. da, Sousa, M.F., Leite, C.D.S., Bonafé, C.M., Caetano, G. da C., Crispim, A.C., Torres, R.D.A., 2012. Genetic evaluation for egg mass in partial periods and complete period in meat quails. Rev. Bras. Zootec. 41, 1158–1162.
Shahin, K.A., Shemeis, A.R., Abdallah, O.Y., Saleh, K., 2000. Selection index alternatives for increased marketing body weight with minimum concomitant reduction in body bone percentage-recourse to tissue dissection on Japanese quail. Arch. Tierzucht 43, 535–543. Silva, L.P., Ribeiro, J.C., Crispim, A.C., Silva, F.G., Bonafé, C.M., Silva, F.F., Torres, R.A.,
2013. Genetic parameters of body weight and egg traits in meat-type quail. Livest. Sci. 153, 27–32.
Smith, H.F., 1936. A discrimant function for plant selection. Ann. Eugen. 7, 240–250.
Ventura, H.T., Lopes, P.S., Peloso, J. V, Guimarães, S.E.F., Carneiro, A.P.S., Carneiro, P.L.S., 2011. A canonical correlation analysis of the association between carcass and ham traits in pigs used to produce dry-cured ham. Genet. Mol. Biol. 34, 451–455.
Wolc, A., Szwaczkowski, T., 2009. Estimation of genetic parameters for monthly egg production in laying hens based on random regression models. J. Appl. Genet. 50, 41–46. Yang, Y., Mekki, D.M., Lv, S.J., Yu, J.H., Wang, L.Y., Wang, J.Y., Xie, K.Z., Dai, G.J.,
2006. Canonical correlation analysis of body weight, body measurement and carcass characteristics of Jinghai Yellow chicken. J. Anim. Vet. Adv. 5, 980–984.
SAS Institute Inc., 2002. SAS/STAT User’s Guide: Version 9.0.
308 309 310 311 312 313 314 315 316 317 318 319 320 321 322 323 324 325 326 327 328 329 330 331 332 333 334 335 336 337 338 339 340 341 342
Tables
Table 1. Descriptive statistics of traits under study for all quail lines
Line Trait N Mean SD
Yellow W28 224 92,51 7,88 EW 175 10,47 0,78 AFE 170 48,59 9,40 P30 170 14,72 7,87 P60 170 40,07 12,22 P90 170 67,24 13,93 P120 170 94,81 16,54 P150 170 122,69 19,06 P180 170 150,02 21,80 Red W28 80 116,39 9,74 EW 71 10,96 1,09 AFE 60 52,48 10,12 P30 60 13,23 8,90 P60 60 36,72 12,25 P90 60 62,65 13,63 P120 60 90,18 15,32 P150 60 116,97 18,05 P180 60 143,3 20,54 Blue W28 151 98,83 8,21 EW 144 10,86 0,75 AFE 134 51,66 10,82 P30 134 14,13 9,03 P60 134 38,31 13,23 P90 134 64,57 14,30 P120 134 92,24 15,59 P150 134 119,20 17,70 P180 134 146,02 20,47
W28 - Body weight at 28 days (g), EW – Egg weight (g), AFE – Age at first egg (days), P30 - Egg production at 30 days, P60 - Egg production at 60 days, P90 - Egg production at 90 days, P120 - Egg production at 120 days, P150 - Egg production at 150 days, P180 - Egg production at 180 days, N – Number of animals, SD – Standard deviation
Table 2. Standardized canonical coefficients of variates, canonical correlations between two
sets of variables (r), squared canonical correlation (r2) and their probabilities (F).
Traits
Yellow Red Blue
Pair of canonical variates Pair of canonical variates Pair of canonical variates
1 2 3 1 2 3 1 2 3 W28 0.022 -0.755 0.676 -0.113 0.928 -0.368 0.063 -0.944 0.345 EW 0.022 0.638 0.771 0.0344 0.291 0.962 -0.020 0.655 0.935 AFE -0.996 -0.120 0.142 -1.000 -0.075 -0.013 -0.991 -0.168 0.058 P30 0.611 -1.232 1.451 0.901 -0.877 1.295 0.529 -0.026 0.700 P60 0.300 -0.069 -2.044 0.229 0.406 -1.254 0.503 1.570 -1.065 P90 0.254 1.175 -0.822 -0.089 -0.153 -0.686 0.170 -2.354 1.070 P120 -0.009 -0.102 1.079 -0.048 1.303 -0.481 -0.014 0.350 -3.207 P150 -0.039 1.393 0.714 -0.095 -1.936 -0.298 -0.210 -1.692 3.188 P180 -0.124 -0.989 -0.019 0.104 1.767 1.639 0.002 2.541 -0.347 r 0.811 0.058 0.036 0.821 0.181 0.076 0.825 0.117 0.038 Pr > F 0.021 1.000 1.000 0.010 1.000 0.996 0.011 1.000 1.000 343 344 345 346 347 348 349 350
r² 0.658 0.003 0.001 0.675 0.033 0.006 0.681 0.014 0.001
W28 - Body weight at 28 days (g), EW – Egg weight (g), AFE – Age at first egg (days), P30 - Egg production at 30 days, P60 - Egg production at 60 days, P90 - Egg production at 90 days, P120 - Egg production at 120 days, P150 - Egg production at 150 days, P180 - Egg production at 180 days
Table 3. Correlations between the variables and related canonical variates (canonical loadings) and between the variables and the other set of canonical variates (canonical cross
loadings) for the Yellow line.
U1 U2 U3 V1 V2 V3 W28 0.1805 -0.7610 0.6237 0.1465 -0.0442 0.0222 EW 0.0251 0.6671 0.7446 0.0204 0.0387 0.0265 AFE -0.9995 -0.0020 0.0307 -0.8110 -0.0001 0.0011 P30 0.7935 -0.0084 0.0052 0.9779 -0.1450 0.1459 P60 0.7626 0.0127 -0.0057 0.9398 0.2182 -0.1590 P90 0.6870 0.0291 0.0029 0.8467 0.5007 0.0804 P120 0.5790 0.0334 0.0097 0.7136 0.5754 0.2735 P150 0.4971 0.0373 0.0120 0.6127 0.6418 0.3371 P180 0.4152 0.0345 0.0132 0.5118 0.5938 0.3717
U1, U2, U3 – Canonical variate containing W28, EW and AFE, V1, V2, V3 - Canonical variate containing P30, P60, P90, P120, P150 and
P180, W28 - Body weight at 28 days (g), EW – Egg weight (g), AFE – Age at first egg (days), P30 - Egg production at 30 days, P60 - Egg production at 60 days, P90 - Egg production at 90 days, P120 - Egg production at 120 days, P150 - Egg production at 150 days, P180 - Egg production at 180 days
Table 4. Correlations between the variables and related canonical variates (canonical loadings) and between the variables and the other set of canonical variates (canonical cross
loadings) for the Red line.
U1 U2 U3 V1 V2 V3 W28 -0.0677 0.9557 -0.2866 -0.0556 0.1727 -0.0219 EW -0.0398 0.3646 0.9303 -0.0327 0.0659 0.0711 AFE -0.9933 -0.0955 0.0644 -0.8158 -0.0173 0.0049 P30 0.8187 -0.0007 0.0031 0.9969 -0.0041 0.0404 P60 0.7264 0.0516 -0.0249 0.8845 0.2856 -0.3261 P90 0.6068 0.0953 -0.0162 0.7388 0.5276 -0.2123 P120 0.5396 0.1207 -0.0059 0.6570 0.6677 -0.0775 P150 0.4674 0.1161 0.0070 0.5691 0.6423 0.0912 P180 0.4058 0.1364 0.0179 0.4941 0.7549 0.2337
U1, U2, U3 – Canonical variate containing W28, EW and AFE, V1, V2, V3 - Canonical variate containing P30, P60, P90, P120, P150 and
P180, W28 - Body weight at 28 days (g), EW – Egg weight (g), AFE – Age at first egg (days), P30 - Egg production at 30 days, P60 - Egg production at 60 days, P90 - Egg production at 90 days, P120 - Egg production at 120 days, P150 - Egg production at 150 days, P180 - Egg production at 180 days
Table 5. Correlations between the variables and related canonical variates (canonical loadings) and between the variables and the other set of canonical variates (canonical cross
loadings) for the blue line.
U1 U2 U3 V1 V2 V3 W28 0.1761 -0.9191 0.3524 0.1453 -0.1077 0.0135 EW -0.0034 0.3433 0.9392 -0.0028 0.0402 0.0360 AFE -0.9979 -0.0653 0.0039 -0.8233 -0.0076 0.0001 P30 0.8050 0.0015 0.004 0.9757 0.0130 0.1032 P60 0.7960 0.0094 0.0003 0.9648 0.0800 0.0079 351 352 353 354 355 356 357 358 359 360 361 362 363 364 365 366 367 368 369 370 371 372 373
P90 0.7213 -0.0081 0.0068 0.8742 -0.0691 0.1786
P120 0.6507 0.0091 0.0053 0.7887 0.0779 0.1383
P150 0.5519 0.0195 0.0160 0.6689 0.1668 0.4186
P180 0.4626 0.0446 0.0161 0.5607 0.3806 0.4214
U1, U2, U3 – Canonical variate containing W28, EW and AFE, V1, V2, V3 - Canonical variate containing P30, P60, P90, P120, P150 and
P180, W28 - Body weight at 28 days (g), EW – Egg weight (g), AFE – Age at first egg (days), P30 - Egg production at 30 days, P60 - Egg production at 60 days, P90 - Egg production at 90 days, P120 - Egg production at 120 days, P150 - Egg production at 150 days, P180 - Egg production at 180 days
Table 6. Expected genetic gains with selection based on three selection indices for the three
lines under study.
Trait W28 EW AFE P30 P60 P90 P120 P150 P180 Yellow DG-SI1 -0.64 0.16 -1.29 1.54 2.03 2.16 2.36 2.46 2.63 DG-SI2 0.23 0.22 -1.41 1.57 2.07 2.32 2.53 2.63 2.78 Can-Index 0.42 0.13 -1.52 1.75 2.30 2.43 2.35 2.23 1.71 Blue DG-SI1 -0.98 0.09 -1.56 1.84 2.49 2.72 2.97 3.34 3.65 DG-SI2 -0.01 0.12 -1.78 2.11 2.78 3.04 3.24 3.58 3.94 Can-Index 0.89 -0.02 -1.95 2.22 2.71 2.64 2.39 2.09 1.79 Red DG-SI1 -1.34 0.19 -1.70 2.06 2.41 2.49 2.55 2.84 3.20 DG-SI2 -0.46 0.24 -1.87 2.20 2.25 2.22 2.22 2.51 3.00 Can-Index -0.08 0.06 -2.11 2.44 2.84 2.68 2.45 2.54 2.97
W28 - Body weight at 28 days (g), EW – Egg weight (g), AFE – Age at first egg (days), P30 - Egg production at 30 days, P60 - Egg production at 60 days, P90 - Egg production at 90 days, P120 - Egg production at 120 days, P150 - Egg production at 150 days, P180 - Egg production at 180 days, DG-SI1 – gain selection index when all traits had a desired gain of one genetic std. dev., DG-SI2 – Desired-gain selection index when all traits had a desired Desired-gain of one genetic std. dev. except W28 which had a desired Desired-gain of 0 , Can-Index – Canonical selection index.
Table 7. Spearman’s rank correlation coefficient between canonical selection index
(Can-Index) and desired-gain selection index (DG-SI1, DG-SI2) for the three lines under study.
DG-SI1 DG-SI2
Can-Index Yellow 0.75 0.82
Can-Index Blue 0.76 0.82
Can-Index Red 0.85 0.85
DG-SI1 – Desired-gain selection index when all traits had a desired gain of one genetic std. dev.
DG-SI2 – Desired-gain selection index when all traits had a desired gain of one genetic std. dev. except W28 which had a desired gain of 0.
374 375 376 377 378 379 380 381 382 383 384 385 386 387 388 389 390 391 392