UNIVERSITÉ DE MONTRÉAL
SAFETY ANALYSIS OF ROUNDABOUT CONVERSIONS BASED ON VIDEO OBSERVATIONS
STEPHEN WOODALL-KALFAIAN
DÉPARTEMENT DES GÉNIES CIVIL, GÉOLOGIQUE ET DES MINES ÉCOLE POLYTECHNIQUE DE MONTRÉAL
MÉMOIRE PRÉSENTÉ EN VUE DE L’OBTENTION DU DIPLÔME DE MAÎTRISE ÈS SCIENCES APPLIQUÉES
(GÉNIE CIVIL) FÉVRIER 2018
UNIVERSITÉ DE MONTRÉAL
ÉCOLE POLYTECHNIQUE DE MONTRÉAL
Ce mémoire intitulé :
SAFETY ANALYSIS OF ROUNDABOUT CONVERSIONS BASED ON VIDEO OBSERVATIONS
présenté par : WOODALL-KALFAIAN Stephen
en vue de l’obtention du diplôme de : Maîtrise ès sciences appliquées a été dûment accepté par le jury d’examen constitué de :
M. TRÉPANIER Martin, Ph. D., président
M. SAUNIER Nicolas, Ph. D., membre et directeur de recherche M. ST-AUBIN Paul, Ph. D., membre et codirecteur de recherche M. LARDJAM Lahouari, membre
DEDICATION
To my parents, who have done so much for me,
To my friends and family,
ACKNOWLEDGEMENTS
This research project was funded by the NSERC (National Sciences and Engineering Research Council of Canada). I would like to acknowledge their contribution toward the project, along with the New York Department of Transportation and the City of Gatineau for their support in the logistics of the project and for their overall collaboration.
I would like to thank my project supervisor Nicolas Saunier, for his guidance and meticulous attention to the project throughout my Master’s degree. A special thank you also goes to Paul St-Aubin, for his support, his availability and his help in the understanding and use of the computer vision tools throughout the project.
A particular acknowledgement is owed to all the other students with whom I have shared an office for the duration of my project, and with whom I’ve shared great friendships and many enjoyable moments.
Finally, I would also like to thank and acknowledge the unwavering moral support of Rachel, the Pradayrol family and - particularly - my parents, throughout my Master’s at Polytechnique Montréal; they have constantly guided, encouraged and supported me during my journey.
RÉSUMÉ
Les carrefours giratoires prennent de plus en plus de place dans le réseau routier Nord-Américain, remplaçant les intersections à géométrie plus standard pour accroître la sécurité et l'efficacité. La réduction à la fois des vitesses, mais aussi du nombre et de la sévérité des collisions, tout en conservant un débit de véhicules efficace, sont tous des avantages qui ont justifié l'introduction des carrefours giratoires dans les réseaux routiers en Amérique du Nord.
Le développement des nouvelles technologies utilisées dans l'ingénierie des transports a engendré de meilleures capacités analytiques dans le domaine de l'analyse de la sécurité routière. Le domaine de la vision par ordinateur, qui a émergé au cours des années 1970, a permis aux analyses d'être basées sur des données vidéo plutôt que sur des données d’accidents, dont l'utilisation est courante depuis que les études d'analyse de sécurité routière ont débuté.
Ce projet de recherche vise à utiliser l'efficacité accrue de l'analyse de données vidéo automatisée afin d'étudier deux sites de conversion en carrefour giratoire suivant une méthode « Avant-Après ». Les sites sont tous deux basés en Amérique du Nord (l'un à New York City, l'autre à Gatineau, au Québec). L'analyse de sécurité liée aux conversions en carrefour giratoire utilise des mesures substitutives d’analyse ; c'est-à-dire des méthodes visant à remplacer l’utilisation des données d’accidents en offrant une manière plus proactive d'évaluer la sécurité.
La méthodologie développée pour l'évaluation de la conversion des carrefours giratoires dans le cadre de cette étude repose sur plusieurs méthodes d'analyse qui sont complémentaires. L'objectif de la méthodologie est d'analyser la conversion en carrefour giratoire à plus grande échelle avant d'ajouter une analyse plus microscopique du comportement des usagers de la route. Premièrement, une analyse préliminaire des points de conflit permet de comparer les deux conceptions d'intersection différentes en termes de « points chauds » dangereux potentiels pour les usagers de la route. Dans une deuxième analyse nécessitant l'utilisation des outils logiciels (tvaLib et Traffic Intelligence) pour détecter et analyser les trajectoires des usagers de la route, deux indicateurs bien connus de sécurité sont utilisés : la vitesse et le temps à la collision (TTC).
À cette seconde analyse s’ajoute l’étude comparative des conversions en carrefour giratoire et consiste à déterminer les mouvements comparables entre les deux configurations d'intersection, en utilisant à la fois les attributs géométriques des intersections et l'analyse préliminaire des points de
conflit. La méthode d'analyse par mouvement nécessite alors la collecte de paires d'usagers de la route pour l'ensemble des mouvements comparables pour les deux configurations d'intersection. Toutes ces méthodes visent à comparer les performances du carrefour giratoire transformé comparativement à l'intersection qu'il remplace, en termes de comportement des usagers de la route et de danger pour la sécurité des usagers. Les résultats sont contrastés ; tandis que la conversion du carrefour giratoire à New York a montré une amélioration en termes de ralentissement de la vitesse des usagers de la route, il y avait peu de changement dans les valeurs TTC médianes pour les paires d'usagers impliquées dans chacune des intersections. L'analyse par mouvement a montré une diminution globale du nombre de paires d’usagers sur l’ensemble des mouvements étudiés, bien que les résultats ne soient pas concluants dû à des problèmes de suivi des véhicules entre origines et destinations. Les résultats pour le site Jean-Proulx à Gatineau n'ont pas été concluants pour les différentes analyses, en raison du dysfonctionnement des caméras et des disparités dans le comptage des véhicules.
ABSTRACT
Roundabouts in North America have been increasing in importance in recent years, as they replace intersections for increased safety and efficiency. The reduction in speeds as well as in the number and severity of collisions while conserving efficient vehicle flow are all advantages that have justified the introduction of roundabouts into recent road designs in North America.
New technologies used in transportation engineering have allowed for better analytical capabilities in the field of traffic safety analysis. The field of computer vision, which has emerged during the seventies, has enabled analysis to be based on video data rather than accident data, the use of which has been standard since road safety analysis studies began post-Second World War.
This research project aims to use the capabilities and increased efficiency of automated video data analysis in order to analyse two roundabout conversion sites following a “before-after” method – the sites are both based in North America (one in New York City, the other in Gatineau, Quebec). Safety analysis related to the roundabout conversions uses surrogate measures of safety, i.e. analysis methods aiming to replace accident data by offering a more proactive way of evaluating safety.
The methodology developed for the roundabout conversion evaluation in the context of this research study is based on several, complementary methods of analysis. The objective of the methodology is to analyse the roundabout conversion on a larger scale before adding a more microscopic analysis of road user behaviour. Firstly, a preliminary conflict point analysis helps compare the two different intersection designs in terms of potential hazardous “hotspots” for road users. In a second analysis requiring the use of the software tools (tvaLib and Traffic Intelligence) used to detect and analyse road user trajectories, two well-known safety indicators are used: speed and time-to-collision (TTC) distributions.
A further part of the second analysis method adds to the comparative analysis of the roundabout conversions, and consists of determining the comparable movements between the two intersection configurations, using both the geometrical attributes of the intersections and the preliminary conflict point analysis. The movement analysis method then requires the collection of road user pairs in the set of comparable movements for both intersection configurations.
All of these methods aim to compare the performance of the converted roundabout as opposed to the intersection it replaces, in terms of road user behaviour and safety hazard. The results are contrasted; while the roundabout conversion in New York City showed an improvement in terms of slowing road user speeds, there was little change in the median TTC values for user pairs involved in both intersections. Movement analysis showed a decrease in user pairs for the different conflicting movements, yet the results remain inconclusive due to tracking problems. The results for the Jean-Proulx site in Gatineau were also inconclusive, for all analyses, due to camera malfunction and disparities in vehicle counts.
TABLE OF CONTENTS
DEDICATION ... III ACKNOWLEDGEMENTS ... IV RÉSUMÉ ... V ABSTRACT ...VII TABLE OF CONTENTS ... IX LIST OF TABLES ... XIII LIST OF FIGURES ... XIV LIST OF SYMBOLS AND ABBREVIATIONS... XVII GLOSSARY ... XVIII LIST OF APPENDICES ... XX CHAPTER 1 INTRODUCTION ... 1 1.1 Research Problem ... 1 1.2 Research Objectives ... 2 1.3 Methodological approach ... 3 1.4 Thesis structure ... 4CHAPTER 2 LITERATURE REVIEW ... 5
2.1 Safety Analysis Methods ... 5
2.1.1 An Introduction to Road Safety ... 5
2.1.2 Conflicts and the Traffic Conflict Techniques ... 7
2.1.3 Surrogate Measures of Safety ... 9
2.2 Roundabout Safety Studies in North America and Before-after Studies ... 10
2.3 Video Analysis Tools for Traffic Analysis ... 12
3.1 Conflict Point Analysis ... 14
3.1.1 General Case – 3- and 4- way intersections ... 16
3.1.2 General Case – 3-Branch Roundabout ... 18
3.1.3 General Case – 4-branch roundabouts ... 19
3.2 Movement Analysis ... 19
3.2.1 Analysis of Conflict Point Chains ... 20
3.2.2 Movement Analysis in the context of before-after analysis studies ... 22
3.3 Analysis of Speed and TTC ... 24
3.3.1 Speed distribution analysis ... 24
3.3.2 TTC analysis ... 25
3.4 Combined analysis resulting from the use of computer vision ... 28
3.4.1 Introducing the computer vision software ... 28
3.4.2 Output and Analysis ... 29
CHAPTER 4 CASE STUDIES ... 31
4.1 Before-and-After study – Intervale Avenue/Dawson Street intersection (Bronx, N.Y.C.) ... 31
4.1.1 Context ... 31
4.1.2 Initial Intersection ... 31
4.1.3 Roundabout Implementation ... 32
4.1.4 Conflict Point Analysis ... 34
4.1.5 Video Analysis and Observations ... 35
4.1.5.1 Before Scenario – initial intersection analysis ... 36
4.1.5.2 After Scenario – Analysis Post-Roundabout Conversion ... 41
4.1.5.3 Before-After Comparison – Speeds and TTC ... 44
4.1.6.1 Definition of comparable Origin-Destination movements ... 46
4.1.6.2 Application of the MA module ... 48
4.2 “Before-and-After” study – Jean-Proulx Intersection (Gatineau, Quebec) ... 51
4.2.1 Context ... 51
4.2.2 Initial Intersection ... 51
4.2.3 Roundabout Implementation ... 55
4.2.4 Conflict Point Analysis ... 57
4.2.5 Video Analysis and Observations ... 61
4.2.5.1 Presentation of the collected data ... 61
4.2.5.2 Vehicle Counts – Jean-Proulx Before and After ... 63
4.2.5.3 Sources of error – Jean-Proulx Data Collection ... 65
4.2.5.4 Before Scenario – Initial Intersection Analysis ... 68
4.2.5.5 After Scenario – Roundabout Analysis Post-Conversion ... 70
4.2.5.6 Before-After Comparison of Speeds and TTC ... 73
4.2.6 Movement Analysis ... 76
4.2.6.1 Definition of comparable Origin-Destination movements ... 76
4.2.6.2 Application of the MA module ... 76
4.2.6.3 Validation of the MA module ... 78
CHAPTER 5 CONCLUSION AND RECOMMENDATIONS ... 81
5.1 Conclusion ... 81
5.2 Limitations of the methodology and suggested improvements ... 82
5.2.1 Limitations due to data collection and processing ... 82
5.2.2 Limitations related to the methodology ... 83
BIBLIOGRAPHY ... 86 APPENDICES ... 91
LIST OF TABLES
Table 3.1: Comparison of conflict point "chains" - 4-way intersection vs. 4-branch roundabout . 21
Table 4.1: Video data characteristics for the Intervale site ... 36
Table 4.2: Vehicle counts before and after the Intervale roundabout conversion ... 36
Table 4.3: List of comparable conflicting movement pairs - Intervale analysis ... 47
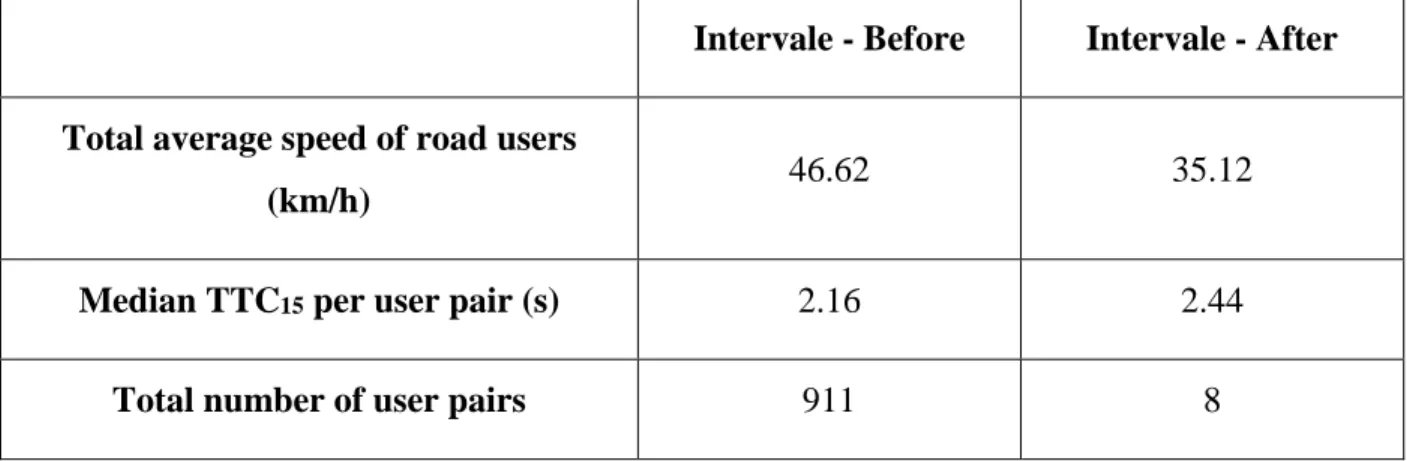
Table 4.4: Number of user pairs involved - Intervale Before and After ... 49
Table 4.5: Average speed and TTC15 values for user pairs for all comparable movement pairs using the MA module - Intervale ... 50
Table 4.6: Jean-Proulx initial intersection traffic light phasing according to time of the day (Green Light Times are included in parentheses) ... 53
Table 4.7 : Comparison of the number of conflict points for the Jean-Proulx site - Before and After roundabout implementation ... 59
Table 4.8: Video data characteristics for the Jean-Proulx site ... 61
Table 4.9: Vehicle and pedestrian counts before and after the Jean-Proulx roundabout conversion ... 63
Table 4.10 : Table of the number of user pairs - Before and After the Jean-Proulx roundabout implementation ... 76
Table 4.11: Confusion matrix – MA module validation process ... 79
Table 4.12: Validation of the number of user pairs detected per OD ... 80
Table A 1: List of comparable conflicting movement pairs - Jean-Proulx analysis ... 91
LIST OF FIGURES
Figure 2.1 Traffic Safety Pyramid Model – (from (Laureshyn, 2016), who adapted from Hydén,
1987) ... 7
Figure 3.1: Project Methodology Flowchart ... 15
Figure 3.2: Three-way intersection (“Y intersection”) with associated conflict points ... 16
Figure 3.3: Conflict points in a four-way intersection (FHWA, August 2004) ... 17
Figure 3.4: Conflict points in a 3-branch roundabout (NCHRP, Report 672, 2010) ... 18
Figure 3.5: Conflict points in a four-branch roundabout (NCHRP Report 672, FHWA, 2010) .... 19
Figure 3.6: Time-To-Collision (TTC) definition ... 26
Figure 3.7: Illustration of the comparison between two TTC distributions (St-Aubin, 2015) ... 28
Figure 4.1 : Initial intersection configuration – Intervale Avenue/Dawson Street ... 32
Figure 4.2 : New roundabout setup – Intervale Avenue/Dawson Avenue ... 33
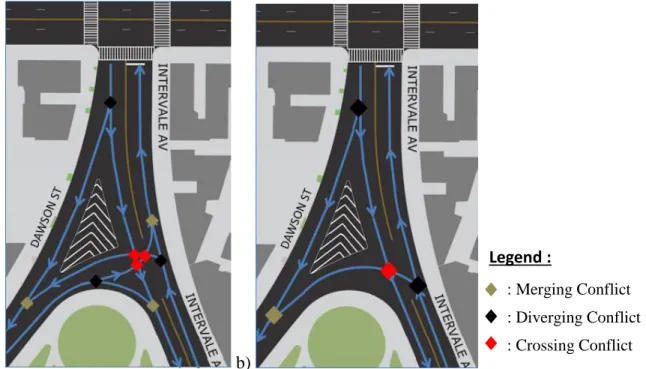
Figure 4.3: Comparison of conflict points a) in the event Dawson Street allowed two directions b) in the actual intersection ... 34
Figure 4.4: Conflict points before and after roundabout implementation on Intervale Avenue .... 35
Figure 4.5: Analysis zone and alignments for the Intervale intersection ... 37
Figure 4.6: Collision point density - Intervale initial intersection ... 38
Figure 4.7: Average user speed distributions along each alignment ... 39
Figure 4.8: Analysis zone and alignments for the Intervale intersection (post-conversion) ... 41
Figure 4.9: Collision point density - Intervale intersection post-roundabout-conversion ... 42
Figure 4.10: Average user speed distributions per alignment - Intervale roundabout ... 43
Figure 4.11: Comparison of road user average speed distributions before and after the Intervale roundabout conversion ... 44
Figure 4.13: Illustration of conflicting movement pair 2 (Intervale South Dawson South conflicting with Intervale North Intervale South) - before and after conversion ... 48 Figure 4.14: Satellite image of the Jean-Proulx intersection prior to roundabout conversion with
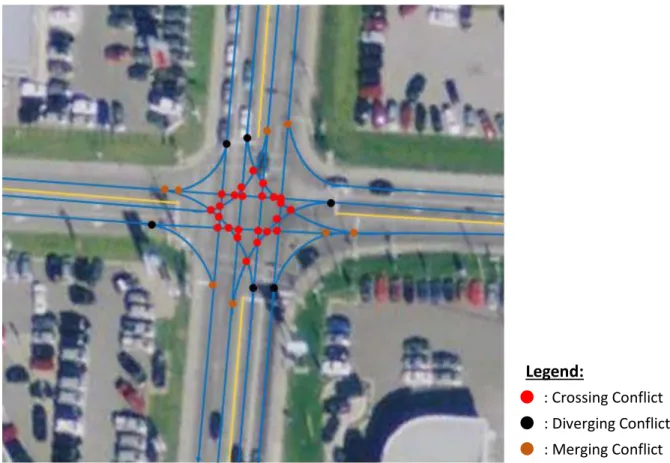
allowed movements for each approach (Source: Google Earth, 2012) ... 52 Figure 4.15: Illustration of the movements allowed in the three different phases for the Jean-Proulx/St-Joseph initial intersection... 54 Figure 4.16: Jean-Proulx roundabout, post-conversion ... 56 Figure 4.17: Conflict points resulting from the possible movements – Jean-Proulx initial
intersection ... 57 Figure 4.18: Conflict points resulting from the possible movements in the implemented
roundabouts– Jean-Proulx converted roundabout ... 58 Figure 4.19 : Variation of conflict point type according to vehicle trajectories within the roundabout
– a) merging conflict point, b) diverging conflict point, c) crossing conflict point ... 60 Figure 4.20: Illustration of the occlusion for the Jean-Proulx initial intersection camera view (view
from the South approach) ... 66 Figure 4.21: Camera view (#5) of the Jean-Proulx roundabout - partial coverage of the roundabout ... 67 Figure 4.22: Camera view (#4) - East approach of the Jean-Proulx converted roundabout ... 67 Figure 4.23: Analysis zone and alignments for the initial Jean-Proulx intersection ... 68 Figure 4.24: Road user average speed distributions for each alignment - Jean-Proulx initial
intersection – camera 1 ... 69 Figure 4.25: Analysis zone and alignments for the Jean-Proulx converted roundabout ... 70 Figure 4.26: Collision point density for the Jean-Proulx converted roundabout - camera view 2 . 71 Figure 4.27: Road user average speed distributions per alignment - Jean-Proulx converted
roundabout - camera view #5 ... 72 Figure 4.28: Comparative speed distributions - Jean-Proulx initial intersection vs. converted
Figure 4.29: Comparison of TTC15 distributions - Jean-Proulx Before-After ... 75 Figure A 1 : Illustration of conflicting movement pair 11 (Saint-Joseph North Jean-Proulx East
LIST OF SYMBOLS AND ABBREVIATIONS
TCT Traffic Conflict Technique OD Origin-Destination
TTC Time-to-Collision
MA Movement Analysis
SSM Surrogate Safety Measures
NCHRP National Cooperative Highway Research Program FHWA Federal Highway Administration
GLOSSARY
Alignment: According to the definition proposed by St-Aubin (St-Aubin, 2016), an alignment is “a spline or series of points in space defining the centre line of a lane”.
Approach: Segment of a road leading to an intersection or other type of road infrastructure. Circulatory Roadway: “The circulatory roadway is the curved path used by vehicles to travel in a counter clockwise fashion along the central island.” (NCHRP Report 672, FHWA, 2010)
Collision Course: Situations in which two or more road users are predicted to collide (using a motion prediction method) in the absence of a reaction.
Conflict Point: A conflict point is the physical point in space created by two (or more) conflicting vehicle paths, and therefore where a collision between vehicles may occur. The geometrical characteristics of the conflicting paths, such as their direction and angle can result in three different types of conflict points: converging, diverging and crossing conflict points.
Conflicting Flow: Traffic flow of road users already engaged in a roundabout entering the merging zone, thus opposing users entering the roundabout via an approach.
Exposure: “A measure of spatial or temporal duration in the traffic system in relation to the number of dynamic system objects, road users, vehicles, etc” (Archer, 2004). Exposure to collision relates to any pre-cursor situation in which a collision can take place.
Homography: “A mathematical coordinate transformation between two planes, which projects a point from an image space plane to a world space plane.” (St-Aubin, 2016)
Interaction: The situations in which two road users exist “simultaneously and closely in space” (St-Aubin, 2015) (Saunier et. al, 2010).
Merging Zone: As defined by St-Aubin in his thesis, a merging zone represents “a roundabout sub-segment where merging action takes place between approaching and conflicting flows”. (St-Aubin, 2016)
Motion-Prediction Method: A method of predicting road users’ expected positions (and thus expected trajectories) using an algorithm relying road users’ previous positions.
Movement: Vehicle trajectory within an intersection defined by both an origin (the road user’s entry point) and a destination (the road user’s exit point).
Occlusion: An occlusion occurs when an observed object is partially (or completely) obstructed from view by an object that is physically situated between the observer (here the camera) and the observed object (in this case, a road user).
Road User: A person or object (automated or otherwise) using the road for transportation purposes. Types of road users include vehicles, pedestrians, cyclists, buses, lorries, etc.
Time-to-Collision: The time remaining for two vehicles to collide should their trajectories remain the same, supposing evasive action does not take place.
Traffic Conflict: In transportation engineering, a traffic conflict is an “event involving two or more moving vehicles approaching each other in a traffic flow situation in such a way that a traffic collision would ensue unless at least one of the vehicles performs an emergency manoeuvre”. (Amundsen, F. & Hydén, C., 1977)
Traffic Event: Period of time during which one or more road users passes through a given road section.
Trajectory: A series of positions as a function of time which define the movement of an object. The objects, in the context of this thesis, are road users.
User pair: “A pair of road users coexisting within a finite distance over a finite common time interval” (St-Aubin, 2016).
LIST OF APPENDICES
APPENDIX A MOVEMENT PAIRS FOR THE JEAN-PROULX MOVEMENT ANALYSIS
CHAPTER 1
INTRODUCTION
1.1 Research Problem
Roundabouts are gradually taking a place of importance in North American road networks, as an efficient and safe alternative to most types of intersections. This relatively recent type of design initially appeared in the 1960s following changes in the British Highway Code—users engaged in traffic circles previously had to yield to oncoming traffic. One of the main objectives of roundabouts being to improve both safety (by reducing the number of accidents and their severity) and traffic flow, many research studies have tackled the topic of road safety in roundabouts and their effect on the behaviour of road users.
With the emergence of cars as a popular and effective way of travelling, road safety became a concern of great proportion. Studies relating to road safety initially started by presenting accident data as a means of measuring dangerousness (for evaluation of both infrastructures and driving behaviour). However, accidents are also rare events, which makes both sample size and the data collection process an issue when analysing road user behaviour. Furthermore, accident data such as reports collected at the scene by police and ambulance officials do not necessarily contain all the information required for analysis by traffic engineers, as the purpose of such reports is of a different nature.
While fatal and injury accidents are the most undesirable events and only happen rarely, data pertaining to the most common types of dangerous road events (fender-benders, traffic conflicts) is even more challenging to collect as reports are not always available, or even exist in the first place.
As traffic engineers have taken to analysing road safety, various methods have been developed for traffic safety analysis, relying on accidents, non-crash events (such as traffic conflicts) and other safety related events and behaviours. Collecting safety-related events using more or less automated video analysis is a recent practice (starting in the mid-2000s) which has relied on information technology developments and new computer vision technologies for the processing and treatment of video data.
With the relatively recent introduction of roundabouts in North America, questions have surfaced regarding their effectiveness and safety in North American driving environments, as roundabouts are still a relatively unknown facility to many road users. As such, there are few before-after studies of roundabout conversions and other conversions to newer designs such as displaced left-turn or diverging diamond interchanges. There are even fewer studies at the microscopic level based on direct observation of road user pairs and behaviour. Studies are generally done at site level based on crash data, which is more readily available.
1.2 Research Objectives
As was mentioned above, crash data is not always an available or reliable resource in terms of safety analysis for road users at intersections or roundabouts, as information about driver behaviour or accident causes can be unavailable or lacking sufficient accuracy for analysis. Furthermore, comparing designs of very different natures and different modi operandi also constitutes a challenge; the default universally recognised method of analysing a roundabout conversion in terms of safety for road users is based on crash data comparison at the site-level.
This thesis presents a before-after analysis of two intersections subsequently transformed into roundabouts. The first intersection is in the borough of the Bronx, New York City (NYC), in the State of New York in the United States, while the second is situated in Gatineau, in the province of Quebec in Canada.
The focus of this thesis follows a series of projects undertaken by a research team conducting a large-scale, three-year research project on roundabout safety in Quebec, Canada, from 2011 to 2014, with overall results showing an inconclusive impact of roundabouts compared to signalized intersections (Saunier et al., 2015). With extra video data being available both before and after roundabout conversion for the NYC and Gatineau sites, this research project constitutes a follow up study, focusing on before-after analysis with the sole use of video data.
This research project aims to develop and apply a method using safety measures based on non-crash events called surrogate measures of safety to evaluate the safety of a converted roundabout compared to the previous geometric configuration and type of control. The main research questions leading to the analysis conducted and described in the following chapters are the following: do roundabouts constitute a safer form of intersection control than other types of standard
intersections? What indicators can be used to show a change in the safety of the infrastructure? How is the safety improvement manifested, if any?
The proposed methodology is then applied to both case studies in order to firstly determine its potential in terms of before-after analysis, but also in terms of evaluating safety improvement (or lack thereof) for both sites.
1.3 Methodological approach
While the development of new road safety analysis techniques has been at the forefront of research in the field of road safety, methods to compare two very different infrastructures in terms of geometry is far from an easy task, as roundabouts and conventional intersections function in very different ways. Such an exercise presents added difficulties due to the lack of common characteristics of the various layouts, such as roundabouts or even diverging diamond interchanges – as seen in the works of Bared et. al (2005).
As mentioned previously, this thesis focuses on two specific cases, that of the installation of a roundabout to replace the 3-way intersection connecting Intervale Avenue with Dawson Street, in the Bronx, NYC, as well as the intersection of Jean-Proux Avenue and St-Joseph Boulevard in Gatineau. A specific methodology was developed to compare the two designs for each case study, relying on three distinct types of analysis:
1. an analysis of the conflict points aimed at pinpointing the points of possible conflicts (and their corresponding types) according to vehicle movements;
2. a safety analysis using the surrogate measures of safety Time-to-Collision (TTC) and speed a) at the site level and b) for the different movements (by origin-destination, referred to as OD).
The three analysis methods are complementary components of the overall safety analysis. Conflict point analysis provides an overview of the different a priori “hotspots” within the intersection and roundabout where road users may encounter conflict situations. The addition of TTC and speed distributions of all the road users involved in the intersections and converted roundabouts provides another dimension to the safety analysis through the actual observation of road user pairs and behaviour within the given infrastructures. Finally, after the site-level analysis of speed and TTC distributions, these are analysed by movement on a more microscopic level.
1.4 Thesis structure
This thesis comprises several sections. Chapter 2 presents a review of literature pertaining to the various fields covered by this research project, emphasizing previous research in roundabout safety and conflict analysis.
The methodology for the road safety analysis used in this research project is presented in the third Chapter 3 of this thesis. It presents both complementary analysis methods, as well as the video analysis tools.
Chapter 4 examines two case studies where the proposed methodology has been applied to compare safety in a before-after context; sections 4.1 and 4.2 follow the same structure. First, the initial intersection and its roundabout replacement are presented along with their defining characteristics. Conflict points are then drawn and examined as preliminary safety analysis. A full set of results extracted from the use of automated video analysis software for road user behaviour and road safety analysis is presented, with a highlight being made concerning road user speeds and TTCs. Movement analysis is then conducted to examine the safety of road users for OD pairs within the intersection. Finally, validation of the movement analysis and conclusions concerning the road safety effects of both infrastructures are made.
In the last chapter, an overview of the results for both case studies is presented and evaluated. Conclusions are then drawn on the overall road safety effects of roundabout implementation using the results obtained during Chapter 4, along with limitations of the methodology used during the project - recommendations are then made for future work on the topic of road safety involving roundabouts and analysis using computer vision.
CHAPTER 2
LITERATURE REVIEW
Improvements in road safety analysis techniques have been at the forefront of new research, with accident data and surrogate measures of safety (often using video analysis) being the two major categories of methods used to analyse road user behaviour and safety. The main theme explored in this project relates to the use of surrogate safety methods using video analysis at converted roundabouts, but it is pertinent in the exploration of previous work to mention related research in which roundabout safety and video analysis tools have been used and evaluated.
2.1 Safety Analysis Methods
Road safety has been a concern of many researchers for over 70 years, as the automobile industry started booming, post-Second World War. The first research attempts into traffic engineering related to road safety came in the 1950’s and 1960’s (Hagenzieker et. al, 2013, St-Aubin, 2016). As attempts to develop models and analysis methods to evaluate traffic safety increased, the 1970’s and 1980’s saw the development of Traffic Conflict Techniques (TCT) (Asmussen, 1984)1. This section firstly presents an introduction to road safety, followed by a section covering the background related to road safety studies and the limitations of accident data. This leads to an overview of existing TCTs – both in terms of concept and application – before Section 2.1.3 presents surrogate measures of safety for road safety analysis.
2.1.1 An Introduction to Road Safety
Most people (if not all) are, at some stage, a road user, whether that be as a motorist (car/lorry/bus driver) or passenger, a cyclist, or as a pedestrian. Road users, combined with the different infrastructures they use (roads, intersections, highways, etc.) and vehicles constitute the traffic system. Road safety analysis encompasses the means and methods used to evaluate the risk of –
1 It is worth noting, in the context of traffic conflict studies, that the ICTCT (initially the International Co-operation
on Traffic Conflict Techniques, then rebranded as the International Co-Operation on Theories and Concepts in Traffic Safety) was founded in 1977 by a collaboration of researchers working on developing methods and setting baselines for the analysis of traffic conflicts for safety diagnosis. (ICTCT, 2016)
and prevent – accidents (the result of road users colliding) within a road system. As is illustrated in Figure 2.1, several types of accidents exist (ranging from accidents showing only vehicle physical damage to accidents of increased severity, with severe injuries or even fatalities to vehicle drivers and/or passengers). The severity of a collision is the “measure of the total amount of damage done to property and bodily harm done to individuals in the event of a collision” (St-Aubin, 2016). Assessing road safety is traditionally based on collision risk, which should represent both the frequency, or probability, of an accident, and its severity. Basic measures are the overall number of collisions, collision rate (i.e. the number of collisions per unit of exposure2), and collision severity. As every road has a different traffic flow, the number of traffic accidents varies over a given period of time (whether that be a year or several years) and accident rates (usually expressed as a number of accidents per unit of exposure) are one way to compare them.
Traffic accidents are rare, but are also random events, as the number of accidents for a given period and intersection or road section varies, even with unchanged traffic conditions. It may therefore be necessary to collect data over a long period of time, without witnessing any change in road conditions or infrastructure, to collect a large enough set of accidents for statistical inference. Another limitation to accident data derives from accident logs and reporting. Accident records are initially recorded by the police and emergency services, as opposed to traffic engineering. Traffic engineers are concerned with infrastructure, as well as road user behaviour (to some extent), while the collected accident data shows more use by police services in assigning responsibility. This entails that the information available on these reports is often of limited use to traffic engineers, and limits their effectiveness for use in safety analysis. Furthermore, not all accidents are reported, with the level of reporting usually depending on the severity of the accident: accidents involving injuries and fatalities are usually always reported on, while low-severity, i.e. property damage only, accidents are more often omitted (Imperialou, & Quddus, 2017).
2 Exposure is a measure of spatial or temporal duration in the traffic system in relation to the number of dynamic
2.1.2 Conflicts and the Traffic Conflict Techniques
Understanding and analysing road safety analysis requires the basic comprehension of various traffic events, and what they represent – in both a conceptual and a practical sense. An illustration of various traffic events with respect to accidents is illustrated in the literature by Figure 2.1 (Laureshyn, 2016):
Figure 2.1 Traffic Safety Pyramid Model – (from (Laureshyn, 2016), who adapted from Hydén, 1987)
As shown by the pyramid in Figure 2.1, most traffic events are qualified as undisturbed passages, i.e. the absence of any (conscious) interactions between road users. A much lower proportion of road events are qualified as conflicts, whether these are categorised as serious, slight or potential conflicts. At the top of the pyramid (i.e. the rarest type of road event), is the accident, with the various severity levels shown to the left of the diagram.
The idea of conflict analysis was first developed by researchers at General Motors in the late sixties, as an alternative method of observing the potential for accidents (Perkins & Harris, 1967). The proposed method of evaluation for GM’s method was based on the definition of five types of conflicts (1- Left-turn conflicts, 2- Weave conflict, 3- Cross-traffic conflict, 4- Red-light violation conflict, 5- Rear-end conflict) and used two observers for collection of conflict data within different intersections, with approximately 2.5 h of data collected for each approach leg (Glennon & Thorson, 1975). The term “conflict” was defined by GM in 1967 as being “either an evasive action
of a driver or a traffic violation”. Evasive action situations were then measured by either brake lights turning on or lane changes occurring in the presence of an “impending accident situation”. TCTs and their application to traffic safety studies became popular through the 1970’s, with Swedish researcher Christer Hydén being one of the first to develop the technique. The Swedish TCT relies on conflicting speed and the Time-to-Accident (TA) concept (1996), which itself is a measure at a specific instant of the Time-to-Collision (TTC) indicator developed by Hayward (1971). In its general definition, TTC is defined as the time remaining before two road users would collide, if their movements remain unchanged. TA is a measure of the TTC at the instant a road user initiates the first evasive action (and conflicting speed is measured at the same instant). While the definitions of most traffic events can seem simple to comprehend, proposing a definition of a traffic conflict has attracted several researchers in the field of traffic safety. During the first ICTCT meeting in 1977, the following definition was proposed and remains the most commonly used: “An observable situation in which two or more road users approach each other in space and time to such an extent that there is a risk of collision if their movements remain unchanged”. (Amundsen & Hyden, 1977).
Laureshyn shows that there are two schools of thought when it comes to characterising traffic conflicts: one considers a conflict to precede evasive action, whereas the other supports the idea that evasive action precedes conflicts (2016). The common ground that all definitions of traffic conflicts have is the existence of a collision course, which implies an evasive action if there is no collision.
The traffic conflict definition to be retained for this thesis is close to the one proposed by Amundsen and Hyden (1977), and integrates the notion of road users needing to undertake evasive action to avoid a collision. It is formulated as follows: “an observable traffic event involving two or more vehicles approaching each other in space and time in such a way that there is a risk of collision unless at least one of the vehicles resorts to evasive action”.
While traffic conflicts are real, observed situations, a clear distinction must be made from conflict points, which are defined by road user movements. Conflict points within an intersection are determined with the sole use of the intersection geometry. Ideal vehicle trajectories are drawn for each movement in the intersection, and conflict points are determined as being the intersections of the trajectories. The Federal Highway Administration (FHWA)’s guide (2004) illustrates that there
are three types of conflict points: merging, diverging and crossing conflict points. These are defined by the angle and direction at which two road users would collide should their trajectories correspond to the ones drawn in the conflict point diagram.
2.1.3 Surrogate Measures of Safety
Historically, studies relating to road safety analysis have relied extensively on the collection and use of accident data, with the presented limitations. Collision-based safety analysis methods are limited in terms of understanding road user behaviour and other factors leading to accidents (Tarko et al., 2009).
Surrogate measures of safety (SSM) are a relatively new concept, with the TCTs constituting an early method to obtain surrogate measures of safety. The general idea behind using surrogate measures of safety is to use a more “proactive” approach, through studies involving field observations. To collect detailed information about collision processes and factors, it is cost-effective method for researchers to administer their own data collection. Thus, through direct observation of traffic events, using all observations (including undisturbed passages of road users), a road safety diagnosis can be made more quickly, without the need to wait for the occurrence of a collision. Tarko et. al indicate that surrogate measures of safety should be based on observable non-crash events which can be physically and logically related to accidents (2009).
Laureshyn et al. used the concept of TTC as an indicator for proximity between road users, and between a traffic event and a collision and applied it to video analysis (2010). Whilst this concept dates to the 1970s (Hayward, 1971) during the development of TCTs, it is still in active use, including in driver assistance technology for example. The works of St-Aubin et. al used the algorithm developed by Laureshyn to compute TTC in a case study of safety at highway ramps in the Montreal area (2013).
The surrogate measures of safety to be used in this research project are chosen due to their widespread use in road safety studies.
2.2 Roundabout Safety Studies in North America and Before-after
Studies
It has been shown in major studies that roundabouts offer a significant improvement in road safety. The National Cooperative Highway Research Program (NCHRP) Report 572 reports a diminishing number and severity of crashes (especially higher-severity crashes) (FHWA, 2007). NCHRP Report 672 demonstrates a reduction in the number of conflict points in roundabouts and reports lower observed absolute and relative speeds, citing these as contributing towards safety improvement compared to stop-controlled intersections (FHWA, 2010).
While the CMF (Crash Modification Factor) is mainly used in studies involving accident data, past studies have shown a correlation to conflicts in roundabout safety studies. In a study including 53 intersections in the Toronto area (the data covered a three-year period), Shahdah et. al (2014) ran simulations to evaluate the relationship between the number of simulations run and the calibrated crash-conflict relationship and the CMF. The Wiedermann-74 car-following model was used in VISSIM, and the safety indicator used was TTC. The results showed a strong link between simulated traffic conflicts to real-life observed crashes, and that surrogate safety measures based on simulated conflicts can be used to estimate CMFs. In a study analysing the CMFs for converted roundabouts in the state of Oregon, Dixon & Zheng (2014) documented several past studies in which CMFs were used. While the variation in CMFs was significant between the studies and was also sensitive to traffic volumes in the intersections, the CMFs were globally reduced after roundabout conversion (CMF values varying between 0.13 and 1.03). It was also shown that the type of initial intersection (prior to roundabout conversion) was a likely influence on crash reductions. As a reference, the CMF from the Highway Safety Manual for conversions from stop-controlled intersections to single-lane roundabouts is 0.42 (meaning the number of collisions would drop by 58 % after conversion) (Persaud et. al, 2001). NCHRP Report 572 (2007) showed that the CMF for conversions of signalised intersections into modern roundabouts was 0.33 (in a suburban setting, for a one- or two-lane intersection). In an urban setting the CMF was of 0.99 for all crash severities (the findings were that it could increase, decrease or remain the same). Overall, for all environments and settings (one- or two-lane intersections) and all types of severities, the CMF for the conversion of signalised intersections into modern roundabouts was evaluated to be 0.52, pointing to an increase in safety for roundabout conversion.
Persaud & Lyon suggested that, after studying the accidents linked to roundabout implementation using the Empirical Bayes method, the conversion from intersection to roundabout was beneficial, and showed a reduction in injury and property damage crashes (2007). Retting et al, using the Empirical Bayes method in a before-after analysis, underlined a 90 % drop in the number of accidents causing fatalities and serious injuries and a reduction in excess of 70 % in the number of injury crashes overall (2001). Hyden & Varhelyi (2000), Senk & Ambros (2011), as well as Daniels et. al (2012) reached similar conclusions using regression models, thus validating the overall expected safety improvement from roundabout conversion.
In a report by Saunier et. al closely related to this research project, a database of approximately 100 roundabout sites (including 20 sites evaluated using video data) in Quebec was analysed, to evaluate road user safety and behaviour relating to this relatively recent type of infrastructure in Quebec (2015). The research report made use of accident data, video analysis and a survey for pedestrians in its overall evaluation of roundabout safety. Safety indicators were used in the context of video analysis, such as speeds, vehicle gaps and TTC. The analysis of speeds and TTC was inconclusive, yet answers to one of the survey questions pointed toward a generally good understanding of the way roundabouts operate. Accident frequency analysis in terms of the different roundabouts did not yield any conclusive results either. The overall conclusion in the report mentioned previously shows that larger roundabouts (i.e. roundabouts with more than one lane and over significant width) tend to show a poorer safety performance after their conversion from a standard intersection.
Roundabouts are different in nature to standard intersections and constitute a relatively new concept in North American environments. However, other non-standard types of intersections exist in North America, and while documentation on these is limited, it is relevant in the context of this project to study other work on the topic. While non-standard intersections come in many forms, and are detailed in some of the literature, there are few before-after studies relating to non-standard intersections. However, the work of Bared et. al explores the comparison between standard intersections and diverging-diamond interchanges, where lanes switch sides in the intersection (2005). The main safety finding of before-after studies of Diverging Diamond Interchanges was a significant speed reduction from vehicles crossing the interchange compared to vehicles crossing the initial intersection.
2.3 Video Analysis Tools for Traffic Analysis
Intelligent transport systems provide increasingly accurate methods for data collection and processing, for example, through computer vision, which allows automated video-based road user detection and tracking. In the context of road safety studies, data collection has often been a limiting factor in their efficient analysis, due to the required long times of observation, but more importantly due to the limited ability to collect data at a microscopic level with sufficient accuracy.
Multiple video analysis tools have been developed in the field of traffic analysis, one of the first being the AUTOSCOPE project, a video detection system developed in Minnesota by Michalopoulos et. al (1990), another being a feature-based vehicle tracking system as presented by Beymer et. al (1997). Since then, several tools for traffic safety analysis have been developed for safety evaluation. Extracting surrogate measures of safety has been one of the motivators behind the application of computer vision technology to transportation, with applications to road safety at intersections (Saunier & Sayed, 2006), as well as pedestrian-vehicle interactions at crosswalks (Ismail et. al, 2009), and cyclist safety at cycling facilities (Zangenehpour et. al, 2015).
Sakshaug et. al studied cyclist safety in roundabouts using video analysis, and found that cyclists were more prone to be involved in serious conflicts when integrated to traffic as opposed to roundabouts in which cycle paths were kept separate from traffic (2010). Video recording and automatic detection tools were used in the analysis, though conflict recordings were analysed manually.
Several studies of roundabouts have been undertaken using video analysis. Russell et. al (2012), along with the KDOT (Kansas Department of Transportation) analysed the performance of roundabouts using video data obtained by placing a camera on site. Traffic flow was then extracted from the data and subsequent roundabout simulations were conducted using SIDRA, a computer evaluation software, which enables comparison between modern roundabouts and various types of intersections. Some systems have been used for video analysis at roundabouts, such as VeTRA (Vehicle Tracking for Roundabout Analysis) in the works of Mussone et. al (2011). The use of this software requires pre-elaboration of the geometric model of the roundabout studied, on top of the camera calibration work, and produces Entry/Exit count matrices, trajectories, speed profiles as well as flow classification. A more manual and qualitative approach was sometimes preferred, as shown in the study by Krivda (2013) where the analysis of roundabouts in the Czech Republic was
conducted using manual analysis providing a detailed classification for every road user entering the roundabout to monitor conflict types and severity.
As presented in recent work (St-Aubin et al., 2015), in which speed, gap and TTC were the main variables evaluated to show roundabout safety performance, width of the apron and the number of exit lanes had a significant impact on driving speeds whereas the ratio of approaching and conflicting flows (coming from inside the roundabout) was found to be significantly correlated with TTC.
The video analysis tool (tvaLib) developed as part of roundabout-related research and used in this study was developed by St-Aubin, and presented in detail in previous work (St-Aubin et al., 2015, St-Aubin, 2016). It is a shared source tool which analyses driver behaviour and safety based on the vehicle detection and tracking algorithm available in the open source Traffic Intelligence project (Jackson et al., 2013).
Traffic Intelligence implements a feature-based algorithm for tracking all road users. This enables the extraction of road user trajectories from the raw video data by first detecting and tracking pixels from one frame to the next, and recording these as feature trajectories. A road user therefore has several feature trajectories, which are grouped according to their motion over several frames. The output of the trajectory collection enables several standard measures to be performed, based on the physical characteristics of these trajectories. As such, vehicle speeds, lane changes, basic traffic counts and other measurements of road user behaviour can be determined. tvaLib is a tool built on top of Traffic Intelligence, and constitutes a platform for surrogate safety analysis. tvaLib (and, by extension, Traffic Intelligence) is used throughout this research project to conduct all elements of video data analysis.
CHAPTER 3
METHODOLOGY
The overall methodology for the data analysis in this research project is illustrated in Figure 3.1, and detailed in the following sections of this chapter.
3.1 Conflict Point Analysis
The first approach to the before-after analysis methodology presented in this chapter is the analysis of conflict points within a given site. The objective of such a study is to determine, prior to the use of video data collected at each site, the potential for “danger” to road users. It must be noted here that the trajectories shown in the figures are ideal prototypes of vehicle trajectories as opposed to real, observed vehicle trajectories.
As was shown in the Literature Review, three types of conflict points are described in the transportation engineering literature: converging conflict points, diverging conflict points and crossing conflict points. These different types of conflict points have varying degrees of potential severity (conflict point severity is considered here as being the severity of the potential accident that may result from a collision at that point – based on the angle between the two road users’ trajectories), with crossing conflicts considered as having a significantly higher severity than converging or diverging conflicts (FHWA, 2010).
In order to illustrate the method of determination of conflict points, the latter are presented for both 3-way intersections (“Y-intersections” and “T-intersections”) as well as standard 4-way intersections. Subsequently, the conflict points for 3-branch and 4-branch roundabouts are studied in order to highlight the change in conflict points following roundabout conversion. In the defined scenarios shown in the following sections, traffic is considered to flow in both directions for every approach.
Figure 3.1: Project Methodology Flowchart Video Data Road user detection and tracking Trajectory database Homograph y Draw Alignments and Analysis Zone
Satellite Image Camera View
Draw Conflict Points
Determination of Conflict Point Chains
for all possible vehicle movements List of conflicting movement pairs Video Analysis – SSM analysis Movement analysis (MA module) Analysis of intersection geometry Draw Theoretical Vehicle Trajectories # of user pairs per conflicting movement pair (.csv files) Speeds, TTC15, Collision point densities (.csv and .png files) Denotes Automated Process Denotes Manual Process Denotes Input Data
Legend:
Denotes Output Data (file type)3.1.1 General Case – 3- and 4- way intersections
Figure 3.2 below illustrates the general case of a 3-way (standard “Y intersection”), including the corresponding conflict points and vehicle trajectory prototypes. All three types of conflict points (mentioned above) can be found in every intersection, and are detailed in the legend (crossing conflicts in red, converging conflicts in brown, and diverging conflicts in black).
Figure 3.2: Three-way intersection (“Y intersection”) with associated conflict points Observation of the different conflict points in Figure 3.2 points to a recurring motif. For every trajectory (vehicle trajectories are illustrated in blue in Figure 3.2), there are two different conflict point chains. A conflict point chain is characterised as a set of conflict points potentially encountered by a road user along a given movement. For every approach in the intersection, the left-turn manoeuvre contains a chain of four conflict points, in the following order: a diverging conflict point, followed by two crossing conflict points (crossing conflicts in this situation occur only between left-turning vehicles – a geometrical exception being the “T-intersection” where one approach doesn’t have a left-turn as it instead becomes a straight movement).
In the event of right-turning vehicles, a second type of conflict point chain occurs, consisting of a diverging conflict followed by a converging conflict point.
Thus, an intersection containing three approaches (regardless of “Y-intersection” or “T-intersection” geometry), comprises nine conflict points (three of each type – as illustrated in Figure 3.2 above) in total. However, geometrical attributes of intersections may vary as is the case when traffic is forbidden in one direction in one or several approaches (see Section 4.1). In those cases, both the number and the position of conflict points may vary.
Analysing standard four-way intersections follows the same logic as what has been presented for three-way intersections. However, the additional branch creates many more conflict points (mostly crossing conflict points), as is shown in Figure 3.3.
Figure 3.3: Conflict points in a four-way intersection (FHWA, August 2004)
Figure 3.3 shows a total of thirty-two conflict points, sixteen of which are crossing conflict points, with eight merging and eight diverging conflict points (two of each type in every approach). Once again, one can distinguish the conflict point chains associated with the different vehicle trajectories. For vehicles going straight-ahead and for left-turn manoeuvres, the conflict point chains are identical: two diverging conflict points, followed by four crossing conflict points and two converging conflict points. Right-turn manoeuvres are a simple chain comprised of a diverging
conflict point and a converging conflict point in that order. Given a symmetrical four-way intersection such as the one pictured in Figure 3.3, these chains apply to every single approach. Of course, not all four-way intersections are designed with one lane and all permitted movements for all the approaches. Depending on the number of lanes in each approach, and the allowed movements for each lane, the conflict point diagrams can vary from the diagram in Figure 3.3. An example of such an occurrence is illustrated in the second case study (see Section 4.2).
3.1.2 General Case – 3-Branch Roundabout
In order to establish a before-after comparison, the evaluation of conflict points in the implemented roundabout is a necessary step in terms of comparative safety analysis once the conflict points for the initial intersection geometry have been determined.
The overall configuration of a roundabout is fundamentally different from that of a standard intersection. The conflict points in a roundabout with three branches are shown in Figure 3.4 below.
Figure 3.4: Conflict points in a 3-branch roundabout (NCHRP, Report 672, 2010)
By observing Figure 3.4, it is noticeable that both the number of conflict points as well as their severity is reduced in a three-branch roundabout as opposed to a three-way intersection. One of the main factors in this change is the fact that traffic flow within a roundabout only takes place in one direction, as opposed to the two directions in a standard intersection. This ensures elimination of crossing conflicts.
There are only six conflict points in a three-branch roundabout; the conflict point chain (defined in the previous sub-section) consists only of alternating converging and diverging conflict points. The analysis of ODs within both types of intersections in a later part of this chapter will associate the various conflict point chains to the different manoeuvres in each type of intersection or roundabout.
3.1.3 General Case – 4-branch roundabouts
Figure 3.5: Conflict points in a four-branch roundabout (NCHRP Report 672, FHWA, 2010) As is shown in Figure 3.5 above, there are significantly fewer conflict points in a four-branch roundabout than in a four-way intersection, with only eight conflict points as opposed to thirty-two in a standard four-way intersection (as was shown in Figure 3.3). In a perfectly symmetrical roundabout like the one shown above, one can clearly see that the conflict points are separated into four sets of two conflict points, all pairs of Merging and Diverging conflict points. This illustrates the fact that each approach of a roundabout leads to the creation of “merging zones”.
3.2 Movement Analysis
The analysis of conflict points, as described in the previous section, can give a preliminary appreciation of areas where collisions have a higher probability of occurring as well as their potential severity, for both types of intersections. As soon as a road user goes through one of these
areas, he/she encounters several conflict points within a given movement, according to the type of area.
In order to evaluate the overall safety of one infrastructure as opposed to another, it is important to consider the number of conflict points a given road user encounters within an infrastructure, as a means of identifying the critical movements (i.e. the movements with increased risk of collision) within the initial intersection and, subsequently, the converted roundabout. Therefore, beyond the study of individual conflict points, movement analysis is a tool for safety analysis and understanding why safety may change after roundabout conversion.
3.2.1 Analysis of Conflict Point Chains
There are several steps to undertake for movement analysis; the first objective is to determine the number of conflict points for identified movements (a movement being defined as a manoeuvre completed between a given approach and a corresponding exit within an intersection), both pre- and post- roundabout conversion, with a view of comparing the number and types of conflict points for comparable movements.
Firstly, all possible movements within both types of infrastructures need to be defined, by OD pairs. Defining these movements requires knowledge and analysis of the intersection geometry, along with allowed directions of traffic, as well as the number of lanes. Thus, for an intersection/roundabout with three bidirectional branches, there are six (nine, including U-turns) possible vehicle movements, while there are twelve for an intersection/roundabout with four bidirectional branches. The identification of possible conflict point chains and the exposure to different conflict points for road users is used to identify the potential for dangerous situations for every OD pair within a given infrastructure – in this case, applied to both the initial intersection and converted roundabout.
To help structure the analysis, the origins/destinations for both the intersection and the roundabout can be numbered. Here, the numbering of the alignments (see illustrations and applications in Sections 4.1 and 4.2) is used to number the movements within each intersection.
Once the vehicle movements are defined (and illustrated), conflict points are extrapolated from the allowed (theoretical) vehicle movements, as per the three different types of conflict points (diverging, converging, crossing). Conflict point diagrams (as previously presented in Figure 3.2:
Three-way intersection (“Y intersection”) with associated conflict points to Figure 3.5) are drawn as an aid for visual comparison.
Obtaining the different conflict point chains, as was introduced earlier, involves listing, for every OD pair within the given intersection/roundabout, the different conflict points in the order in which a road user would encounter them. The different chains can then be listed in a table, as is shown in Table 3.1 below, per the origin of a road user, for both types of infrastructures, as an example. N.B: A roundabout’s design enables a U-turn manoeuvre, something which is not always permitted in a standard intersection according to provincial or state Highway Codes. Therefore, in order to guarantee a comparison between these two very different kinds of intersections, the possible option of making a U-turn is not considered. 2.57 % of 7 115 motorists for the first case study, and 0.03% of 15 464 motorists for the second case study made U-turns at the converted roundabouts.
Table 3.1: Comparison of conflict point "chains" - 4-way intersection vs. 4-branch roundabout3
If the studied intersection differs in any way from the general case (whether it be a three-branch or a four-branch intersection), the number and type of conflict points can differ from what is presented in Table 3.1. It is also possible that the intersections and roundabouts contain more than one lane, in which case the roundabout may contain crossing conflict points – the number of conflict points in general will increase, as will the number of possible movements.
3 Crossing conflict points are highlighted in red due to their increased severity
Intersection Roundabout
Left-Turn Diverging (2x)-Crossing
(4x)-Converging (2x)
(Converging-Diverging) (3x)
Straight Movement Diverging (2x), Crossing (4x), Converging (2x)
(Converging-Diverging) (2x)
The roundabout (generally) eliminates crossing conflict points, which are replaced by diverging and converging conflict points instead, due to the intrinsic geometrical characteristics of those infrastructures. The roundabout forces road users to follow the same trajectory, in one common direction, as opposed to an intersection, which allows for vehicle trajectories to cross each other, and in turn creates crossing conflict points.
Right-turn manoeuvres are identical for both infrastructures in terms of conflict point severity, with one converging and one diverging conflict point in the trajectories of right-turning road users. However, there are significant differences for straight and left-turn manoeuvres, with eight conflict points (including four crossing conflict points) involved in standard four-way intersections. Roundabouts, for straight and left-turn manoeuvres, are responsible for four and six conflict points respectively, all being of either converging or diverging types.
Applying the same logic for four-way intersections/four-branch roundabouts to three-way intersections/three-branch roundabouts, one can make similar remarks concerning expected roundabout safety.
3.2.2 Movement Analysis in the context of before-after analysis studies
While an analysis approach making use of conflict point chains can provide an indication of infrastructure dangerousness, it is solely used in this research project for two purposes: firstly, as an identification of various hotspots where road users have increased likelihood to be involved in dangerous traffic events, secondly to compare different possible vehicle movements between each type of infrastructure involved in the case studies. In short, conflict point analysis is used as a preliminary analysis prior to the other methods presented in this chapter.
As was briefly described earlier in the chapter, the aim of movement analysis is to aggregate the number of observed user pairs (defined as a pair of road users which coexist within a given, finite distance and time frame) (St-Aubin, 2016) between OD pairs existing both in the initial intersection and the converted roundabout.
Movement analysis, as defined in this research project, rests on the comparison of the number of user pairs. The latter are defined as instances during which two road users co-exist closely in space, usually within a distance where evasive action may be needed to avoid a potential collision. The
goal is therefore to determine the number of user pairs, for specific ODs, defined according to the intersection geometry and conflict analysis.
Depending on the infrastructure geometry (number of lanes, allowed movements), correspondence between movements is not always exact; i.e. a given movement in one intersection setup can correspond to several movements in the corresponding converted roundabout, and vice versa. This may happen when the number of lanes (for an approach/exit for example) changes after roundabout conversion. In this case, the number of user pairs can be combined to obtain a comparison between the two different geometries.
In some cases, movements that do not exist in one intersection setup become possible after roundabout conversion, as is the case in the Intervale case study (Section 4.1). This limits the scope of the movement analysis as fewer movements can be compared. Such situations are therefore not considered in the scope of movement analysis.
As defined in earlier sections, the main method of data collection for this research project is the placement of cameras to record video data of road users. The data analysis takes place using computer vision tools which are used to detect road users based on their physical attributes, and to extract relevant information for use in road safety analysis. A specific function is developed as part of the project to allow for movement analysis and comparison between the initial intersection and the converted roundabout.
Movement analysis is prepared using the following:
1. The intersection geometry (before and after roundabout conversion) – including the alignments and their identification labels.
2. Conflict diagrams for validation of movement comparability 3. Conflict analysis and definition of comparable movements
4. Video analysis using the Traffic Intelligence and tvaLib software tools, which output speeds and TTC distributions
5. Creation of the Movement Analysis (MA) module for the tvaLib software – coded using Python 2.7.