UNIVERSITÉ DE MONTRÉAL
UNDERSTANDING OZONE MECHANISMS TO ALLEVIATE CERAMIC
MEMBRANE FOULING
IRMA GIOVANNA LLAMOSAS CHU
DÉPARTEMENT DES GÉNIES CIVIL, GÉOLOGIQUE ET DES MINES ÉCOLE POLYTECHNIQUE DE MONTRÉAL
MÉMOIRE PRÉSENTÉ EN VUE DE L’OBTENTION DU DIPLÔME DE MAÎTRISE ÈS SCIENCES APPLIQUÉES
(GÉNIE CIVIL) NOVEMBRE 2014
UNIVERSITÉ DE MONTRÉAL
ÉCOLE POLYTECHNIQUE DE MONTRÉAL
Ce mémoire intitulé:
UNDERSTANDING OZONE MECHANISMS TO ALLEVIATE CERAMIC
MEMBRANE FOULING
présenté par: LLAMOSAS CHU Irma Giovanna
en vue de l’obtention du diplôme de : Maîtrise ès sciences appliquées a été dûment accepté par le jury d’examen constitué de :
Mme PRÉVOST Michèle, Ph. D., présidente
M. BARBEAU Benoit, Ph. D., membre et directeur de recherche M. BÉRUBÉ Pierre, Ph. D., membre et codirecteur de recherche M. HAUSLER Robert, Ph. D., membre
DEDICATION
To my parents, Margot and Javier, for their invaluable caring and unconditional support …
ACKNOWLEDGEMENTS
This work was supported by NSERC-Industrial Chair in Drinking Water Treatment, which is funded by the City of Montreal, John-Meunier Inc. and the City of Laval.
My appreciation also goes to:
My Director, Benoit Barbeau, for his infinite patience, good sense of humour, and precious technical advices …
The technical staff at the Chair, for their valuable advices and professional work, besides … Mireille Blais & Yves Fontaine, for their support with the set-up and water collection; Julie Philibert, for the pCBA analysis, Jacinthe Mailly, for the COD analysis, Marcellin Fotsing for the metal traces analysis.
My co-director, Pierre Bérubé, and the technical staff and post-graduate students from UBC, who supported this work with their technical advices and the SEC-analysis.
The students and interns from the Chair on Drinking Water (Félix, Hadis, Laleh, Vanessa, Kim, Evelyn, Mathieu, Stéphanie, Marie Claude, Loreto, Celso, Jasdeep, Ehsan, Mouna, Émile, Daniel, Charlène, Hélène, Mai, Cédric) and from the Waste Water Department (Jaime, Bettina, Dominic, Kunaal, Félix, Karim, Reza, Sanaz, Hadi): for their company and support, for their diversity and good-sense of humour. You greatly eased the work in the lab and my time at Poly …
To my parents Margot & Javier, my sisters Silvia & Mónica, my brothers Javier & Dante, and also to my friends, who were always by my side, whatever my decisions …
RÉSUMÉ
Les membranes céramiques représentent une perspective intéressante comme traitement de pointe dans le domaine de l'eau potable. Cependant, le coût de capital élevé et l'absence de recherche spécifique sur la performance de ces membranes diminuent leur utilisation dans ce domaine. Ainsi, sachant que le colmatage est la principale limite connue dans les procédés de filtration, cette étude à l'échelle laboratoire visait à évaluer l'impact d'un pré-traitement d’ozonation sur la réduction du colmatage des membranes céramiques UF. Les étapes de pré-ozonation et de filtration ont été réalisées en utilisant deux pH ainsi que des doses d’ozone différentes. Les valeurs de pH choisies étaient situées à la limite de la plage naturelle des eaux de surface (6,5 et 8,5) afin de garantir la praticabilité. L'eau brute de la rivière des Mille Îles à Québec-Canada a été utilisée. Le montage de filtration était composé d’une cellule de filtration frontale non agitée opérée à flux constant. Les résultats ont montré que la pré-oxydation par l'ozone réduit effectivement le degré de colmatage de la membrane en fonction de la dose appliquée (jusqu'à 60 et 85% pour les membranes 8 et 50 kDa, respectivement). L’oxydation directe de la MON a été jugée responsable de cet effet étant donné que la présence d’'ozone moléculaire n’était pas indispensable pour obtenir ces résultats. Cependant, dans le cadre de cette expérience, le pH s’est montré plus efficace que le pré-traitement à l'ozone pour maintenir le colmatage à de faibles taux: 70% inférieur à pH 6,5 qu'à pH 8,5 pour les eaux non-ozonisées, ce qui est contraire à la plupart de la littérature trouvée sur le sujet (Changwon, 2013; De Angelis et Fidalgo, 2013; Karnik et al., 2005; S. Lee & Kim, 2014). Ce comportement s’explique principalement par le mode d’opération utilisé dans l'expérience, les répulsions électriques entre les molécules de MON à pH basique qui ont conduit à l'accumulation de matériau sur le côté d’alimentation de la membrane (concentration polarisation), et finalement la formation d'un gâteau. En outre, le pH de la solution d’eau a montré une influence sur la définition des mécanismes de colmatage. Avec l’échantillon d’eau à pH 6,5, qui correspond précisément au point isoélectrique des membranes (±6,5), le mécanisme de colmatage par blocage a été fréquemment détecté avant la formation d'un gâteau. Ces observations mettent en évidence le rôle important des charges électriques dans les procédés de filtration avec des membranes céramiques (Chiu, 2011; S. Lee & Kim, 2014; Szymczyk, Fievet, Reggiani, et Pagetti, 1998b).
En ce qui concerne l'ozonation, il a été confirmé que les eaux naturelles à forte teneur en MON(> 3 mg / L) déclenchent des procédés d'oxydation avancés (Acero et Von Gunten, 2001). Il a également observé que la condition de pH 6,5 a permis la décomposition de la MON de manière plus efficace que la dose d’ozone la plus élevée utilisée à pH 8,5.
ABSTRACT
Ceramic membranes are a strong prospect as an advanced treatment in the drinking water domain. But their high capital cost and the lack of specific research on their performance still discourage their application in this field. Thus, knowing that fouling is the main drawback experienced in filtration processes, this bench-scale study was aimed to assess the impact of an ozonation pre-treatment on the alleviation of the fouling of UF ceramic membranes. Pre-ozonation and filtration steps were performed under two different pH and ozone doses. Chosen pH values were at the limits of natural surface waters range (6.5 and 8.5) to keep practicability. Raw water from the Thousand Isle’s river at Quebec-Canada was used for the tests. The filtration setup involved an unstirred dead-end filtration cell operated at constant flux. Results showed that pre-oxidation by ozone indeed reduced the fouling degree of the membranes according to the dose applied (up to 60 and 85% for membranes 8 and 50 kDa, respectively). Direct NOM oxidation was found responsible for this effect as the presence of molecular ozone was not essential to achieve these results. In the context of this experiment, however, pH showed to be more effective than the ozonation pre-treatment to keep fouling at low levels: 70% lower at pH 6.5 than at pH 8.5 for un-ozonated waters, which was contrary to most of the literature found on the topic (Changwon, 2013; De Angelis & Fidalgo, 2013; Karnik et al., 2005; S. Lee & Kim, 2014). This behaviour results mainly from the operation mode used in the experiment, the electrical repulsions between MON molecules at basic pH that led to the accumulation of material on the feed side of the membranes (concentration polarisation) and ulterior cake formation. In addition, solution pH showed an influence in the definition of fouling mechanisms. At solution pH 6.5, which was precisely the isoelectric point of the membranes (±6.5), the blocking fouling mode was frequently detected before the onset of a cake. These facts put in evidence the important role of electrical charges in filtration processes with ceramic membranes (Chiu, 2011; S. Lee & Kim, 2014; Szymczyk, Fievet, Reggiani, & Pagetti, 1998b).
In the ozonation side, it was confirmed that natural waters with high NOM content (>3 mg/L) trigger advanced oxidation processes (Acero & Von Gunten, 2001). It was also found that condition pH 6.5 showed higher NOM decomposition than condition pH 8.5 at the highest ozone dose used.
TABLE OF CONTENTS
DEDICATION ... III ACKNOWLEDGEMENTS ... IV RÉSUMÉ ... V ABSTRACT ...VII TABLE OF CONTENTS ... VIII LIST OF TABLES ... XI LIST OF FIGURES ...XII LIST OF ACRONYMS AND ABBREVIATIONS ... XIV LIST OF APPENDICES ... XV
INTRODUCTION ... 1
CHAPTER 1 LITERATURE REVIEW ... 4
1.1 Ozone role in the oxidation of NOM ... 4
1.1.1 Effect of pH ... 5
1.1.2 Effect of temperature ... 6
1.1.3 Effect of alkalinity ... 6
1.1.4 Effect of water inorganic/organic composition ... 7
1.1.5 Molecular O3 vs •OH radicals ... 8
1.1.6 Oxidation products ... 9
1.1.7 Measurement of ozone species ... 9
1.2 Ceramic membrane overview ... 11
1.2.1 Basic definitions ... 11
1.2.2 Ceramic membrane modules ... 14
1.2.4 Preparation ... 16
1.2.5 Chemical composition ... 17
1.2.6 Operation mode ... 19
1.2.7 Comparison of ceramic vs polymeric membranes ... 20
1.3 Principles of membrane fouling ... 21
1.3.1 Basic concepts ... 21
1.3.2 Factors influencing the fouling of membranes ... 24
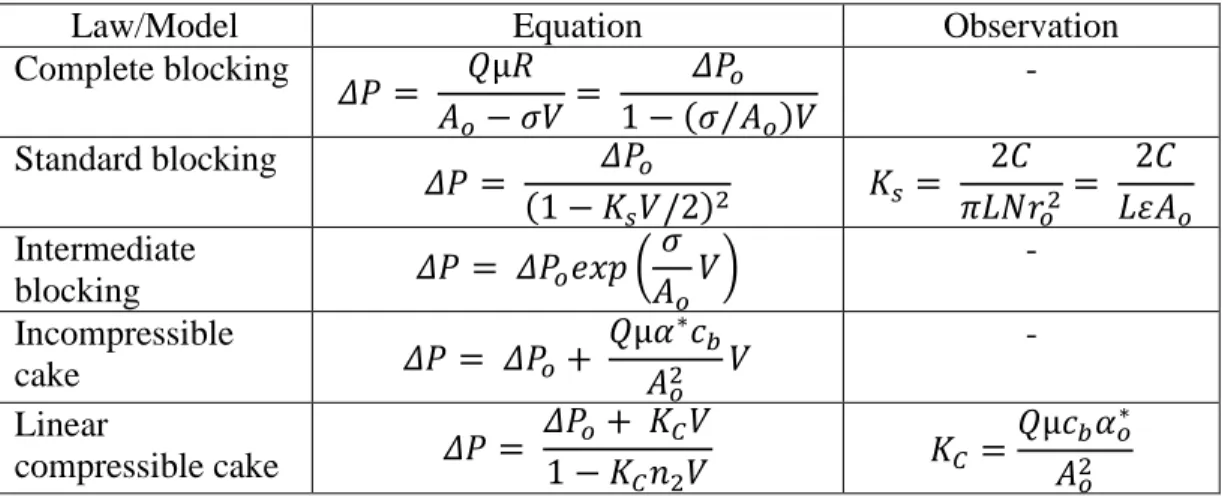
1.3.3 Filtration blocking laws ... 29
1.3.4 Fouling indices ... 33
1.3.5 Fouling control ... 35
CHAPTER 2 MATERIALS AND METHODS ... 38
2.1 Water sampling and preparation ... 39
2.1.1 Sample collection and analysis ... 39
2.1.2 Sample conditioning and analysis ... 39
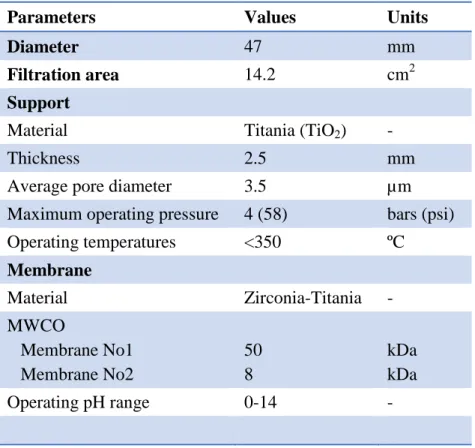
2.2 Membranes characterization and conditioning ... 42
2.3 Ozonation procedure ... 43
2.4 Filtration procedure ... 46
CHAPTER 3 RESULTS ... 50
3.1 Ozonation process characterization ... 50
3.1.1 Molecular ozone vs free radicals ... 50
3.1.2 Impact of ozone on NOM characteristics ... 52
3.2 Filtration process characterization ... 54
3.2.1 Initial membrane permeability measurements ... 54
3.2.2 Pre-ozonation impacts on ceramic membranes performance ... 55
3.2.4 Fouling index ... 61
CHAPTER 4 DISCUSSION ... 63
CONCLUSIONS ... 66
BIBLIOGRAPHY ... 68
LIST OF TABLES
Table 1.1: Oxidation potential for oxygen species ... 4
Table 1.2: Membrane types and characteristics ... 11
Table 1.3 : Water flux (LMH, P : ±10atm) through γ-alumina, zirconia and titania membranes .. 19
Table 1.4: Comparison of ceramic versus polymeric membranes ... 20
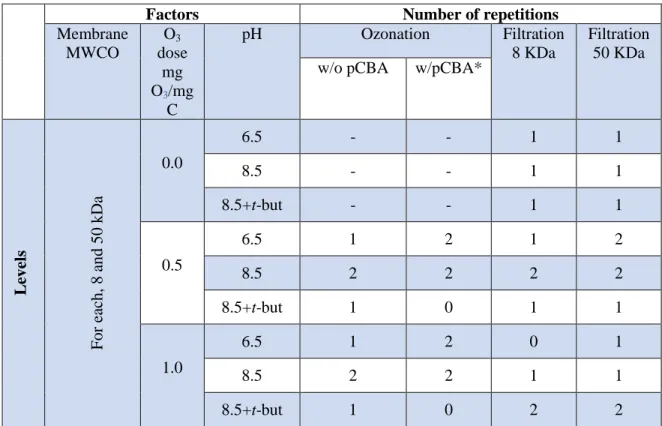
Table 2.1: Experimental matrix ... 39
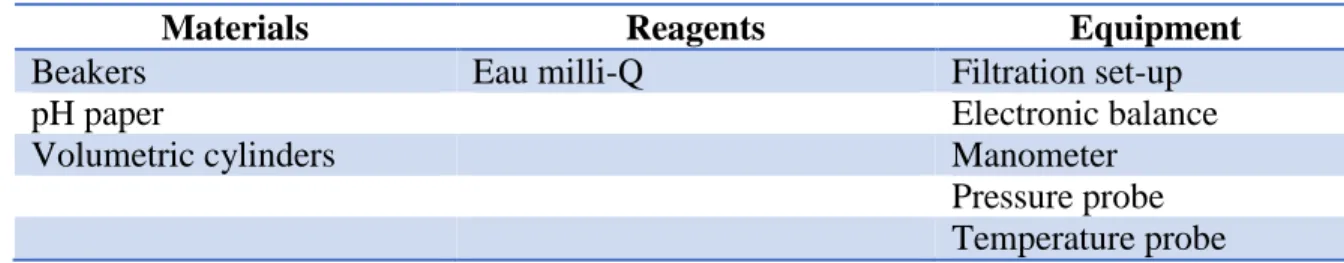
Table 2.2: Materials, reagents and equipment to adjust physical-chemical properties ... 40
Table 2.3: Characteristics of the water sample: raw, micro-filtrated & pH-conditioned ... 41
Table 2.4: Tami ceramic membranes characteristics ... 42
Table 2.5: O3 doses applied to the water samples ... 43
Table 2.6: Materials, reagents and equipment for ozonation ... 43
Table 2.7: Materials, reagents and equipment for ultrafiltration ... 48
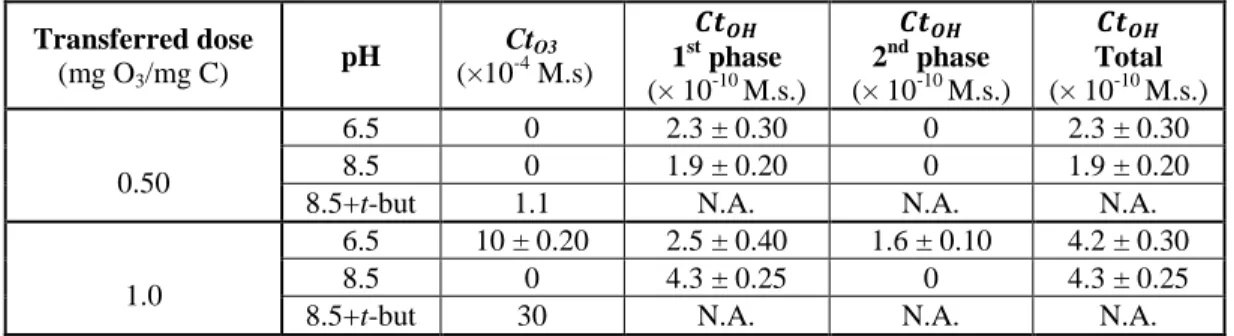
Table 3.1: Calculated molecular ozone (CtO3) and free hydroxyl radical (CtOH) exposures under various ozonation conditions (n=1.0-2.0, typical or average values, errors: 1 std dev) ... 52
Table 3.2: NOM characteristics before and after ozonation treatment ... 53
Table 3.3: Typical DOC removal (%) by the hybrid ozonation-filtration treatment ... 56
LIST OF FIGURES
Figure 1-1: Ozone decomposition pathway in the presence of NOM ... 5
Figure 1-2: Evolution of channel geometries & arrangements: circular, floral, honeycomb ... 15
Figure 1-3: Images of a hollow fiber (left) and a capillary (right) ceramic membrane ... 15
Figure 1-4 : Assymetric structure : a) titania; b) zirconia; c) alumina ceramic membranes ... 15
Figure 1-5: Ceramic membranes pore shapes: a) bottleneck, b) slit shape, c) cylindrical shape ... 16
Figure 1-6 : Filtration laws for dead-end mode : a) cake filtration, b) intermediate blocking, ... 23
Figure 1-7: Graph for pressure variation in constant flux, dead-end filtration ... 32
Figure 1- 8: Typical fouling graph for constant pressure filtration ... 34
Figure 2-1: Overview of the experimental pathway ... 38
Figure 2-2: Schema for the ozonation set-up ... 44
Figure 2-3: Pictures of the ozonation set-up ... 44
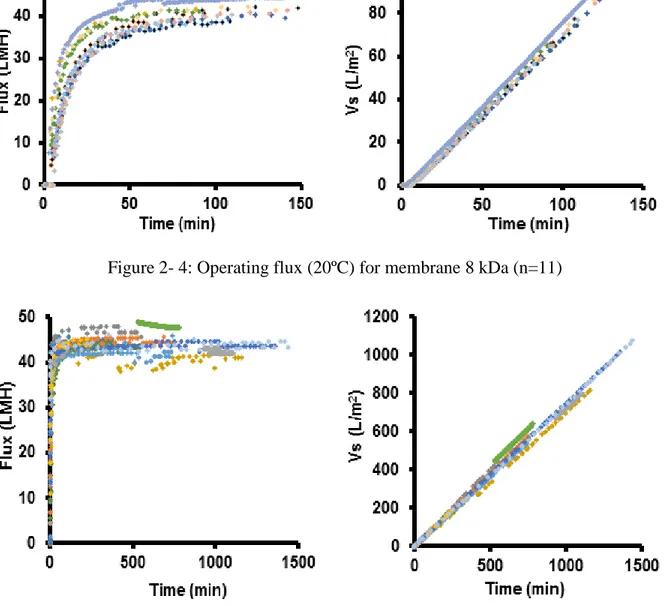
Figure 2- 4: Operating flux (20ºC) for membrane 8 kDa (n=11) ... 47
Figure 2-5: Operating flux (20ºC) for membrane 50 kDa (n=12) ... 47
Figure 2-6: Schema for the ultrafiltration process ... 48
Figure 2-7: Picture of the ultrafiltration set-up ... 48
Figure 3-1: Typical profiles of molecular ozone vs time (n=1.0-4.0, doses (D) in mg O3/mgC) .. 50
Figure 3-2 : pCBA decomposition graph ... 51
Figure 3-3: Rct graph ... 51
Figure 3-4: Typical reductions in NOM aromaticity for the various conditions (normalized dosages and pH) ... 54
Figure 3-6: 50 kDa membrane initial permeability (20ºC, milli-Q water) ... 55 Figure 3-7: Total UVA254 removals (%) by hybri ozonation-filtration treatments ... 56
Figure 3-8: UVA254 removals by 8 and 50 kDa ceramic membranes for variable pre-ozonation
treatment conditions ... 57 Figure 3-9: Colour (436 nm) removal (%) by hybrid ozonation-filtration treatment ... 57 Figure 3-10: Typical fouling behaviour of membrane 50 kDa (n=1.0, duplicatas in Appendix O) ... 59 Figure 3-11: Typical fouling behaviour of membrane 8 kDa (n=1.0, duplicatas in Appendix O) 59 Figure 3-12: Typical fouling index trends according to the initial pH of membranes and feed
water (n=1.0) ... 60 Figure 3-13: Typical UVA254 and COD abatements trends wrt the initial pH of membranes and
feed water (n=1.0) ... 60 Figure 3-14: UMFI x 10-4 [m2/L] comparison for 8 and 50 kDa membranes ... 61
LIST OF ACRONYMS AND ABBREVIATIONS
AOP Advanced Oxidation ProcessCP Concentration Polarization DOC Dissolved Organic Carbon NOM Natural Organic Matter
FA Fulvic Acid
HA Humic Acid
HMW High Molecular Weight
HS Humic Substance
J Flux
Js Permeability
LMW Low Molecular Weight
MF Microfiltration
MW Molecular Weight
NF Nanofiltration
O3 Ozone
•OH Hydroxyl free radical pCBA para-cholorobenzoic acid
Ri Membrane Rejection
TMP Transmembrane Pressure UF Ultrafiltration
LIST OF APPENDICES
Appendix A: Calculation examples to prepare buffers and adjust pH, alkalinity and ionic strength
of the water sample ... 75
Appendix B: Characteristics of the water sample: raw data ... 78
Appendix C: Procedure to measure the ozone gas production ... 79
Appendix D: Validation of the O3 gas production measurement ... 81
Appendix E: Validation of the procedure to ozonate the water ... 83
Appendix F: Validation of the O3 gas dosage and monitoring ... 84
Appendix G: Homogeneity of the reactor's sample solution... 86
Appendix H: Sample ozonation example: steps, data & calculations ... 87
Appendix I: Procedure for washing ceramic membranes ... 93
Appendix J : Validation of the procedure to filtrate the water sample ... 95
Appendix K: Validation of set-ups and filtration operating conditions ... 96
Appendix L: Filtration example: data & calculations ... 97
Appendix M: Percentage abatement of DOC and UVA after ozonation and filtration (wrt to original sample) ... 99
Appendix N: Ozonation experiments-raw data ... 100
INTRODUCTION
As a result of their exceptional mechanical, chemical and thermal resistances, ceramic membranes have been sustainably expanding their application scope. Yet, despite their widespread use in industry (wastewater, pharmaceutical, chemical, metals, food, beverage, pulp and paper, etc.) (Sondhi, Bhave, & Jung, 2003), this technology is not as popular in the drinking water industry, mainly due to the high capital costs associated with their installation in comparison to the widely available polymeric membranes (Freeman & Shorney-Darby, 2011). However, significant ongoing efforts are looking at counteracting this trend as the industry works on lowering the costs of this technology and as the few large-scale ceramic applications available in the world are demonstrating superior operational performance (Freeman & Shomey-Darby, 2011). Besides their remarkable capacity in removing microscopic parasites and molecules, ceramic membranes are proving longer lifetime than polymeric membranes and very low frequency of breakdowns (Freeman & Shomey-Darby, 2011). They also offer the possibility of operating at higher pressures, and the feasibility of cleaning with harsher physical-chemical methods. As a consequence, a higher productivity and improved process stability could be achieved (Freeman & Shorney-Darby, 2011).
One important challenge of any filtration technology is fouling, which is defined as the decrease in water throughput across, in this case the membrane, caused by the deposit of material on or within its structure. For the drinking water production, the main fouling material is the natural organic matter (NOM) and numerous other factors affect fouling, including membrane characteristics and membrane operating conditions (Zularisam, Ismail, & Salim, 2006). A profuse scientific literature has addressed the fundamental understanding of the impacts of water quality, membrane characteristics and operation on fouling. However, most of the research has been directed to polymeric membranes (Howe & Clark, 2002; Kimura, Hane, Watanabe, Amy, & Ohkuma, 2004; N. Lee, Amy, Croué, & Buisson, 2004; Shao, Hou, & Song, 2011), or ceramic membranes in industrial applications. Thus, there is an urgent need to better understand fouling of ceramic membranes in the context of potable water treatment in order to further encourage their application. Fundamental studies include (Munla, 2012) who looked into the identification of reversible and irreversible fouling agents on UF ceramic membranes and (S. Lee & Kim,
2014) who compared the fouling of polymeric vs ceramic UF membranes. In addition, different strategies have been studied to control ceramic membrane fouling. These involve modification of membrane surfaces, physical-chemical cleaning, manipulation of operating parameters and feed-water pre-treatment. On the latter topic, coagulation prior to MF/UF ceramic filtration is the most discussed subject in literature (Chang, Liu, Luo, & Li, 2014; Dong, Chen, Gao, & Fan, 2007). Other pre-treatments prior to UF ceramic membranes like the use of ion-exchange resins (Kabsch-Korbutowicz & Urbanowska, 2010) or the application of ozonation and adsorption methods (Fan et al., 2014) have received less attention, evidencing the gaps and research opportunities to be overlaid in this area. Amongst the different pre-treatment strategies that have been tested so far, the use of pre-ozonation is offering the most promising results as fouling reductions up to 50% have been shown (Van Geluwe, et al., 2011; Karnik, et al., 2005; Kim, et al., 2009; Lee, et al., 2005; Geismar, et al., 2011). In addition, the use of ozone ahead of ceramic membranes is possible due to their resistance to this oxidant while it is generally not advisable for polymeric membranes as only polymeric crystalline PVDF membranes have been shown to support the contact with ozone (Hashino, et al., 2000). Recently, van Geluwe et al. (2011) have reviewed the role of ozone on alleviating fouling by NOM. The importance of the immediate ozone demand was highlighted as the direct O3 reaction with NOM in the first seconds of ozone
injection also produces oxidation conditions equivalent to an advanced oxidation process (AOP). This conclusion opens up the following research question: is it necessary to maintain ozone residual in contact with the membrane or is overcoming the immediate ozone demand (which takes place in the first 15 seconds) sufficient to achieve the goal of reducing fouling? In the case that most of the fouling reduction occurs during immediate ozone demand, it would be of interest to assess if this is mostly the result of free radicals oxidation or direct NOM oxidation by molecular ozone. The general objective of this study was to understand the fundamental role of an ozone pre-treatment in reducing the fouling of ceramic membranes used for drinking water production. More specifically, the following objectives were sought:
1. Assess the reduction of fouling gained under various ozonation regimes induced by varying the ozone dosages, the pH of ozonation and the concentration of free radicals/ scavengers. This will be achieved by: a) measuring the ozonation effect on the organic matter (COD, UVA254, size) of the water sample; b) identifying the role of each ozonation regime on the
changes of the water quality; c) evaluating the pH effect over the ozonation effectiveness in reducing fouling.
Research hypothesis: Most of the fouling reduction is achieved due to the action of hydroxyl free radicals. Therefore, increasing pH of ozonation will lead to higher free radicals formation and, consequently, lower membrane fouling.
2. Compare the fouling behavior of UF ceramic membranes of two molecular weight cu-toffs (8 and 50 kDa)
Research hypothesis: A higher fouling index due to size screening (pore blocking) is expected for the 8 kDa membrane. Electrostatic effects are expected to be more important for the 50 kDa membrane.
This work is composed of two main sections. The first one (section 3.1) deals with the ozonation process, in which three ozone doses (0.0, 0.5 and 1 mg O3/mg C) were applied at three
different pH conditions (6.5, 8.5, and 8.5+t-butanol) to a surface water sample. Physical-chemical and SEC analysis of the pre and post-ozonated waters were performed. The second part (section 3.2) comprehends the ultrafiltration process, where the previous samples were filtrated through 8 or 50 kDa ceramic membranes. Besides the physical-chemical and SEC analysis, the fouling mechanisms and fouling index were also investigated.
CHAPTER 1 LITERATURE REVIEW
This chapter will first review the chemistry of ozone with respect to its impact on NOM. Current knowledge on membrane fouling will be also summarized.
1.1 Ozone role in the oxidation of NOM
Ozone (O3) is recognized as a highly reactive molecule; in fact, one of the strongest
oxidants known, as shown in table 1.1:
Table 1.1: Oxidation potential for oxygen species
Extracted from (Beltrán, 2004; Gottschalk, Libra, & Saupe, 2010) Species Standard redox Potential O2 1.23 V O3 2.07 V •OH 2.80 V
As a consequence, O3 is an unstable molecule that decomposes rapidly in water
containing natural organic matter (NOM) by passing through two stages: a) a first and very fast drop (first 30-120 s of contact) (M. Elovitz & Von Gunten, 1999), which exhibits a pseudo first order kinetics (38-106 µM/min has been reported by (Westerhoff, Aiken, Amy, & Debroux, 1999) at pH 7.5, which accounts for approximately 60% of O3 decomposition. For comparison, in
the absence of NOM, the O3 decomposition is about 25% at the same pH; b) a second smooth
phase where O3 decays with first order kinetics in which by-products of the first phase and
slow-reacting NOM compounds are believed to react (Von Gunten, 2003; Westerhoff, et al., 1999). The kinetics of this decomposition depends on temperature and characteristics of the water matrix (pH, alkalinity, component’s type and concentration,), so that it can last from seconds to hours (Von Gunten, 2003). The decomposition products include the formation of •OH radicals (radical chain mechanism), which constitutes a unique feature of O3 (Von Gunten, 2003). This radical
chain can be divided in three phases: initiation, propagation and termination, which involve the presence of initiators, promoters or scavenger agents, which trigger, enhance or stop the radical mechanism, respectively (Gottschalk, et al., 2010).
Thus, as depicted in figure 1-1, O3 oxidizes organic material through the action of
molecular O3, •OH radicals (radical chain reactions), or a combination of both (Von Gunten,
2003). Factors such as pH and type/concentration of organic matter determine the mode of action that will prevail.
Figure 1-1: Ozone decomposition pathway in the presence of NOM Adapted from (Staehelin & Hoigné, 1985)
1.1.1 Effect of pH
In pure water, OH- ions trigger O3 decomposition (autocatalysis), so that at basic pH the
reaction is faster (Mizuno, 2007; Staehelin & Hoigné, 1985). In fact, Mizuno (2007) reported that the decomposition reaction can be 5 times faster with the increase of 1 unit of pH. For waters containing NOM in high concentrations (˃3 mg C/L) the effect of pH is actually unknown, but a trend for higher efficiency at basic pH is recognized due to enhanced de-protonation of NOM (Buffle, Schumacher, Meylan, Jekel, & Von Gunten, 2006).
The reactions involved in the decomposition of O3 in pure water due to pH are described
O3 + OH- → HO2- + O2, k = 70 M-1s-1
O3 + HO2- → •OH + •O2- + O2, k= 2.8x10⁶ M-1s-1
O3 + •O2- → •O3- + O2, k = 1.6x10⁹ M-1s-1
pH ≤ 8:
•O3- + H+ ↔ •O3H, where kf = 5×10¹⁰ M-1s-1 and kr = 3.3×10² s-1
•O3H → •OH + O2, where k = 1.4×10⁵ s-1
pH ≥ 8:
•O3- ↔ •O- + O2, where kf = 2.1×10³ s-1 and kr = 3.3×10⁹ s-1
•O
+ H2O → •OH + OH-, where kf = 108 s-1
•OH + O3 → •O2H + O2, k= 1x10⁸ M-1s-1 to 2x10⁹ M-1s-1
This last reaction becomes important in waters with low dissolved organic carbon (DOC) and low alkalinity, as it consumes both oxidative species: ozone and •OH radicals. This reduces the oxidation capacity of the system (Von Gunten, 2003).
1.1.2 Effect of temperature
O3 decomposition is enhanced with increasing temperatures. Mizuno (2007) reported an
increase of 2.2 times the reaction rate for a 5ºC increase in temperature while working at environmental conditions (15-30ºC).
1.1.3 Effect of alkalinity
The carbonate/bicarbonate is the most common buffering system found in natural waters. Carbonate and bicarbonate compounds are known for scavenging the •OH radicals, showing reaction rates of 4x10⁸ M-1s-1 and 2x10⁷ M-1s-1, respectively (Staehelin & Hoigné, 1985). As a consequence, an ozonation system tends to lose oxidation capacity if they are present in high quantities (Von Gunten, 2003). In addition, phosphate ions react slowly with •OH radicals and may act as scavengers (or sometimes as promoters) (Staehelin & Hoigné, 1985), depending on their concentration in the water matrix (Mizuno, 2007).
1.1.4 Effect of water inorganic/organic composition
O3 reacts with inorganic and organic compounds that can accelerate or slow down O3
decomposition. The reactions of •OH radicals with inorganic compounds are considered rather fast (rates of 107-109 M-1s-1); whereas molecular ozone reactions tend to be slower, with second order rates between 1 to 109 M-1s-1. These reactions involve the transfer of an oxygen atom (Von Gunten, 2003).
As for organic compounds, NOM reacts also directly with molecular O3 or indirectly with
•OH radicals:
when NOM reacts directly with ozone it can follow two pathways: to be oxidized (O3 +
NOM → NOMox) or to form ozonide radicals (O3 + NOM → NOM•+ + •O3-). Ozonide
then becomes the initiator of the radical chain (similar to the role of OH- ions in pure water). These two reactions are observed in the presence of double bond compounds, activated aromatic rings, amines and sulfides. Direct O3 reactions with organic saturated
compounds are very low (Von Gunten, 2003). Ozone reactivity is favoured at basic pH as DOM is deprotonated and more vulnerable to an electrophilic attack (Buffle, et al., 2006); when NOM reacts with the •OH radicals it promotes the radical chain reactions, generating even more radicals (Acero & Von Gunten, 2001), and thus increasing the oxidative capacity of the system. It was also reported that higher pH increases •OH radical production; although Buffle, et al. (2006) indicated that a plateau could be reached. In their experiment, the team observed this plateau was reached at pH 6.7, after which an increase to pH 7.9 did not increase importantly the amounts of •OH generated.
In summary, DOC can act as initiator, promoter (formic acid, methanol), or terminator – scavenger- (alkyl groups, t-butyl alcohol) of O3 decomposition and radical chain
reactions; although it is difficult to predict NOM behaviour in a water matrix due to the heterogeneity of its composition (Staehelin & Hoigné, 1985; Von Gunten, 2003; Westerhoff, et al., 1999).
1.1.5 Molecular O
3vs •OH radicals
Molecular O3 is very selective, and generally follows a second order kinetics when
reacting with other compounds. The rate constants are in the range of <0.1 M-1s-1 and 7x10⁹ M-1 s-1. Because of its electrophile character, ozone attacks mainly non-protonated amine groups, double bonds, and aromatic rings; although the reactivity depends on the type of chemical functional groups associated to the unsaturated moieties (Von Gunten, 2003; Westerhoff, et al., 1999). For example, the presence of a chlorine atom will significantly reduce the moiety reactivity.
•OH radicals are non-specific for their reaction with inorganic and organic matter. However, Westerhoff, et al. (1999) reported that organic double and triple bonds react faster than single bonds. The second order reaction kinetics vary in the range of 108-1010 M-1s-1 for large molecules, but has a wider distribution for smaller ones (Staehelin & Hoigné, 1985; Von Gunten, 2003; Westerhoff, et al., 1999). Reaction rates increase with increasing molecular weight; although a reaction upon an active site in the core of a large molecule is slow due to diffusion patterns (Westerhoff, et al., 1999). The presence of free radicals (•OH radicals) enhances mineralization (organic matter oxidized to CO2 and H2O), as molecular ozone is not able to do it
(Van Geluwe, Vinckier, Braeken, & Van der Bruggen, 2011). The high reactivity and non-specificity of •OH radicals grant them a very low life time, consequently very low concentrations are found with natural waters, typically ≤10-12
M (M. Elovitz & Von Gunten, 1999). Therefore, artificial tactics (raising pH, addition of H2O2, UV irradiation, etc.) need to be applied in order to
increase their concentration and keep them active (Von Gunten, 2003).
Systems in which •OH radicals dominate the oxidation reactions are called advanced oxidation processes (AOP). These are aimed for the decomposition of resilient molecules such as pesticides, hormones and chlorinated solvents; although it has been reported that the process is not actually efficient due to competition reactions for •OH radicals. This regime is commonly achieved by adding H2O2 to the water matrix, but it can also be attained by raising the pH,
irradiating with UV, etc. (Von Gunten, 2003). High concentrations of DOC in the water matrix (≥ 3 mg C/L) also generate an AOP regime, as NOM acts as a promoter, rendering a yield of one •OH radical per molecule of O3 consumed (Acero & Von Gunten, 2001), while in pure water the
Conversely, a system without •OH radicals can be attained by artificially adding a scavenger, for which butanol is most commonly used. When NOM is present, the addition of t-butanol does not prevent however the onset of the first phase of rapid O3 decomposition, but the
rate of reaction is lower than in the absence of t-butanol. This suggests the role of NOM as initiator and as a promoter of O3 decomposition (Westerhoff, et al., 1999).
1.1.6 Oxidation products
The oxidation products from the ozonation of NOM are compounds of lower molecular weight than the original molecules, although they are difficult to identify and predict (Lin & Hsien, 2011). O3 renders organic hydrophobic moieties into hydrophilic ones (carbonyl,
hydroxyl, alkoxyl, amino and carboxyl groups). These by-products are resilient to further oxidation by molecular O3, but they can be biodegraded or partially mineralized (CO2 and H2O)
through •OH radicals (Von Gunten, 2003). In addition, ozone and •OH radicals can form undesired by-products from the oxidation of organic and inorganic compounds in water, although the only regulated one is currently bromate, which originates from the oxidation of bromide in water (M. Elovitz & Von Gunten, 1999; Von Gunten, 2003).
1.1.7 Measurement of ozone species
Molecular ozone can be evaluated through electrochemical, optical or colorimetric methods (Von Gunten, 2003). The latter one, performed with indigo colorant, is well recognized for its high sensitivity to ozone (Mizuno, 2007). •OH radicals evaluation require the use of a chemical probe, para-chlorobenzoic acid (pCBA), which reacts very fast with •OH radicals and very slow with molecular ozone (M. Elovitz & Von Gunten, 1999).
As molecular ozone and •OH radicals may co-exist in an oxidation process, the Rct
concept can be used to discriminate the fractions of each entity during a reaction (M. Elovitz & Von Gunten, 1999):
𝑅𝑐𝑡 = ∫[• 𝑂𝐻]𝑑𝑡 ∫[𝑂⁄ 3]𝑑𝑡 (1)
where ∫[• 𝑂𝐻]𝑑𝑡 represents the •OH exposure or •OH-Ct, and ∫[𝑂3]𝑑𝑡 the molecular ozone
exposure or O3-Ct. Thus, to calculate the Rct from experimental data, the following reasoning has
As pCBA reacts relatively slow with O3 compared to •OH radicals, its reaction rate can be
neglected. Therefore, the rate of reaction is solely due to the reaction with •OH radicals expressed as:
−𝑑[𝑝𝐶𝐵𝐴]
𝑑𝑡 = 𝑘•𝑂𝐻/𝑝𝐶𝐵𝐴[𝑝𝐶𝐵𝐴][• 𝑂𝐻] (2)
where 𝑘•𝑂𝐻/𝑝𝐶𝐵𝐴 is the second order rate constant of pCBA with •OH radicals, equivalent to 5.2 x 10⁹ M-1s-1 (Acero & Von Gunten, 2001; Westerhoff, et al., 1999).
Rearranging and integrating equation (2) gives, 𝑙𝑛 ([𝑝𝐶𝐵𝐴]
[𝑝𝐶𝐵𝐴]𝑜) = −𝑘•𝑂𝐻/𝑝𝐶𝐵𝐴∫[• 𝑂𝐻]𝑑𝑡 (3) Replacing equation (1) in (3),
𝑙𝑛 ([𝑝𝐶𝐵𝐴]
[𝑝𝐶𝐵𝐴]𝑜) = −𝑘•𝑂𝐻/𝑝𝐶𝐵𝐴𝑅𝑐𝑡∫[𝑂3]𝑑𝑡 (4) where ∫[• 𝑂𝐻]𝑑𝑡 represents •OH-Ct and ∫[𝑂3]𝑑𝑡 represents O3-Ct.
Equation 4 is a linear relation in which the slope is −𝑘•𝑂𝐻/𝑝𝐶𝐵𝐴𝑅𝑐𝑡. As −𝑘•𝑂𝐻/𝑝𝐶𝐵𝐴 is constant,
the Rct value can be calculated (Von Gunten, 2003).
The Rct approach is only valid for the second portion of the ozone decay where ozone residual is maintained in solution. In the case of the immediate ozone demand (taking place before approximately 15 sec), very high •OH can be generated even if no ozone residual is detected. This is especially the case when oxidizing waters with high organic content or when ozone dosage is small compared to the concentration of reactants. Under such scenario, pCBA can also be used to evaluate the •OH-Ct that we will define as 1st phase •OH-Ct. In theory, according to Eq. 4, a plot of O3-Ct vs Ln(pCBA/pCBAo) should yield a straight line going
through the coordinate (0,1). This is equivalent to say that at a Ct of 0, there is no oxidation of pCBA. However, the phenomenon of immediate demand often translates these curves away from the coordinate (0,1). This information can be used to evaluate the 1st phase •OH-Ct such that:
• 𝑂𝐻 − 𝐶𝑡1𝑠𝑡 𝑝ℎ𝑎𝑠𝑒 =
𝑙𝑛([𝑝𝐶𝐵𝐴]
[𝑝𝐶𝐵𝐴]𝑜)𝑒𝑣𝑎𝑙𝑢𝑎𝑡𝑒𝑑 𝑎𝑡 𝐶𝑡𝑂3=0
1.2 Ceramic membrane overview
1.2.1 Basic definitions
Membranes are defined as a physical barrier that allows permeation of certain species. They are widely used in industry for separation and purification processes. According to their constituents, they can be classified as organics (polymeric and biological), inorganics (metallic and ceramic) and hybrids (organic+inorganic components) (Lu et al., 2007). According to their porosity, they can be divided into non-porous and porous membranes. In non-porous membranes (reverse osmosis), selective separation takes place when molecules ‘dissolve’ into the matrix of the membrane, then diffuse and finally get desorbed from the structure. For porous membranes (NF, UF, MF), size exclusion (sieving) is the main means in which separation is achieved (Akbarnezhad, Mousavi, & Sarhaddi, 2010). As a consequence, the driving force during a filtration process is either a concentration or a pressure gradient (Lu, et al., 2007). Table 1.2 shows a classification of membranes according to their pore size and filtration capabilities:
Table 1.2: Membrane types and characteristics Membrane type Operating
Pressures (atm) Pore diameter (nm) or MWCO (Da) Removal capacity Low pressure (<2 atm) Microfiltration1 0.1-1 102 – 104 (macroporous) Suspended molecules Bacteria Ultrafiltration1 1-5 2 -102 (mesoporous) MWCO 1-100 kDa
The previous, plus: Colloids, macromolecules High turbidity removal High NOM removal Giardia, bacteria and virus High pressure (˃2atm) Nanofiltration 5-20 0.1-2 MWCO 0.15-1 kDa
The previous, plus:
Some dissolved solids (some small organics, some
monovalent salts) Multivalent salts Reverse osmosis 20-40 50-150 Da The previous, plus:
Dissolved solids
(Gao et al., 2011; Jermann, Pronk, Meylan, & Boller, 2007; Koo, Mohammad, Suja, & Talib, 2013; Larbot, Fabre, Guizard, & Cot, 1989; Pabby, Rizvi, & Sastre, 2009; Van Geluwe, Braeken, & Van der Bruggen, 2011)
1UF and MF do not remove dissolved solids at all (Al-Amoudi, 2010), but pre-treatments can be installed to do so
In drinking water treatment, the use of membranes (polymeric) is a relatively recent technology that started to gain popularity in the 90s and has not since stopped (AWWA, 2005), so that its demand increases about 8% per year (Van Geluwe, Braeken, et al., 2011). UF in particular has experienced a great boost because it offers the possibility of removing bacteria and viruses at a comparatively lower costs than NF, which consequently minimizes the use of disinfectants and the risk of producing disinfectant by-products as long as NOM has been sufficiently removed (Gao, et al., 2011). The advantage of using membranes is the enhanced purification that is possible to achieve; i.e. increase in drinking water quality (better removal of molecules and microorganisms) (Al-Amoudi, 2010; AWWA, 2005), without the need of a physical-chemical pre-treatment and moreover, with a reliable quality on produced water (AWWA, 2005). The drawback is the relatively high energy requirements for this technology (Zhu, Wen.X, & Huang, 2012) and the inability of low pressure membranes to remove dissolved contaminants such as NOM or trace micro-pollutants.
Polymers are the most widely used material for filtration membranes due to their relative low cost and commercial availability. The most popular module is the hollow fiber, a versatile system that allows for compact design, easy installation (Madireddi, Babcock, Levine, Kim, & Stenstrom, 1999), and filtration of high quantities of water using a variety of membrane materials and configurations. Besides, it facilitates the washing process as it can be operated in 2 directions (in-out, out-in). Furthermore, membrane’s integrity can be verified under this module, which is a valuable tool to evaluate the performance of the filtration process and assess the need of repairing the membranes when necessary (AWWA, 2005). It can be operated in two modes: dead-end and flow. Dead-end mode is more economic, in terms of capital and energy costs, than cross-flow applications (Blankert, Betlem, & Roffel, 2006).
Basic definitions of membrane technology include (AWWA, 2005):
1) Water flux (J), which is defined mathematically by a modification of Darcy’s law: 𝐽 = 𝑄𝑡𝑜𝑡𝑎𝑙
𝐴 = ∆𝑃
𝜇𝑅𝑚 (6)
where J is the permeate fluxa (m·s-1), Qtotal is volumetric flow rate of pure water, A is the effective
filtration area, ΔP is the transmembrane pressure (Pa), µ is the dynamic viscosityb of the permeate (Pa.s), and Rmc is the intrinsic membrane resistance to the passage of water (m-1).
a
Flux is usually expressed in liters per square meter of membrane per hour (LMH) or gallons per square foot of membrane per day (gfd), where gfd=1.7 LMH.
b
Viscosity depends on temperature. The following formula is applied to find the viscosity of water (in centipoise) at a temperature in the range 0-35ºC and a pressure of 1 atm:
µ𝑇 = 1.777 − 0.052𝑇 + 6.25 ∗ 10−4𝑇2 (7)
Thus, to report flux values, they should be standardized for 20ºC to allow for comparisons. The correction is made by multiplying the flux calculated at ambient temperature by a correction factor defined as: µ𝑇⁄µ20º𝐶.
c
The Rm is mathematically derived from Equation 5 and Pouseuille’s law:
𝑄1𝑝𝑜𝑟𝑒 = 𝜋𝑟4
8𝜇 ∆𝑃
∆𝑧 (8)
where Q1pore is the flow through one pore, r is the pipe’s radius, µ is the viscosity and ∆𝑃 ∆𝑧⁄ is
the pressure gradient through the pipe. Then, the total flux Qtotal will be:
𝑄𝑡𝑜𝑡𝑎𝑙 = 𝜋𝑟4
8𝜇𝜏 ∆𝑃
∆𝑧 𝐴⍴𝑝𝑜𝑟𝑒 (9)
where Q1pore has been corrected for the tortuosity (𝜏) and the number of pores available on the
membrane (𝐴⍴𝑝𝑜𝑟𝑒).
Finally, replacing Equation 7 in Equation 5: 𝑅𝑚 = 8𝜏𝛥𝑧
𝜋𝑟4⍴
𝑝𝑜𝑟𝑒 (10)
from where it is observed that the radius of the membrane pore is highly important for the fluid transportation (the bigger the pore, the lower the membrane resistance and the higher the flux). Rm also depends on tortuosity and the number of pores of the membrane (AWWA, 2005)).
2) Permeability or specific flux (Js), which is the flux per unit pressure applied on the
membrane:
𝐽𝑠 = 𝐽 𝛥𝑃⁄ (11)
where ΔP can be expressed as: 𝛥𝑃 = 𝑃𝑖𝑛+ 𝑃𝑜𝑢𝑡
2 − 𝑃𝑝 (12)
where Pin is inlet P, Pout is outlet pressure and Pp is pressure of the permeate (AWWA, 2005).
3) Rejection (Ri) is the amount of substance that was removed from the original water. Ri tends
to vary with time (Schäfer, 2001).
Ceramic membranes
Ceramic constitutes an alternative material to polymers. Ceramic membranes were first introduced for industrial liquid separation in the early 80’s at the microfiltration level; afterwards, ultrafiltration was developed by the end of the same decade (Sondhi, et al., 2003). In drinking water, their use is still at the pilot or small scale level due to cost constraints; but ceramic membranes offer unique advantages over polymeric ones, such as the possibilities of applying high feed hydraulic and high backwashing pressures (Zhu, et al., 2012). Japan is undoubtedly, the leading country in drinking water ceramic membrane applications, with approximately 100 installations throughout the territory (Freeman & Shorney-Darby, 2011; Gaulinger, 2007; Metawater Co., 2014). Production capacities are generally below 3 800 m3/d (1 mgd) (Freeman & Shomey-Darby, 2011), with the highest plant capacity at 39 000 m3/d (9.8 mgd) by 2007 (Gaulinger, 2007). Currently, an installation of 171 000 m3/d (45 mgd) is planned to start operations in 2015 (Metawater Co., 2014). The biggest ceramic application outside this country is found at Netherlands. With a capacity of 120 000 m3/d (32 mgd), the Andijk III water treatment plant started operations this year (Freyberg, 2014) using a hybrid ion-exchange resin+ceramic membrane+ozonation process (BV, 2012-2013).
1.2.2 Ceramic membrane modules
These are hard cases, generally made of stainless-steel, that house one or many ceramic elements. A critical feature related to modules is their sealing. The sealing should be optimal enough to withstand the potential harsh conditions the membranes will be subjected to, so that each manufacturing company has its own technology (Pabby, et al., 2009). Modules can be arranged in ‘cascade’ mode so to achieve the required final water quality (Pabby, et al., 2009).
The elements inside the modules can be flat sheets, but it is more common to find channeled monoliths of cylindrical shape, as the latter provide better mechanical properties and easiness for sealing. The channels are shaped in different geometries, which have evolved in time. The first elements consisted of only one channel that provided a limited surface filtration area. Then multichannel elements appeared in the market, with channels in different arrangements (ex. flower-like), and shapes: circular, triangular, rectangular, oval, and finally
honeycomb (see figure 1-2). This latter shape grants superior surface filtration area and high turbulence inside the channels. It also requires low pressures (less energy) to make the fluid flow (Pabby, et al., 2009).
Figure 1-2: Evolution of channel geometries & arrangements: circular, floral, honeycomb Adapted from (Pabby, et al., 2009)
The latest advancements in ceramic membrane modules include the hollow fiber and capillary ceramic membranes (see figure 1-3) (Pabby, et al., 2009).
Figure 1-3: Images of a hollow fiber (left) and a capillary (right) ceramic membrane Adapted from (Pabby, et al., 2009)
1.2.3 Physical structure
Figure 1-4 shows the typical asymmetrical structure of the element of a ceramic membrane, which comprehends various layers of increasing pore size and layer thickness from top to bottom. This design strategy provides for mechanical support to the upper and finer layers and prevents a premature clogging of the membrane during its operation (Kim & Van der Bruggen, 2010; Szymczyk, Fievet, Reggiani, & Pagetti, 1998a).
Figure 1-4 : Assymetric structure : a) titania; b) zirconia; c) alumina ceramic membranes Extracted from (Larbot, et al., 1989; Pabby, et al., 2009)
1.2.4 Preparation
The preparation method of ceramic membranes greatly influences their properties. Different methods are used: ceramic paste extrusion for supports, slip cast for MF layers, sol-gel for UF and NF layers (Pabby, et al., 2009). To prepare the supports, metal oxides, binders and plasticizers are mixed and then pressed, extruded or slip cast (Kim & Van der Bruggen, 2010).
The top layer can be prepared through various methods: slip cast, state-molecule-sintering, sol-gel, anodic oxidation, chemical vapor deposition and the reversed micelle method, but the most widely used is the sol-gel process because it allows for reaching outstanding homogeneity and purity, well-defined pore size distribution and good control of the micro-properties of the metallic compounds used (Akbarnezhad, et al., 2010; Alem, Sarpoolaky, & Keshmiri, 2009; Shi, Tin, & Wong, 1999). Moreover, sol-gel is considered to be the only method to be used for UF membrane preparation because of the compromise between achieving fine pores and high permeability with thin layers (Larbot, et al., 1989). In the sol-gel method, hydroxides or hydrous metal oxides are dispersed in water to prepare the sols. The particles size and distribution, which are a function of pH and concentration of the oxides dispersions, have an influence on the final pore size and membrane surface properties (Kim & Van der Bruggen, 2010; Larbot, et al., 1989). The particles shape influence the shape of the membrane pores. For example, spherical molecules (titania, zirconia, α-alumina) give bottle-neck shapes, plat forms (clay, γ-alumina) give slit pores, lyotropic liquid crystals give cylindrical pores (see figure 1-5) (Pabby, et al., 2009).
Figure 1-5: Ceramic membranes pore shapes: a) bottleneck, b) slit shape, c) cylindrical shape Adapted from (Pabby, et al., 2009)
Next, the sol is transformed into a gel (polymerized) in acidic media; and finally, selected additives (organic binders) are added to adjust for viscosity (Larbot, et al., 1989) and to prevent the cracking of the top layer during the drying process (Larbot, Alary, Guizard, & Cot, 1987).
In order to join both layers, the support is submerged many times in the sol-gel solution in controlled time periods. The number and duration of these periods depend on the desired top layer thickness (Alem, et al., 2009), which is recommended to be between 1-10 µm to achieve high permeability (Larbot, et al., 1987). The embedded support is dried and then calcined at high temperatures (sintering process). Sintering grants mechanical properties to the ceramic and makes possible the binding of the thin layer to the support, as traces of water and organics will be eliminated by heat (Akbarnezhad, et al., 2010; Shojai & Mäntilä, 2001). Sintering temperatures also determined membrane surface properties and membrane pore sizes (higher temperatures produce bigger pores, and vice versa) (Kim & Van der Bruggen, 2010; Larbot, et al., 1989).
1.2.5 Chemical composition
Common materials used in the preparation of ceramic membranes are Al2O3 (alumina),
TiO2 (titania), ZrO2 (zirconia), SiO2 (silica) or a combination of them (Akbarnezhad, et al., 2010;
Alem, et al., 2009). All of these materials show an amphoteric character (negative or positive charge according to the pH of the feed solution) and electrokinetic properties (zeta potential) that are important for the transport of electrolytes through the membranes (Szymczyk, et al., 1998b). The amphoteric behaviour comes from the hydroxyl groups associated with the hydrated metal oxides (Chevereau et al., 2010).
TiO2 membranes: titania is one of the favorite materials used among ceramic membranes as it
grants advantageous properties to the units prepared: high hydrophilicity, high water flux, high chemical resistance and photocatalytic activity. The latter allows for the decomposition of toxic compounds in water (Alem, et al., 2009). Sintering is done above 400ºC. Between 550-600ºC the anatase phase is transformed irreversibly to the rutile phase; although the change can generate cracks on the surface (Alem, et al., 2009; Larbot, et al., 1989). Pore sizes can vary between 3-180 nm (Larbot, et al., 1989). The thickness of titania layers have been reported to be between 1-5 µm (Alem, et al., 2009; Chevereau, et al., 2010). Too thin or too thick of a layer can lead to
cracks formation. The photocatalytic properties depend on the size of the titania particlle, its phase (anatase) and the specific surface area of the membrane (the highest possible) (Alem, et al., 2009). Isoelectric point has been referenced between 4 and 7.3 (Szymczyk, et al., 1998a); Changwo, 2013); varying according to the crystalline form of TiO2 (Chevereau, et al., 2010).
Contact angle has been reported at ±40º (Kujawa et al, 2014). In addition, TiO2 has a strong
affinity for Mg2+ ions, so that its adsorption importantly modifies the surface charge; for example: zeta potentials will be more positive when pH increases if Mg2+ ions are present compared to the presence of monovalent salts (NaCl) (Chevereau, et al., 2010). These authors also showed that hydration of the TiO2 surface is a very slow process. The team obtained
decreasing permeability values for pure water in a period of 500 h during the conditioning phase. Hydroxyl group formation and adsorption (physical and chemical) of water molecules took place during this period.
ZrO2 membranes : these membranes have a higher chemical resistance than titania or alumina
membranes, which make them suitable for filtration in harsh conditions (Shi, et al., 1999). ZrO2
uniquely exhibits four chemical properties: being an acid and a base, as well as a reduction and oxidation agent. It possesses three crystallization phases: cubic, tetragonal and monoclinic (Shojai & Mäntilä, 2001). Sintering is performed above 470ºC. When reaching 720ºC, zirconia changes the tetragonal crystalline structure (8 O atoms surrounding Zr) to a monoclinic one (7 O atoms surrounding Zr), which causes cracks in the layer formed (Medvedkova & Nazarov, 1995; Shi, et al., 1999). Yttria could be added to avoid the cracks (Shi, et al., 1999), as well as to increase the mechanical resistance of ZrO2 (Shojai & Mäntilä, 2001). Sol-gel ZrO2 membranes
are normally in the tetragonal phase (Shi, et al., 1999); whereas slip cast ones in the monoclinic phase (Shojai & Mäntilä, 2001). Pore diameters vary in the range of 3-80 nm (Larbot, et al., 1989). The isoelectric point has been reported to be around 4.5-6 (Changwon, 2013; Moritz, Benfer, Árki, & Tomandl, 2001; Szymczyk, et al., 1998a), whereas the value of contact angle has been referenced at ±40º (Changwon, 2013).
Al2O3 membranes: for UF applications, alumina membranes are prepared via the sol-gel
technique. Sintering temperatures allow for three types of structure and pore size ranges: γ-alumina between 400-900 ºC with pore sizes 2.5-5 nm, θ-γ-alumina between 900-1100 ºC with
pore sizes of ±5 nm, and α-alumina above 1100 ºC with pore sizes 5-55 nm (Larbot, et al., 1987). α-alumina has a good chemical stability in acidic and basic conditions (Alem, et al., 2009). Depending on the type of alumina used, different isoelectric points are reported: 8-9 for fused alumina, 5-6 for calcined alumina (Chiu, 2011). Alumina is commonly used as the support’s material of a ceramic membrane. Permeability of alumina membranes is poor compare to zirconia or titania ones (see table 1.3) (Larbot, et al., 1989).
Table 1.3 : Water flux (LMH, P : ±10atm) through γ-alumina, zirconia and titania membranes Pore diameter
(nm)
γ-alumina zirconia Titania
6 100 1750 4400
8 200 1900 4700
10 450 2100 5000
Adapted from (Larbot, et al., 1989)
SiO2 membranes: this material has low stability with hot water and also has low chemical
resistance. To improve these properties, titania or especially, zirconia is doped in its structure. Pore sizes, however, are well-controlled with silica membranes (Araki, Kiyohara, Imasaka, Tanaka, & Miyake, 2011). Contact angle has been reported at ±111º (Jeens et al, 2005), and isoelectric point between 2-2.5 (Changwon, 2013).
1.2.6 Operation mode
Ceramic membranes generally operate in cross-flow filtration mode, but some dead-end applications can be found, especially for low suspended solids application such as the treatment of surface waters. In monolith multichannel ceramic membranes (the most common configuration), the direction of the feed flow is inside-out (Pabby, et al., 2009).
1.2.7 Comparison of ceramic vs polymeric membranes
Table 1.4 condenses the advantages and disadvantages of each of these materials used in membrane filtration technology.
Table 1.4: Comparison of ceramic versus polymeric membranes
Membrane Advantages Disadvantages Current status
Ceramic Long lifespan2
High thermal, chemical and mechanical
resistance2
Less prone to fouling3 Composition is better
defined4
More uniform pore distribution4
Less prone to bacterial colonization1
Requires less feed pre-treatment5
Allows for harsher and more effective cleaning5
Expensive2 Brittle2 Lower permeability Small scale applications2 Surface modifications (with nanomolecules) to improve permeability and fouling resistance4 Polymeric Cheap2
Produced in large scale2 Good quality control2
Structurally weak2 Limited thermal
resistance2 Short life due to
denaturation and contamination2 Low resistance to O3 Widespread and large applications in drinking water2
1Larbot, et al., 1989; 2Lu, et al., 2007; 3Alem, el al., 2009; 4Kim & Van der Bruggen, 2010; 5Pabby, et al., 2009
Other precisions:
Mg2+: It has been reported that adsorption of ionic species such as Mg2+ on polymeric surfaces does not influence the selectivity of the membranes, contrary to the ceramic ones (Chevereau, et al., 2010).
1.3 Principles of membrane fouling
1.3.1 Basic concepts
Fouling is defined as the loss of performance (throughput) of a membrane due to undesirable deposition of suspended (colloids and/or solids) or dissolved substance on/inside the pores. Fouling may affect water quality, although more research needs to be done in that sense (Gao, et al., 2011). Fouling of membranes causes increase in costs of energy, frequent chemical cleaning cycles, early membrane replacement (lower lifetime), and additional labour for maintenance (Al-Amoudi, 2010).
The fouling event is determined by biological, physical, chemical and/or electrical interactions among the solutes and/or between the solutes and the membrane’s surface (Gao, et al., 2011; Jermann, et al., 2007). At the beginning, the process is driven by solute-membrane interactions, but later on, it is controlled by foulant-foulant relations (Jermann, et al., 2007). The evolution of fouling behaviour during surface water filtration involves a cake formation over the membrane that can be preceded or not by pore blocking or pore adsorption events (Jermann, et al., 2007). It has also been reported that fouling mechanisms of interacting foulants are different and often more severe than independent foulants (Gao, et al., 2011; Jermann, et al., 2007).
Recognized membrane foulants are (Al-Amoudi, 2010; Gao, et al., 2011; Koo, et al., 2013):
Particles: this classification obeys a size criterion. Larger molecules than the membrane pore size are rejected and deposit over the membrane surface; whereas small molecules tend to block or adsorb inside the membrane pores.
Organics: in drinking water, the major foulant is natural organic matter (NOM). The first investigations pointed at the hydrophobic fraction (derivatives of humic substances: the humic acids) as the main fouling agents, as long as they adsorb onto the membranes surface (Combe, Molis, Lucas, Riley, & Clark, 1999; Nilson & DiGiano, 1996; Yuan & Zydney, 1999; Zularisam, et al., 2006); but later studies remarked the role of the hydrophilic fraction (biopolymers) on this process as these huge molecules block membrane pores and adhere to membrane surfaces by hydrogen bonds (Katsoufidou, Yiantsios, & Karabelas, 2005; Kennedy, Chun, Quintanilla, Heijman, & Schippers, 2005; Kimura, Tanaka, & Yoshimasa, 2014; N. Lee, Amy, & Croué, 2006; Yamamura, Okimoto, Kimura, & Watanabe, 2014). Currently, increasing focus is given to the role of biopolymers on membrane fouling.
Inorganics: dissolved inorganics (BaSO4, CaSO4, CaCO3) and/or slightly soluble compounds
(inorganic salts, minerals and/or colloidal matter) may form a scale on the membrane surface. However, this is expected to be of significance only if the solubility products are exceeded. Biological: microorganisms attach to the membrane surface, and subsequently grow and
reproduce in the presence of enough nutrients.
Fouling mechanisms: AWWA (2005) describes two types of fouling: cake (gel-layer) on the
feed-side of the membrane and pore blocking. For a dead-end filtration, the latter is divided in: complete pore blocking, incomplete pore blocking, and standard pore blocking (see figure 1-6). Complete pore blocking: a monolayer of molecules blocks all the pores of the membrane
surface; no superimposition is allowed. It occurs when molecules are bigger or of comparable size than the membrane pores (AWWA, 2005; Chellam & Cogan, 2011; Hlavacek & Bouchet, 1993). It is commonly observed in NF membranes filtration (Al-Amoudi, 2010). Intermediate blocking: molecules can deposit, either over the membrane’s surface, or over
another layer of molecules that is already deposited on the membrane’s surface (Z. Ho, 1999). Any deposition site has equal chances of being occupied (Koo, et al., 2013). A pore is always completely blocked when reached by a bigger molecule (Chellam & Cogan, 2011; Hlavacek & Bouchet, 1993).
Standard pore blocking or pore adsorption: it occurs when all the molecules are smaller than the pore size of the membrane and thus deposit inside the pores, reducing their diameter in a uniform way (AWWA, 2005; Chellam & Cogan, 2011; Koo, et al., 2013). It commonly leads to irreversible fouling, and may only be partly removed by chemical cleaning (Jermann, et al., 2007).
Cake filtration: a ubiquitous mechanism (Huang, Young, & Jacangelo, 2008) where molecules that are larger than the membrane pore size deposit on the membrane surface (blocking of pores is not considered in ideal cake filtration). It can also be induced by concentration polarization (AWWA, 2005; Chellam & Cogan, 2011). The resistance of the cake increases proportionally to the depth of the cake (Koo et al, 2012). To eliminate a cake layer, a backwash or an important shear stress should be applied to the surface (Jermann et al, 2007). Filtration cakes can be classified as incompressible (cake structure does not change even if increasing the TMP or the rate of deposition of materials; example: silica), and
compressible (cake becomes denser and with higher resistance when increasing the TMP or the flow rate across the cake) (Al-Amoudi, 2010). Compressibility depends on the type and shape of the molecules, and is crucial for fouling behaviour. In water and wastewater treatment, it is very common to deal with compressible molecules (organic material, bacteria, clays, etc.) (Chelam et al, 2006; Kim & DiGiano, 2009).
Figure 1-6 : Filtration laws for dead-end mode : a) cake filtration, b) intermediate blocking, c) standard blocking, d) complete blocking
(Extracted from Blankert et al, 2006)
Concentration polarisation (CP) is not considered a fouling mechanism, but a condition that can lead to its establishment. It is defined as the accumulation of rejected material (dissolved, colloidal and/or microbial) in the proximity of the membrane surface, yielding higher concentrations than the bulk itself (AWWA, 2005; Koo et al, 2012). CP aggravates fouling and can deteriorate filtrate quality if TMP is increased (Madireddi et al., 1999; Koo et al., 2012). This mechanism is reduced if a tangential flow is applied, or if the pressure exerted is decreased (Jermann et al, 2007). Concentration polarisation takes place when convective forces balance back-diffusion ones. The mass balance becomes:
𝐽𝐶 − 𝐷𝑑𝐶
𝑑𝑥= 𝐽𝐶𝑝 (13)
where J is flux, C is concentration of material, Cp is concentration of material in filtrate. With boundary conditions Cx=0 = Cm and Cx=ẟ = Cb, Equation 8 becomes:
exp𝐽𝛿
𝐷 = 𝐶𝑚−𝐶𝑝
𝐶𝑏− 𝐶𝑝 (14)
where J𝛿/D is the Peclet number (dimensionless), Cm concentration at the membrane, Cb
concentration of the feed (AWWA, 2005).
Reversibility: reversibility describes the ability of a membrane to recover from a given fouling condition.
Reversible fouling: fouling that is eliminated by physical cleaning (air, water) such as external fouling or cake formation (Gao et al, 2011; Zhu, 2012); or chemical cleaning. Irreversible fouling: fouling that cannot be eliminated by any means. It is the reason for the
loss of permeability of the membrane in the long term use (Gao et al, 2011).
1.3.2 Factors influencing the fouling of membranes
The fouling of porous membranes implies many complex physical and chemical related interactions. Factors that affect membrane fouling in the presence of NOM are (Schäfer, 2001; Al-Amoudi, 2010):
1. Membrane characteristics: surface morphology, structure, pore size, pore size distribution, shape, surface chemical properties.
2. Chemistry of the feed solution: ionic strength, pH, concentration of monovalent and divalent ions, molecules, colloids, NOM, inorganic components, and their properties such as nature, morphology, size, size distribution, surface potential.
3. Hydrodynamic and operation conditions: permeate flux, pressure, concentration polarization and the mass transfer properties of the fluid boundary layer.
Membrane characteristics
Surface morphology.- The rougher the surface of the membrane, the more clogging will be produced as colloidal molecules accumulate in the valleys of rough membranes (Van Geluwe, 2011).
Pore size and distribution.- A homogeneous distribution of pores size allows for higher selectivity of the membrane (Larbot, et al., 1987) and higher pore diameters grant higher permeability to the membrane (Larbot, et al., 1989). But it may happen that for larger pore-size membranes fouling is faster and more important due to the fact that bigger molecules are allowed into its structure and facilitate pore blocking or adsorption (Al-Amoudi, 2010).
Membrane structure.- Membranes that have high interconnectivity between the pores tend to foul slower than non-connected membrane pores because they provide for alternative pathways for fluid flow (Ho & Zydney, 1999; Koo et al, 2012).
Surface chemical properties.- They are related to the membrane material. For ceramic membranes, the surface properties depend on the metal oxide used, as this defines the grade of