7891
Assessment of performance of smallholder dairy
farms in Kenya: an econometric approach
Mugambi, David Kimenchu1, Maina Mwangi2, Wambugu, Stephen Kairu3, Gitunu Antony M.M4. 1Directorate of Livestock Development, Meru County; P. O. Box 38-60602, Kianjai, Kenya;2Department of Agricultural Science and Technology, Kenyatta University, P. O. Box 43844, Nairobi, Kenya; 3Faculty of Agriculture, Chuka University, P.O Box 109-60400, Chuka, Kenya
4Kenya Agricultural Research Institute, P. O. Box 27 Embu.
*5Corresponding author e-mail: [email protected], Cell Phone: +254 0721896230
Original submitted in on 28th October 2014. Published online at www.m.elewa.org on 2nd February 2015 http://dx.doi.org/10.4314/jab.v85i1.13
ABSTRACT
Objective: The aim of the study was to estimate the technical and cost efficiencies of smallholder dairy farms in Kenya (Embu and Meru counties).
Methodology and results: Data were collected through a cross-sectional survey from 135 (96 in Embu and 39 Meru) randomly sampled farms using semi-structured questionnaires. Stochastic frontier production and cost functions were estimated using the maximum likelihood estimation (MLE) technique. It revealed zero-grazed herds of four animals (mainly Friesians and Ayrshires) on two-acre sized farms that practice mixed crop-livestock farming system. The animals were underfed daily with roughages (52.2 Kg), concentrates (2.2 Kg) and mineral supplements (37 g); producing 15 Kg of milk on average. The major factors influencing milk output were the number of lactating cows and the amounts of roughages, concentrates and mineral supplements, while the prices of roughages and labour caused most variation in its production cost. The mean farmers’ technical and cost efficiencies were 83.7 and 95.6%, respectively. The production model coefficient was 2.11. These results implied that milk production could be increased by 16.3% through better use of available resources given the current state of technology without extra cost, while the cost of milk production could be decreased by about 4.4% without decreasing output.
Conclusion and application of results: The results indicate that optimization of farm efficiencies could increase milk yields while concurrently lowering its production cost. The study further provides evidence that any efforts towards reducing land sub-division and promotion of enterprise specialization could increase milk affordability.
Key words: smallholder dairy, cost and technical efficiency, function coefficient INTRODUCTION
Growth in agricultural production and productivity is needed to raise rural incomes and to meet the food and raw material needs of the fast growing populations.Livestock have an important part to play, as they provide high-quality protein to consumers and regular income to producers. To fulfil their potential sustainably, livestock must be managed with efficiency (FAO, 2011). The profitability of the dairy farming business requires
both the production units (cows) and the most appropriate inputs. The business starts with an understanding of the theory and practice of dairy production technology (Moran, 2009). Kenya’s dairy sub-sector accounts for about 3.8 % of the National gross domestic product (GDP) and directly contributes to the livelihoods of about four million Kenyans through food, income and employment (Omiti et al, 2006). Various
Journal of Applied Biosciences 85:7891– 7899
Mugambi et al. J. Appl. Biosci. Assessment of performance of smallholder dairy farms in Kenya: an econometric approach
7892 indicators however, show that the sector’s performance is much lower than its potential. Milk yield has invariably remained at an average of 6 Kg per cow per day since the early 1980s (MoLD, 2010), despite a potential of more than 15. The country’s per capita milk consumption has remained invariably below 100 Kg for all time, while the WHO’s recommendation is 200 kg (FAO, 2007). The country’s negligible total milk export quantity is a further indicator (MoLD, 2010). Empirical findings are that the country’s milk is expensively produced, making it unaffordable to a large proportion of the population. The following are some past studies regarding milk production and marketing in Kenya: farmers’ adoption of production technologies (Makokha et al, 2007); nutrition (Ongadi, 2006); smallholder dairy profitability (Omiti et al, 2006); genetics (Kahi, 2004); production systems (Bebe, 2003); and milk production and marketing (Ngigi, 2002; Staal et al, 2008). Despite the many recommendations, milk yield has remained low and it’s per unit cost of production relatively high. This study estimates the efficiencies (technical and cost) of dairy farms in Embu and Meru Counties of Kenya. According to Kumbhakar and Lovell (2000) efficiency represents, the degree of success which producers achieve in allocating
the available inputs and the outputs they produce, in order to achieve their goals. Efficiency estimation provides an indication of the percentage by which potential output could be increased, or potential cost decreased, in relation to the corresponding production frontier (Kokkinou and Geo, 2009). Farrell (1957) provided a measurement application on U.S. agriculture and was the first to measure productive efficiency empirically. His study on efficiency measurement led to the development of several approaches to efficiency and productivity analysis. These approaches include the parametric stochastic frontier production (Aigner et al, 1977; Meeusen and van den Broeck, 1977), distribution free approach (DFA) and the thick frontier approach (TFA); and the non-parametric Data Envelopment Analysis (DEA) (Charnes et al, 1978) and the free disposal hull (FDH). In parametric approaches, a functional form is assumed and econometric methods are used in estimation. A functional form is imposed on the function (production or cost) and assumptions about the data are made (Chirwa, 2007). The function estimation is mostly performed by employment of stochastic frontier analysis (SFA), which accounts for both inefficiency and random noise effects.
MATERIALS AND METHODS
Description of study area, sampling technique, data sources and collection method: Embu and Meru Counties lie on the Eastern Central highlands of Kenya. Embu County is at 0030o S, 3730o E and
Meru at 0o,38 00o E. They cover an area of 2826.4
and 6924 km2, respectively. Their rain seasons are
March to May and October to December with annual rainfall totals ranging in-between 600-2200 and 500-2600mm, respectively. The temperature ranges for the respective counties are; 12-27o C and 11.4-28o C
(Jaetzold et al, 2007). They border Mt. Kenya and are ideal for dairy farming. Their respective human populations are 516,212 and 1,356,301 (RoK, 2009). The sample for this study was drawn from Embu East and Igembe South sub-Counties within the Embu and Meru counties, respectively. A descriptive survey technique using semi-structured questionnaires was used for data collection and sampling was random. Data on the following was recorded:
• Total herd size (counted);
• Milking herd size (counted as the total number of lactating cows);
• Breed (observed and compared to photo card);
• Roughages (kg) (amount per cow per day); • Average amount of concentrate (kg)
(ascertained by re-weighing the amount in a vessel used by the farmer in feeding a cow per day);
• Average amount of mineral supplements (kg) (obtained from farmer’s response);
• Average number of labour hours spent on herd per day (hours) (average time taken on dairy farming activities in a day by either a family member or hired or both);
• Land size owned (acres) (obtained from the farmer’s response);
• Chaff-cutter ownership (presence or absence of chaff-cutter in a farm, obtained by observation and/farmer response). Data on milk output per cow was collected. Further
7893 data were on the cost of roughage, concentrate, mineral supplements and labour per day.
Empirical Models
Technical Efficiency Estimation: In this paper, the Cobb-Douglas functional form was assumed in specifying the production function. The functional
form is easy to estimate and allows the focus to be on the error term (Kumbhakar and Lovell, 2000). The maximum likelihood estimates of the parameters of the production function were estimated using the procedure in the FRONTIER 4.1c (Coelli, 1996) econometric software. The function was specified as;
In Yi = β0+ β1 ln Xij + β2 ln X2ij + β3 ln X3ij + β4 ln X4ij + β5 ln X5ij + β6 ln X6ij + β7 ln X7ij + β8 lnX8ij+β9 ln X9ij+Vij–uij (1) Where;
ln represents logarithm to base e; subscripts ij refers to the jth observation of the ith farm; Y is the total milk output in kilograms; X1 represents the total herd
size; X2 is the milking herd size; X3 represents the
cow breed; X4 represents the daily amount of
roughages to the herd (Kg); X5 is the average amount
of concentrate feed per farm per day (Kg); X6
represents the average quantity of mineral supplements per herd per month (Kg); X7 is the
average number of labour hours per herd per day (Hours); and X8 represents the size of land owned
(Acres) and X9 represents the presence or absence of
chaff-cutter technology in the dairy farm.
Cost Efficiency Estimation: The translog function was used to specify the stochastic cost function because it allows the data to drive the shape of the cost function with few restrictions. Under the translog specification, the one-sided error component ui
captures both input oriented technical and allocative inefficiency (Nadolnyak et al, 2000; as cited in Lucila et al, 2005). The model was specified as shown below and estimated using FRONTIER 4.1c program (Coelli, 1996):
Ln (TC/cfeed) = β0 + βy ln output + Σjαj ln (pj/cfeed) + ½ βyy (ln output)2 + ½ ΣjΣhαjh ln (pj /cfeed)* ln (ph/cfeed)+ Σjαyj ln output * ln (pj/cfeed) + vi +ui, (2) Where;
TC is the actual total cost of production; cfeed is average price of concentrate feed per day; vi
represents the deviation from the frontier due to random events; ui represents inefficiency; ß is a
vector of unknown parameters, and; pj is the unit cost of input. After normalizing the total cost and the input prices by the price of concentrate feed and expressing all the variables in logarithms, the estimating equation became:
tcost = β0 + β1 outpt + β2 rfeed+ β3 minsuppls + β4 labr + ½ β5 outpt2 + ½ β6 rfeed2+ ½ β7 minsuppls2 + ½ β8 labr2 + β9 outptrfeed + β10 outptminsuppls + β11 outptlabr + β12 rfeedmin + β13 rfeedlabr + β14 minsupplslabr + vi + ui, (3) where,
tcost= total cost of production (Ksh); outpt= total farm milk output/day (Kg); minsuppls= total price of mineral supplements to the herd/day (Ksh); labr= average cost of labor per day (Ksh); outpt2 = output x
output; rfeed2 = roughage feed x roughage feed (kg);
minsuppls2 = mineral supplements x mineral
supplements (kg); labr2 = labour x labour (Hr);
outptrfeed= output x roughage feed; outptminsuppls= output x mineral supplements; outptlabr= output x labour; rfeedmin= roughage feed x mineral supplements; rfeedlabr= roughage feed x labour; minsupplslabr= mineral supplements x labour.
RESULTS AND DISCUSSION
The study revealed that farms underfed their dairy animals leading to reduced milk yields relative to their genetic potential. Dependence on rain-fed fodders and pastures on small land sizes was a plausible reason for the inadequate roughages. Similarly, in
western Kenya, inadequate roughages constrained dairy productivity among smallholder farmers (Owuor and Ouma, 2009). A summary of descriptive statistics on diverse variables is presented below (Table 1).
Mugambi et al. J. Appl. Biosci. Assessment of performance of smallholder dairy farms in Kenya: an econometric approach
7894
Table 1: A summary of descriptive statistics of select study variables
Embu East (n=96) Igembe South (n=39) Overall (n=135)
Average herd Size 3.89 4.03 3.93
Milking herd size - - 1.56 cows-lactating
Breed - - 89%; Friesian, Ayrshire &
their crosses Roughage feeds fed (kg) 51.9 (11.6a) 52.8 (11.4) Average; 52.2 (11.7)
Concentrate feeds (kg) 2.2 (1.2) 2.1 (1.4) Average; 2.2 (1.8) cow/day Mineral supplements (kg) 4.2 (3.3) 4.5 (4.0) Average; 1.1 (3.5)
cow/month
Labour time (Hrs)/ cow/day 2.1 2.66 2.2
Land size/farm - - Average of 2 acres
Chaff-cutter ownership - - 23.7% own chaff-cutters
Per cow yield (Kg) 9.6 8.4 9.3
Per herd yield (Kg) 13.7 18.5 15
Milk price (Ksh. /Kg) 20.4 35.3 24.4
Total cost (Ksh.)/Kg milk 35.4/= per kg (485.5/=herd)
38.0/= per /kg (703.3/= per herd)
37.4/=kg (551.1/= per herd) a The standard deviation in parenthesis
The average prices for concentrate feeds and mineral supplements per kilogram and labour wage per hour were Kshs 21.0, 138.5 and 148.9, respectively. The costs of Napier per kilogram were Ksh. 1.4 in Embu East and 2.6 in Igembe sub-Counties.
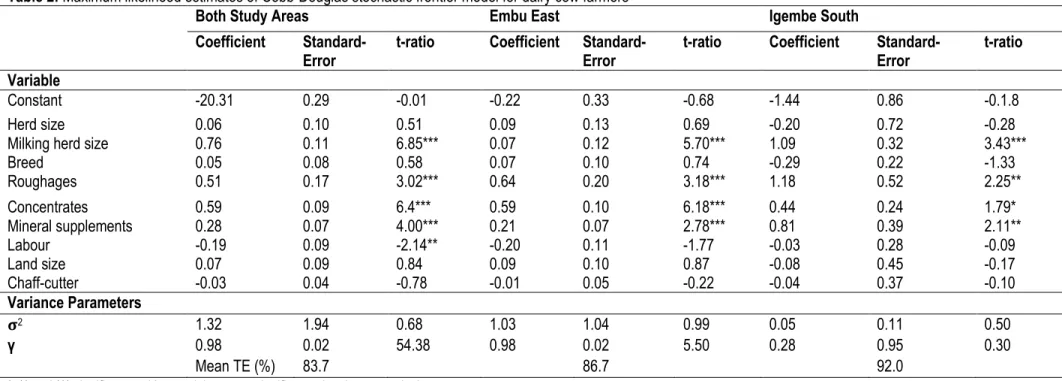
Production frontier and technical efficiency estimates: Table 2 presents a summary of results of
maximum likelihood estimates (MLEs) of a Cobb-Douglas stochastic frontier production function for dairy cow farms in Embu and Meru Counties. The results show that milking herd size, roughages, concentrates and mineral supplements were significant at 1% level; while labour was significant at 5% level.
7895
Table 2: Maximum likelihood estimates of Cobb-Douglas stochastic frontier model for dairy cow farmers
Both Study Areas Embu East Igembe South
Coefficient
Standard-Error
t-ratio Coefficient
Standard-Error
t-ratio Coefficient
Standard-Error
t-ratio Variable
Constant -20.31 0.29 -0.01 -0.22 0.33 -0.68 -1.44 0.86 -0.1.8
Herd size 0.06 0.10 0.51 0.09 0.13 0.69 -0.20 0.72 -0.28
Milking herd size 0.76 0.11 6.85*** 0.07 0.12 5.70*** 1.09 0.32 3.43***
Breed 0.05 0.08 0.58 0.07 0.10 0.74 -0.29 0.22 -1.33 Roughages 0.51 0.17 3.02*** 0.64 0.20 3.18*** 1.18 0.52 2.25** Concentrates 0.59 0.09 6.4*** 0.59 0.10 6.18*** 0.44 0.24 1.79* Mineral supplements 0.28 0.07 4.00*** 0.21 0.07 2.78*** 0.81 0.39 2.11** Labour -0.19 0.09 -2.14** -0.20 0.11 -1.77 -0.03 0.28 -0.09 Land size 0.07 0.09 0.84 0.09 0.10 0.87 -0.08 0.45 -0.17 Chaff-cutter -0.03 0.04 -0.78 -0.01 0.05 -0.22 -0.04 0.37 -0.10 Variance Parameters ો2 1.32 1.94 0.68 1.03 1.04 0.99 0.05 0.11 0.50 γ 0.98 0.02 54.38 0.98 0.02 5.50 0.28 0.95 0.30 Mean TE (%) 83.7 86.7 92.0
*, ** and *** significant at 10, 5 and 1 percent significance levels, respectively.
Mugambi et al. J. Appl. Biosci. Assessment of performance of smallholder dairy farms in Kenya: an econometric approach
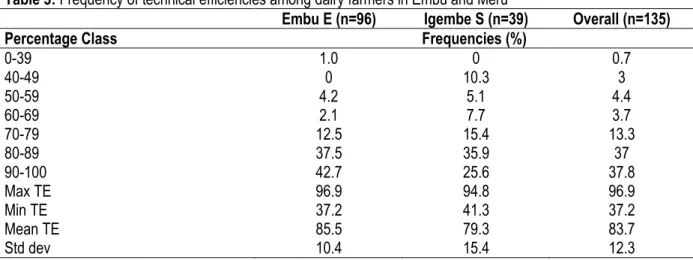
7896 Technical Efficiency Levels: Table 3 shows the frequency distribution of the dairy farm technical
efficiencies. Over three quarters of the farms achieved efficiencies above 70% level.
Table 3: Frequency of technical efficiencies among dairy farmers in Embu and Meru
Embu E (n=96) Igembe S (n=39) Overall (n=135)
Percentage Class Frequencies (%)
0-39 1.0 0 0.7 40-49 0 10.3 3 50-59 4.2 5.1 4.4 60-69 2.1 7.7 3.7 70-79 12.5 15.4 13.3 80-89 37.5 35.9 37 90-100 42.7 25.6 37.8 Max TE 96.9 94.8 96.9 Min TE 37.2 41.3 37.2 Mean TE 85.5 79.3 83.7 Std dev 10.4 15.4 12.3
The dairy farms achieved an average efficiency of 83.7%, implying that in the short-run, there is a scope for increasing milk production by about 16.3% without increasing the current input level. This could be achieved by motivating the farmers through policy changes that are geared towards reducing dairy inputs costs and making milk prices predictable. Other studies on technical efficiency on dairy farming that reported almost equal mean efficiency levels include; Cabrera et al. (2009) and Alemdar (2009). Milk yields would more than double if all the inputs in use at the moment were to be proportionately doubled, as indicated by the total output elasticity of
2.11, implying that dairy farmers could benefit from economies of scale linked to increasing returns. MLEs of Stochastic Frontier Cost Function: The stochastic frontier cost function estimates are presented in Table 4. The cost elasticities with respect to output and input prices had a positive effect on costs. The output elasticity though positive was not significant. The results show that roughages and labour were significant at 1% level. There was no strong empirical support for diseconomies of scale as the coefficient of output2 though positive, was not
statistically significant. Cost elasticity with respect to roughages indicates diseconomies of scale, given the statistically significant positive coefficient of rfeed2.
Table 4: Parameters of the Translog Stochastic cost frontier model for milk production in Embu and Meru in Kenya
Regressors Parameter Coefficient Standard Error
Output β 1 0.03 0.04 Roughages β 2 0.27 (3.34***) 0.08 Minersuppls β 3 0.05 0.07 Labour β 4 0.46 (5.57***) 0.08 Output*Output β 5 0.03 0.03 Roughage*Roughage β 6 0.38 (3.57***) 0.11 Miner.suppls*Miner.suppls β 7 0.11 0.98 Labour*Labour β 8 0.06 0.05 Output*Roughages β 9 0.03 0.05 Output*Miner.suppls β10 0.02 0.02 Output*Labour β11 -0.02 0.06 Roughage*Miner.suppls β12 -0.08 0.06 Roughage*Labour β13 -0.15 (-2.33**) 0.06 Miner.suppls*Labour β14 0.03 0.04 Sigma-squared 0.00** 0.01 Gamma 0.82*** 0.11
***, ** Significance level at 1%, and 5% respectively
Diagnostic statistics: Log likelihood function = 271.97, LR test of the one-sided error = 17.67, Note: All explanatory variables are in natural logarithms.
7897 Cost Efficiency Estimates: Results showed cost efficiency estimates to range from a low of 1.01 to a high of 1.14, with an average efficiency estimate of 1.044. The means for Embu East and Igembe South sub-Counties were 104.8 and 103.4, respectively. There was a discrepancy between each farm and its best practice cost, with farms operating at about 4.4% higher costs, resulting mainly from both technical and allocative inefficiencies. This finding however, indicates that the farmers in Embu and Meru Counties performed relatively well in terms of cost management. Smallholder dairy farms in six provinces of Northeast Thailand operate at 26% above the frontier costs (Lucila et al, 2005). Kavoi et al. (2010) found smallholder dairy farmers in the transitional zones of Machakos and Makueni Districts of Kenya operating at 27.45% above the minimum costs. He found road infrastructure, extension and credit facility being significant in reducing cost inefficiency. Farmers could lower their milk production costs in the study area by maintaining an optimal milking cow-herd size and using yield-enhancing technologies. Feed technology options that could potentially reduce costs while maintaining yield levels are also necessary. Roughage feeds contributed the highest proportion (53.9%) of the total cost of milk production in the study farms. Many other studies including Alvarez et al. (2005, 2008) and Lucila et al. (2005) had results close to those of this study. There were no economies of scale in relation to the costs of the roughages. According to Pichet, scientific evidence from many developed dairy producing countries show that milk production is much more dependent on the quantity and quality of feed rather than on the genetic makeup of the animal. The implication of this finding is that dairy farming will depend on adequate and affordable roughages, which could be better achieved where farm sizes are not severely limited. The policy makers could also come up with measures to improve on rain water catchment, storage and use. Dairy farms provided an average of 2.2 kg of concentrates to supplement the roughages. It was not clear why farmers in the country use almost equivalent amounts. Lukuyu et al. (2011) and Njarui et al. (2011), found farmers providing concentrates based on the flat rate of 2 kg per cow per day. The quantity of concentrates fed to dairy cows correlated positively with milk yields in the study area. An increase of concentrates by 10% increased milk yield by 5.9%. Alemdar (2010), Saravanakumar and Jain (2007) and Binici (2006) reported close results to those of this study. The reasons for underfeeding animals with concentrates were its cost, farmers not keeping production records, lack of information on its importance and
learning from the other practicing farmers and less from the extension service providers. This study found an increase in mineral supplements by 10% to increase milk yield by 2.8%. Unfortunately, the average amount of mineral supplements provided per cow per month was only 1.1 kg as opposed to an average of 3 kg per month at 100 g/day (MoLD, 2003). Although some minerals are present in roughages and concentrates, dairy cows require daily supply of additional commercial supplements. The number of labour hours invested in dairy farming was 37% above recommended 1.6 hours per cow daily (MoLD, 2003). Such labour usage coupled with long distances (47 % of the farms had small sized plots about 3.3 Km away) between the dairy farm and the other owned plot(s) undoubtedly exaggerated the cost of milk production. FIAS (2006) found farmers in Pakistan employing approximately 50% labour input above the minimum recommendation. Labour productivity on smallholder dairy farms could be improved by adopting better farm management practices (efficiency improvement), expanding dairy herd sizes (increase in operational scale) and increasing milk yields (mainly per cow milk yields). This study showed that roughages and labour substitute for one another in milk production, so costs are reduced by using them together. Kavoi et al. (2010) in a study on measurement of economic efficiency for smallholder dairy cattle in the marginal zones of Kenya reported similar findings. This implies that efficiency in labour utilization (which would reduce labour demand) is one of the options for decreasing dairy farming costs. Further, increased efficiency in roughage use would reduce wastage, thereby reducing the labour demand, which could decrease the total cost. In a case where quality roughages are available at a lower cost than would be grown by the farmer, then, that would lead to a decrease in labour costs and at the same time the total dairy farming costs.
A comparison between Kenya’s cost of milk production and other producers: The continued liberalization of world trade and the accelerating international competition for markets, require farmers to consider the competitiveness of their products (Roche and Newman, 2008). The cost of producing a kilogram of milk in Embu and Meru Counties was US$ 0.43 (US$ 1=KES 85). According to the FAOSTAT and IFCN (2009), the following were the costs of producing a kilogram of milk in some other countries; Uganda (US$ 0.26), Pakistan (US$ 0.1), Vietnam (US$ 0.15), Bosnia and Herzegovina (US$ 0.3), and Argentina, Brazil, and New Zealand (varied between US$ 0.07 to 0.17). This finding indicates that Kenya’s milk remains uncompetitive in the market,
Mugambi et al. J. Appl. Biosci. Assessment of performance of smallholder dairy farms in Kenya: an econometric approach
7898 making it inaccessible to both the citizens and their neighbours. Competitiveness in the market place for
homogenous commodities such as milk is largely determined by costs of production.
CONCLUSION
Dairy cows were underfed (received 52 kg of roughage against 100) and produced less milk than their genetic potential (9.3 kg against 20). The number of milking cows and quantities of feeds and mineral supplements were the major determinants of the amount of milk a farm produced. A proportionate doubling of all the inputs in use at the moment could more than double a farm’s milk yield, indicating that there exists an opportunity to benefit from economies of scale. The dairy farms were inefficient, achieving an average of 83.7% and 104.4% technical and cost efficiencies, respectively. The average cost of producing a kilogram of milk was Kshs 37.4. The cost
of roughages and labour constituted the highest proportion of the cost, and not the dairy farm inefficiencies. A skilful balancing act in the use of roughages and labour could lower the cost of milk production. Further, if both efficiencies were optimized, the cost of production could reduce by about 22%, from Kshs.37.4 to 29.2, thus increasing its affordability. The policy makers should discourage continued sub-division of agricultural land while concurrently promoting farm enterprise specialization and initiatives that lower the costs of dairy farming inputs.
REFERENCES
Aigner, D.C., Lovell, K., & Schmidt, P., 1977. Formulation and estimation of stochastic frontier production function models. Journal of Econometrics, (6), 21–37.
Alemdar, T., Behadir, B., & Oren, M.N., 2010. Cost and return analysis and technical efficiency of small-scale milk production: A case study for Cukurova region, Turkey. Journal of Animal and Veterinary Advances, 9 (4), 744-847.
Alvarez, A., C. Arias, C., & Roibás, D., 2005. Análisis de la calidad de la leche en un modelo microeconómico multi-output: el papel de la genética. Economía Agraria y Recursos Naturale 9(5), 3-17.
Alvarez, A., J. del Corral, D. Solís, & Pérez, J. A., 2008. Does intensification improve the economic efficiency of dairy farms? J. Dairy Sci. 91, 3693–3698.
Bebe, B.O., 2003. Herd dynamics of smallholder dairy in the Kenya highlands. (Unpublished Doctoral Dissertation). Wageningen Agric. University, Wageningen, The Netherlands. Binici. T., Demircan, T., & Zulauf, C.R., 2006.
Assessing production efficiency of dairy farms in Burdur province, Turkey. Journal of Agriculture and Rural Development in the Tropics and Subtropics, 107(1), 1–10. Cabrera, V. E., Solis, D., & del Corral J., 2009.
Determinants of technical efficiency among dairy farms in Wisconsin. J. Dairy Sci. 93, 387–393.
Charnes, A. C., Cooper, W. W., & Rhodes, E., 1978. Measuring the efficiency of decision making units. European Journal of Operational Research, 2(6), 429–444.
Chirwa, W. E., 2007. Sources of technical efficiency among smallholder maize farmers in Southern Malawi. Nairobi: African Economic Research Consortium.
Coelli, T.J., 1996. A Computer Program for Stochastic Frontier Production and Cost Function Estimation¨. Centre for Efficiency and Productivity Analysis (CEPA). Australia.
Retrieved from
http://www.une.edu.au/econometrics/cepaw p.htm
FAO., 2007. FAOSTAT Data, Food and Agriculture Organization, Rome.
FAO., 2011. World Livestock 2011- Livestock in food security. Rome, FAO.
Farrell, M.J. (1957). ¨The measurement of productive efficiency¨. Journal of the Royal Statistical Society, 120(3), 253-290.
Foreign Investment Advisory Services (FIAS)., 2006. Constraints to Competitiveness in the Dairy Sector: Pakistan Value Chain Analysis. Faisalabad, Pakistan.
IFCN., 2009. International dairy comparison network. Retrieved from www.ifcndairy.org.
Jaetzold, R., Schmidt, H., Hornetz, B., and Shisanya, C., 2007. Farm Management Handbook of Kenya Vol. II; Natural Conditions and Farm Management Information. Nairobi: Ministry of Agriculture.
Kahi, A.K., Nitter, G., & Gall, C.F., 2004. Developing breeding schemes for pasture based dairy production systems in Kenya. II. Evaluation of alternative objectives and schemes using a two-tier open nucleus and young bull system. Journal of Livestock Production Science. 88, 179-192.
7899 Kavoi, M. M., Hoag, L., & Pritchett, J., 2010.
Measurement of economic efficiency for smallholder dairy cattle in the marginal zones of Kenya. Journal of Development and Agricultural Economics, 2(4), 122-137. Kokkinou, A., & Geo., 2009. Stochastic frontier
analysis: Empirical evidence on Greek productivity. Glasgow. University of Glasgow.
Kumbhakar, S.C., & Lovell, C.A.K., 2000. Stochastic frontier analysis. New York: Cambridge University Press.
Lucila Ma. A., Lapar1a, Garcia, A., Adittob, S., & Suriyab, P., 2005. Measuring cost efficiency in smallholder dairy: Empirical evidence from Northeast Thailand. Selected Paper prepared for presentation at the American Agricultural Economics Association Annual Meeting, Providence, Rhode Island.
Lukuyu, B., Franzel, S., Ongadi P.M., & Duncan, A.J., 2011. Livestock feed resources: Current production and management practices in central and northern rift valley provinces of
Kenya. Retrieved from
http://www.lrrd.org/lrrd23/5/luku23112.htm Makokha S.N., Karugia J., Staal S. &
Oluoch-Kosura., 2007. Analysis of factors influencing adoption of dairy technologies in Western Kenya. A paper presented in AAAE Conference Proceedings in Accra, Ghana. Meeusen, W. and van den Broeck, J., 1977.
Efficiency Estimation from Cobb-Douglas Production Functions with Composed Error. International Economic Review 18 (2), 435-444.
MoLD., 2003. Livestock production management and practices manual. Nairobi, Kenya.
MoLD., 2010. Kenya national dairy master plan. (1) A Situational analysis of the dairy sub-sector. Nairobi, Kenya.
Moran, J., 2009. Business management for tropical dairy farmers. Land Links Press. Melbourne, Australia.
Ngigi, M., 2002. An evaluation of the impacts of transaction costs and market outlet risks on market participation of smallholder dairy farmers in central. (Unpublished Doctoral Dissertation). University of Nairobi, Nairobi, Kenya.
Njarui, D. M. G, Gatheru M., Wambua, J. M, Nguluu, S. N., Mwangi, D. M., & Keya, G. A., 2011. Feeding management for dairy cattle in
smallholder farming systems of semi-arid tropical Kenya. Retrieved from http://www.lrrd.org/lrrd22/3/onga22056.htm Omiti, J., Wanyoike, F., Staal, S., Delgado, C., &
Njoroge, L., 2006. Will small-scale dairy producers in Kenya disappear due to economies of scale in production? Contributed paper prepared for presentation at the International Association of Agricultural Economists Conference, Gold Coast, Australia.
Ongadi, P.M, Wahome, R.G, Wakhungu, J.W,& Okitoi, L.O., 2006. Modeling the influence of existing feeding strategies of performance of grade dairy cattle in vihiga, Kenya.
Retrieved from
http://www.lrrd.org/lrrd22/3/onga22056.htm Owuor, G., & Ouma, A.S., 2009. What are the key
constraints in technical efficiency of smallholder farmers in Africa? Empirical evidence from Kenya; 111 EAAE-IAAE Seminar ‘Small farms: decline or persistence’ University of Kent, Canterbury, UK 26th. - 27th. June 2009.
Pichet, S. “The Development of Dairy Farming in Thailand.” Unpublished manuscript. (undated)
Republic of Kenya (RoK)., 2009. Ministry of State for Planning, National Development and Vision 2010. Kenya National Census. Nairobi: Government Press.
Roche, J.R., & Newman, M., 2008. Profitable low input systems. Separating the myth from the magic. Proceedings of the South Island Dairy Event. June 23- 25 2008, Invercargill, New Zealand. pp. 81-91. Retrieved from http://www.dairynz.co.nz/page/pageid/21458 59470/Dairy_Industry_Conference_Publicati ons
Saravanakumar, V., and Jain, D.K., 2007. Technical efficiency of dairy farms in Tamil Nadu. In Poster Presented in the International Conference on Statistics and Informatics in Agricultural Research, from 27th to 30th December, 2006 at IASRI, New Delhi, India. Staal S.J., Alejandro, N. P., & Jabber, M., 2008. Dairy
development for the resource poor Part 2: Kenya and Ethiopia dairy development case studies pro-poor livestock policy initiative. Retrieved from http://www.igad-lpi.org/publication/docs/IGADLPI_WP _MK.pdf