UNIVERSITÉ DE MONTRÉAL
SYNTHESIS AND CHEMICAL AND MORPHOLOGICAL CHARACTERIZATION OF RUTHENIUM-BASED NANOPARTICLES
ROKSANA BAVANDSAVADKOUHI DÉPARTEMENT DE GÉNIE PHYSIQUE ÉCOLE POLYTECHNIQUE DE MONTRÉAL
THÈSE PRÉSENTÉE EN VUE DE L’OBTENTION DU DIPLÔME DE PHILOSOPHIAE DOCTOR
(GÉNIE MÉTALLURGIQUE) DÉCEMBRE 2016
UNIVERSITÉ DE MONTRÉAL
ÉCOLE POLYTECHNIQUE DE MONTRÉAL
Cette thèse intitulée :
SYNTHESIS AND CHEMICAL AND MORPHOLOGICAL CHARACTERIZATION OF RUTHENIUM-BASED NANOPARTICLES
présentée par : BAVANDSAVADKOUHI Roksana
en vue de l’obtention du diplôme de : Philosophiae Doctor a été dûment acceptée par le jury d’examen constitué de : M. MARTINU Ludvik, Ph. D., président
M. SACHER Edward, Ph. D., membre et directeur de recherche M. YELON Arthur, Ph. D., membre et codirecteur de recherche M. MEUNIER Michel, Ph. D., membre
DEDICATION
ACKNOWLEDGEMENTS
This thesis has been completed with the support and encouragement of numerous people. It is my pleasure to express gratitude to all those who contributed in many ways to make it an unforgettable experience for me.
First and foremost, I would like to express my utmost appreciation and gratitude to Professor Edward Sacher and Professor Arthur Yelon for their unconditioned support and dedicated time. Their guidance helped me in all the time of research and writing of this thesis. I could not have imagined having better advisors and mentors for my PhD study.
Professor Edward Sacher, the director of my thesis, has trusted me in my research career over the past four years and has given me the honor of working with him. Without his generous support, scientific insight, and invaluable guidance, this thesis would have been impossible. During the course of my PhD studies, I enjoyed the pleasure of being his student and benefited from his enlightening supervision, encouragement, and dedication.
Professor Arthur Yelon was my co-director, to whom I would like to express my gratitude for his contributions and priceless help. Under his guidance, I successfully overcame many difficulties and also enjoyed his incredible knowledge and insight, constructive criticism and his extensive discussions around my research work.
Mme. Josianne Lefebvre, research associate in the “Laboratoire pour l'Analyse de la Surface des Matériaux” (LASM), has always inspired me with her scientific approach, enthusiasm, and motivation. I had the pleasure of working with her during these years and her continuous encouragement helped me face the different obstacles that I encountered during my research. I extend my sincere thanks to all members of the Department of Engineering Physics, and all those who contributed directly or indirectly to the dissertation. In particular, I wish to thank Lyne Dénommé and Elisabeth Delépine for helping me to resolve administrative affairs.
Moreover, I would like to express my appreciation to the members of my thesis exam committee, Professors Ludvik Martinu, Michel Meunier, Daniel Guay, and Michael Buschmann, for their valuable time and their encouraging comments.
Several people have helped me with my experimental research studies. I especially thank Jean-Phillipe Massé, research associate in the “Centre de Caractérisation Microscopique des
Matériaux” (CM)2, for not only implementing the TEM measurements, but also kindly responding my scientific questions. My gratefulness goes to Patricia Moraille, research associate at the “Laboratoire de Caractérisation des Matériaux”, Phillipe Plamondon, research associate at (CM)2 for their advice and help. I thank Professor Remo A. Masut, responsible at Laboratoire D'épitaxie et de Caractérisation de Semi-Conducteurs Composés for letting me use his equipment, and Nima Nateghi, for showing me how to use it. I also thank Professor Gianluigi Botton, the scientific director at the Canada Research Chair in Electron Microscopy of Nanoscale Materials at McMaster University, and Professor Shuhui Sun, at the “Institut National de la Recherche Scientifique”, INRS, for their insightful ideas and contribution in our collaborative research studies. Finally, I thank Drs. Gaixia Zhang (INRS) and Long Chen (PNNL) for their helpful advice.
I express my gratefulness to Sorouch Hafezian, for helping me with French transcriptions and scientific discussions. I warmly thank my friends, Laura Karina Mireles, Qiliang Wei, Simon Loquai, Jaber Shabanian, Laleh Dashtban, Maryam Fereydoon, Hamed Jazayeri, Ali Seifi, Marzieh Ghasemi, and Saman Choubak, for their support and presence during my PhD studies. Further, my special thanks go to my colleagues with whom I shared an office, Fabrice Pougoum, Jincheng Qian, and Erika Herrera.
Last but not least, I would especially like to express my deepest gratitude to my husband, Hossein, who has always supported me during stressful and difficult moments. You should know that your support and encouragement was worth more than I can express on paper. I express my gratitude toward my family. My brother, Behnam, and my sister-in-law, Zeinab, and my lovely niece, Benita, have always encouraged me with their support and wishes. My profound appreciation goes to my parents, Zohreh and Vandad, for their unconditioned love and everlasting support. I am utterly indebted to my beloved parents for they have been nourishing my insatiable desire for knowledge throughout my life. You made me live the most unique, magic, and carefree childhood that has made me who I am now! I simply cannot thank them enough.
The work, presented in this thesis, was supported by the Natural Sciences and Engineering Research Council (NSERC) of Canada. I gratefully acknowledge this support.
RESUME
Le développement de sources d'énergie verte, renouvelable avec des rendements élevés, sont nécessaires comme alternatives aux combustibles fossiles. Les piles à combustible à membrane échangeuse de protons et les piles à combustible à méthanol direct sont des candidats prometteurs pour les sources d'énergie fixes et portables. Cependant, l’électrocatalyseur le plus couramment utilisé, le platine (Pt), est dispendieux et la réserve mondiale est limité. En outre, la cinétique des réactions des réductions de l'oxygène et l'oxydation du méthanol sur Pt sont lentes, ce qui entraîne une perte de performance. Par conséquent, trouver un électrocatalyseur alternatif ou réduire la charge de Pt par alliage, et l'amélioration de la performance catalytique, sont d'une grande importance dans la commercialisation de technologies de piles à combustible.
Parmi les différents candidats pour les catalyseurs contenant une faible concentration de Pt, les alliages bimétalliques PtRu peuvent répondre aux exigences de performance, tout en réduisant les coûts et en augmentant la durabilité. Notre but est de synthétiser ces catalyseurs en utilisant la méthode de dépôt en phase vapeur, et de réaliser in-situ et ex-situ des analyses pour déterminer en détail la structure et la chimie de la surface, où se fait la catalyse. Par conséquent, cette thèse est divisée en deux phases : d'abord, la préparation et la caractérisation de pures nanoparticules de ruthénium (Ru NPs) déposés sur graphite pyrolytique hautement orienté (HOPG). En combinant cette information avec nos informations précédemment obtenu sur le Pt [1], la deuxième phase comprend la préparation et la caractérisation des alliages de PtRu NPs déposées sur le même substrat.
Les Ru NPs fonctionnent comme des catalyseurs efficaces pour des réactions spécifiques, telles que la méthanation et la synthèse de Fischer-Tropsch [2]. Dans la première phase de cette thèse, il est notre but de présenter une caractérisation physique et chimique des surfaces, par spectroscopie de photoélectrons par rayons X (XPS), sensible à la surface, et en utilisant la technique d'analyse des composantes de pics symétriques développée dans notre laboratoire, pour révéler les composants précédemment obscurcis.
Les Ru NPs étaient déposés par évaporation (0,25 à 1,5 nm d’épaisseur nominale) sur HOPG. Notre utilisation de l’analyse de composant par pics symétriques par XPS a révélé des informations détaillées sur des pics, non préalablement identifiées, d’oxyde en surface initialement formée, ainsi que sur la structure électronique de la bande de valence et sa variation
avec la taille des nanoparticules, une information qui est d'une grande importance dans l'utilisation de ces NP en catalyse.
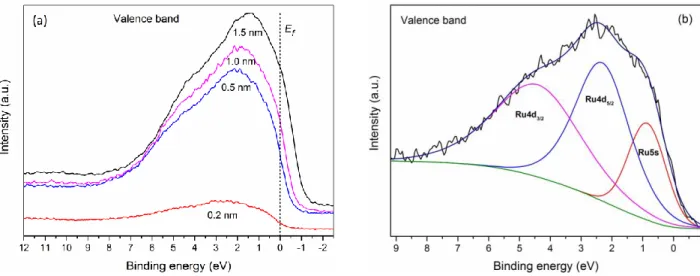
Chacun des spectres du Ru caractérisés par XPS (3d, 3p et 3s) contient trois composantes symétriques, ainsi que des composantes O1s de deux oxydes métalliques, montrant un oxyde assez complexe initialement formé. Les spectres de la bande de valence du Ru (4d et 5s) démontrent clairement une perte de métallicité, une augmentation simultanée de l'écart Kubo, et un transfert significatif de la densité d'électrons de valence du 4d aux 5s orbitales (connu sous le nom d'électron spill-over), quand le dépôt diminue en dessous de 0,5 nm.
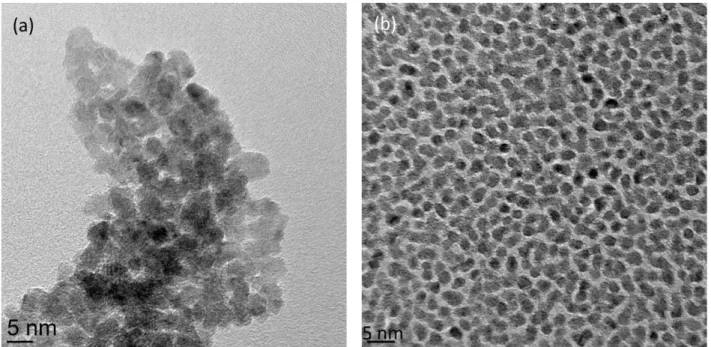
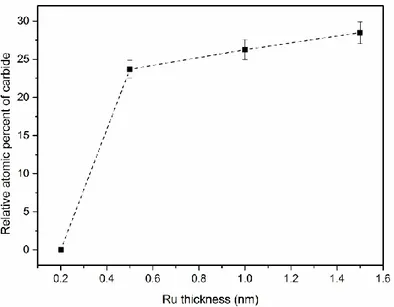
En plus des caractérisations des surfaces par XPS, une indication de la morphologie a été obtenue à partir de la microscopie électronique en transmission (TEM). Les microphotographies TEM en fonction du taux de dépôt montrent qu’à un taux qui ne permet pas la dissipation de l'énergie de condensation des NP, celles-ci, bien qu’initialement séparées sont capables de diffuser latéralement, de s’agréger et à coalescer de façon partielle. Cela indique une liaison faible des NPs sur le substrat HOPG. De plus, le carbure de Ru se forme à des taux faibles et élevée pour des épaisseurs supérieures à 0,25 nm, dû à la réaction des NPs de Ru réagissant avec la vapeur d'hydrocarbure résiduel, sous l'influence de la chaleur de condensation libérée lors du dépôt du Ru, et non pas par réaction de Ru avec le substrat d’HOPG.
Dans la deuxième phase de cette thèse, nous avons caractérisé la formation des alliages PtRu NPs (1:1), déposées sur HOPG, en utilisant XPS et par la spectroscopie de masses d’ion secondaire à mesure de temps de vol in-situ, angle élevé annulaire et champ sombre / microscopie électronique à balayage par transmission, et spectroscopie de perte d'énergie des électrons ex situ. Nous avons utilisé trois ordres de dépôt de métal : Pt déposé sur Ru, Ru déposé sur Pt et les deux métaux déposés en même temps, puis suivi les évolutions des alliages en fonction de la température de recuit. Les spectres C1s, O1s, Ru3d et Pt4f niveau de cœur et le Ru4d, 5s et Pt5d, 6s niveau de valence ont été employés pour décrire les interactions d'alliage entre les métaux. Pour toutes les méthodes de dépôt, le Ru diffuse à la surface des NPs à travers le Pt, et non l'inverse. Certains chercheurs ont affirmé que le Pt [3-5], un autre a montré que le Ru [6, 7], se trouve à la surface des NPs. Cette incohérence a présenté un défi pour déterminer la structure optimale. Dans notre étude, chacune des méthodes de préparation a produit une structure de surface qui diffère de celles des autres, même après un recuit prolongé à des températures supérieures à 700 ° C, ce qui
suggère pourquoi il y a une telle confusion dans la littérature concernant la caractérisation physico-chimique de PtRu NPs.
ABSTRACT
The development of green, renewable energy sources, with high efficiencies, is required as an alternative for fossil fuel. Both proton exchange membrane and direct methanol fuel cells are promising candidates for stationary and portable power sources. However, the most commonly used electrocatalyst, Platinum (Pt), is expensive and the world’s supply is limited. In addition, both the oxygen reduction and methanol oxidation reactions kinetics on Pt are sluggish, which results in performance loss. Therefore, finding an alternative electrocatalyst or reducing the Pt loading by alloying, and improving catalytic performance, are of great importance in the commercialization of fuel cell technologies.
Among various low-Pt catalyst candidates, bimetallic PtRu nanoparticles (NPs) may well meet performance requirements, along with reducing cost and increasing durability. It is our aim to synthesize such catalysts, using vapor deposition, and to carry out in-situ and ex-situ analyses to determine the surface structure and chemistry in detail, because the surface is where catalysis takes place. Hence, this thesis is divided into two phases: first, the preparation and characterization of pure Ruthenium (Ru) nanoparticles deposited onto highly oriented pyrolytic graphite (HOPG). By combining this information with our previously obtained information of pure Pt [1], the second phase involves the preparation and characterization of PtRu NPs deposited onto the same substrate.
Ru NPs function as effective catalysts in specific reactions, such as methanation and Fischer-Tropsch syntheses [2]. In the first phase of this thesis, it is our purpose to physicochemically characterize their surfaces, at which catalysis occurs, by surface-sensitive X-ray photoelectron spectroscopy (XPS), using the symmetric peak component analysis technique developed in our laboratory, to reveal previously obscured components.
Ru NPs were deposited by evaporation (0.25-1.5 nm nominal deposition range) onto HOPG. Our use of symmetric peak component XPS analysis has revealed detailed information on a previously unidentified surface oxide initially formed, as well as on the valence electronic structure and its variation with nanoparticle size, information that is of potential importance in the use of these NPs in catalysis.
Each of the several Ru core XPS spectra characterized (3d, 3p and 3s) was found to be composed of three symmetric components, of which two were metal oxide O1s components, giving evidence of a rather complex, previously unidentified oxide that is initially formed. The Ru valence band (4d and 5s) spectra clearly demonstrate a loss of metallicity, a simultaneous increase of the Kubo gap, and an abrupt transfer in valence electron density from the 4d to the 5s orbitals (known as electron spill-over), as the deposition is decreased below 0.5 nm.
In addition to their surfaces being characterized by XPS, an indication of morphology was obtained from transmission electron microscopy (TEM). TEM photomicrographs, as a function of deposition rate, show that, at a rate that gives insufficient time for the NP condensation energy to dissipate, the initially well-separated NPs are capable of diffusing laterally, aggregating and partially coalescing. This indicates weak NP bonding to the HOPG substrate. Carbide is formed, at both high and low deposition rates, at Ru deposition thicknesses greater than 0.25 nm, as Ru NPs react with residual hydrocarbon vapor, under the influence of the heat of condensation released on Ru deposition, and not by Ru reaction with the HOPG substrate.
In the second phase of this thesis, we characterized the formation of 1:1 PtRu NPs, deposited onto HOPG, using in-situ XPS and time-of-flight secondary ion mass spectrometry, ex-situ high-angle annular dark-field/scanning transmission electron microscopy, and electron energy loss spectroscopy. We used three different orders of metal deposition: Pt deposited onto Ru, Ru deposited onto Pt and both metals deposited simultaneously, and then followed the evolutions of the alloys as a function of annealing temperature. The C1s, O1s, Ru3d and Pt4f core level and the Ru4d,5s and Pt5d,6s valence level spectra were employed to describe the alloying interactions between the metals. For all deposition methods, Ru diffused to the NP surface through the Pt, and not the reverse. Although some researchers claimed that Pt was found at the surface [3-5], some other proposed that it was Ru [6, 7]. This inconsistency has presented a challenge in determining the optimum structure. In our study, each of the preparation methods was found to produce a surface structure that differed from those of the others, even after prolonged annealing at temperatures over 700ºC, suggesting why there is such confusion in the literature concerning the physicochemical characterization of PtRu NPs.
TABLE OF CONTENTS
DEDICATION ... III ACKNOWLEDGEMENTS ... IV RESUME ... VI ABSTRACT ... IX TABLE OF CONTENTS ... XI LIST OF TABLES ... XV LIST OF FIGURES ... XVI LIST OF SYMBOLS AND ABBREVIATIONS... XXIICHAPTER 1 INTRODUCTION AND ORGANIZATION OF THE THESIS ... 1
1.1 Proton Exchange Membrane Fuel Cells (PEMFC) & Direct Methanol Fuel Cells (DMFC) ... 1
1.2 Ru-based Nanoparticle Catalytic Activity in PEMFCs and DMFCs (Problem Identification) ... 4
1.2.1 Challenges for Pt NP electrocatalysts ... 5
1.2.2 Challenges for PtRu NP electrocatalysts ... 6
1.3 Objectives of the Thesis ... 7
1.3.1 Specific objectives ... 7
1.4 Outline of the Thesis ... 8
CHAPTER 2 EXPERIMENTAL APPROACH ... 9
2.1 Physical Vapor Deposition (PVD) ... 9
2.1.1 Electron beam (e-beam) evaporation ... 9
2.2 Surface Analysis Techniques ... 10
2.2.1 X-ray Photoelectron Spectroscopy (XPS) ... 10
2.3 Bulk Analysis Techniques ... 18
2.3.1 Transmission Electron Microscopy (TEM)... 18
2.3.2 High-Angel Annular Dark-Field / Scanning Transmission Electron Microscopy (HAADF/STEM) ... 20
CHAPTER 3 X-RAY PHOTOELECTRON SPECTROSCOPIC AND MORPHOLOGIC STUDIES OF RU NANOPARTICLES DEPOSITED ONTO HIGHLY ORIENTED PYROLYTIC GRAPHITE ... 24
3.1 Introduction ... 24
3.2 Synthesis of Ru NPs, in-situ and ex-situ characterization methodes ... 24
3.3 Results ... 25
3.3.1 XPS Spectra ... 25
3.3.2 C1s-Ru3d Spectra ... 26
3.3.3 A Comparison with Earlier Work – Lack of Electronic Structural Differences between Ru NP Surface and Volume ... 28
3.3.4 Ru3p Spectra ... 30
3.3.5 Ru3s Spectra ... 30
3.3.6 O1s Spectra ... 31
3.3.7 Valence Band ... 32
3.3.8 XPS Analysis of Ru NPs as a Function of Deposition Rate ... 33
3.3.9 XPS Analysis of Ru NPs as a Function of Nominal Thickness ... 33
3.3.10 Ru NP Size and State of Aggregation ... 34
3.4 Discussion ... 38
3.4.1 Ru Nanoparticle Reaction with Residual Gases. ... 38
3.4.2 Relationships among the Ru components ... 39
3.4.4 Valence Band Electronic Configuration ... 41
3.5 Conclusions ... 43
CHAPTER 4 STRUCTURE OF PLATINUM-RUTHENIUM ALLOY NANOPARTICLES DEPOSITED ONTO HIGHLY ORIENTED PYROLYTIC GRAPHITE, AND THEIR EVOLUTION WITH ANNEALING ... 45
4.1 Introduction ... 45
4.2 Experimental ... 46
4.2.1 Sample Preparation ... 46
4.2.2 XPS Measurements, Annealing, and XPS Data Analysis ... 46
4.2.3 TOF-SIMS Analysis ... 47
4.2.4 HAADF/STEM and EELS Analysis ... 47
4.3 XPS Results and Discussion ... 48
4.3.1 Core Level Spectra ... 48
4.3.2 Valence Band Spectra ... 59
4.4 TOF-SIMS Results and Discussion... 63
4.4.1 Deposit 1 ... 64
4.4.2 Deposit 2 ... 68
4.4.3 Deposit 3 ... 72
4.5 HAADF/STEM and EELS Results and Discussion ... 76
4.5.1 Deposit 1 ... 76
4.5.2 Deposit 2 ... 78
4.5.3 Deposit 3 ... 80
4.6 PtRu Alloy NP Formation during the Annealing Process ... 82
4.7 Attributions of Ru and Pt XPS Components ... 84
4.7.2 Deposit 2 ... 86
4.7.3 Deposit 3 ... 90
4.7.4 Relative concentrations of Ru and Pt in the three deposits ... 93
4.8 The Ultimate Surface Compositions of PtRu Alloy NPs ... 94
4.9 Conclusion ... 95
CHAPTER 5 PRESENTLY ONGOING RESEARCH – CATALYST EVALUATION ... 97
5.1 Introduction ... 97 5.2 Experimental ... 97 5.2.1 Sample Preparation ... 97 5.2.2 Electrochemical Measurements ... 98 5.3 Electrochemical Performance ... 98 5.4 TEM Analysis ... 99
5.5 Comparison of Electrochemical and XPS Results ... 101
5.6 Conclusion ... 102
CHAPTER 6 CONCLUSION, FURTHER WORK, AND RECOMMENDATIONS ... 103
6.1 Conclusions ... 103
6.2 Future Work and Recommendations ... 106
LIST OF TABLES
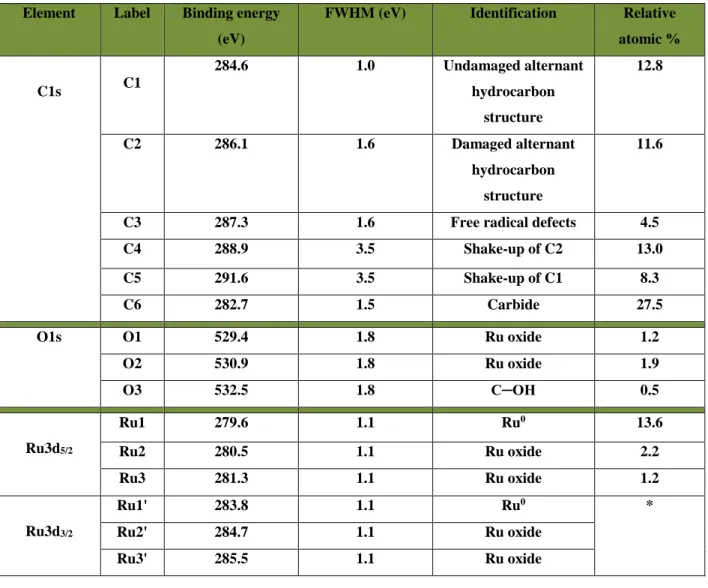
Table 2.1: Spin-orbit splitting parameters. ... 13 Table 3.1: Peak components and attributions for a nominal deposition of 1.5 nm Ru evaporated onto HOPG. ... 27 Table 4.1: Peak components and attributions for a nominal deposition of 15 nm Ru evaporated onto HOPG, identical to those previously found for Ru [123]. ... 50 Table 4.2: Peak components and attributions for a nominal deposition of 15 nm Pt evaporated onto HOPG, identical to those previously found for Pt [1]; the peak components of C1s spectrum are identical to those for pure Ru, in Table 4.1. ... 50 Table 4.3: Valence band peak components and their binding energies and fwhm values for pure Ru and Pt evaporated onto HOPG and deposits 1-3. ... 60 Table 4.4 : Peak components and attributions for deposit 1, at room temperature, except where noted above 350°C. ... 85 Table 4.5 : Peak components and attributions for deposit 2, at room temperature, except where noted above 350°C. ... 88 Table 4.6: Peak components and attributions for deposit 3, at room temperature, except where noted above 350°C. ... 91 Table 4.7: The characteristics and differences in deposits 1, 2, and 3. ... 95 Table 5.1: Component fractions of Ru, Pt, C, and O, in deposits 1-3, obtained from XPS data. 101
LIST OF FIGURES
Figure 2.1: Schematic of electron beam evaporation equipment [58]. ... 10
Figure 2.2: Schematic of XPS principle. ... 11
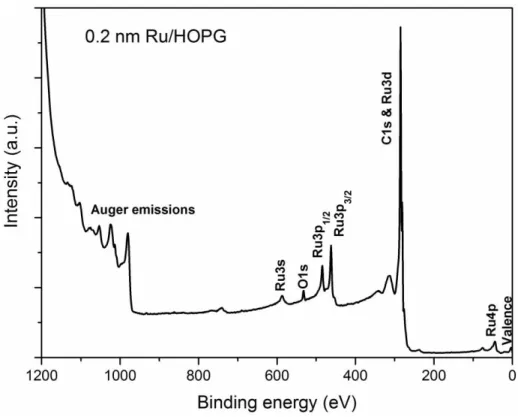
Figure 2.3: XPS survey spectrum of Ru NPs deposited onto HOPG, excited by Mg kα. ... 12
Figure 2.4: A photo of our XPS (VG ESCALAB 3 MARK II). ... 15
Figure 2.5: Schematic of a TOF-SIMS instrument and the three operational options for mass spectrometric of a surface, imaging, and depth profiling [79]. ... 18
Figure 2.6: A diagram of the internal structure of a TEM alongside an example of a TEM instrument [83]. ... 20
Figure 2.7: Schematic of HAADF-STEM-EELS. ... 23
Figure 3.1: XPS spectra for Ru deposited onto HOPG. (a) Evolution of the C1s-Ru3d spectrum as a function of Ru thickness. (b) Deconvolution of the C1s - Ru3d spectrum for a nominal deposition of 1.5 nm. The residual is included, to show the goodness of fit. ... 28
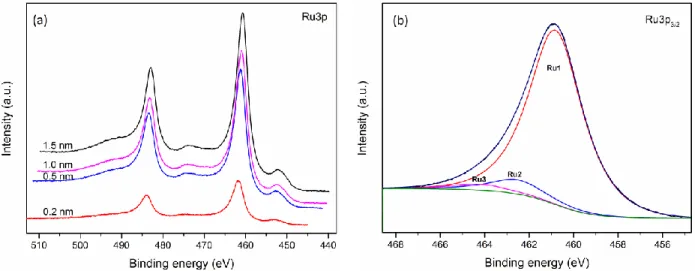
Figure 3.2: XPS spectra for Ru deposited onto HOPG. (a) Evolution of the Ru3p spectrum as a function of Ru thickness. (b) Deconvolution of the Ru3p spectrum for a nominal deposition of 1.5 nm. ... 30
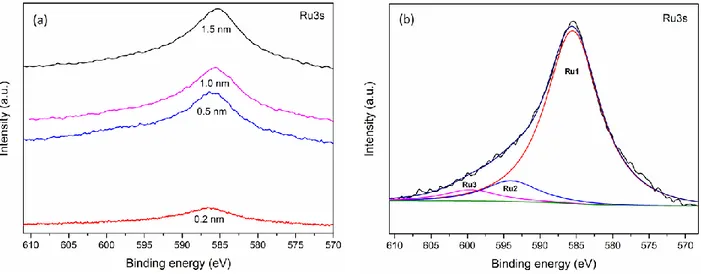
Figure 3.3: XPS spectra for Ru deposited onto HOPG. (a) Evolution of the Ru3s spectrum as a function of Ru thickness. (b) Deconvolution of the Ru3s spectrum for a nominal deposition of 1.5 nm. ... 31
Figure 3.4: XPS spectra for Ru deposited onto HOPG. (a) Evolution of the O1s spectrum as a function of Ru thickness. (b) Deconvolution of the O1s spectrum for a nominal deposition of 1.5 nm. ... 32
Figure 3.5: XPS spectra for Ru deposited onto HOPG. (a) Evolution of the valence band spectrum as a function of Ru thickness. (b) Deconvolution of the valence band spectrum for a nominal deposition of 0.25 nm. ... 32
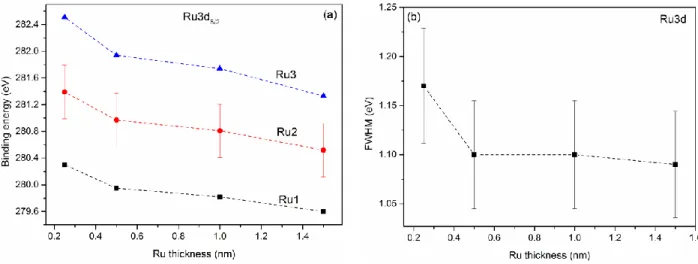
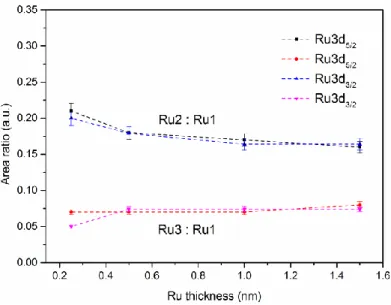
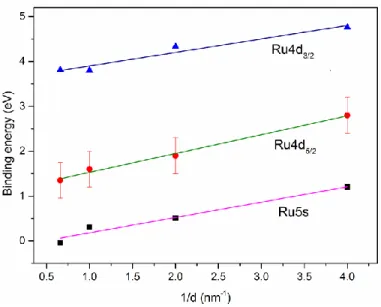
Figure 3.7: Evolutions of Ru3d binding energy (a), and fwhm (b), as a function of Ru thickness. ... 34 Figure 3.8: TEM photomicrographs of nominal 1.5 nm Ru NPs evaporated at (a) high (1.3 nm/min), and (b) low (0.13 nm/min) deposition rates. ... 36 Figure 3.9: EDX spectra of the Ru nanoparticles shown in Figure 3.8. The Cu peaks come from the support grid. ... 37 Figure 3.10: Size distributions of Ru NPs deposited onto HOPG at: (a) high, (b) low deposition rates. ... 37 Figure 3.11: Evolution of the carbide content as a function of Ru thickness. ... 38 Figure 3.12: Evolutions of Ru2:Ru1 and Ru3:Ru1 area ratios, as functions of Ru thickness. ... 39 Figure 3.13: Evolutions of Ru2:O2, Ru3:O1, and Ru3:Ru2 atomic ratios, as functions of Ru thickness. ... 41 Figure 3.14: Evolution of the valence band binding energy as a function of inverse Ru thickness.
... 43 Figure 3.15: Evolution of the 5s/4d area ratio, as a function of Ru thickness. ... 43 Figure 4.1: XPS spectra for Pt deposited on Ru (1:1 mass ratio) onto HOPG (deposit 1) at room temperature. Schematic deconvolutions of the (a) C1s-Ru3d, (b) Pt4p3/2-O1s, (c) Pt4f. ... 51 Figure 4.2: (a) Evolution of the O1s spectrum (01 represents the sample at room temperature and 08 is at the highest temperature), (b) Evolution of the O1s component fractions, both for deposit 1, after annealing at each indicated temperature for 1 h. ... 52 Figure 4.3: Evolution of the binding energies of (a) Ru3d5/2 and (b) Pt4f7/2 component peaks for deposit 1, as a function of annealing temperature. ... 52 Figure 4.4: Evolution of Ru3d and Pt4f fwhm values for deposit 1, as a function of annealing temperature. ... 53 Figure 4.5: Evolution of the component fractions for Ru3d5/2 and Pt4f7/2 for deposit 1, as a function of annealing temperature. Ru1 is due to Ru° in a Ru-rich environment, and Pt1 is surface Pt° in a Pt-rich environment. Ru2 and Pt2 represent Ru in a Pt-rich environment and
Pt in a Ru-rich environment, respectively. The attributions of Ru3 and Pt3 are discussed below. ... 54 Figure 4.6: (a) Evolution of the atomic concentrations, where C refers to both hydrocarbons and carbide, and O, both metallic and organic carbon oxides, and (b) evolution of the total Pt:Ru atomic ratios. ... 55 Figure 4.7: Evolution of the component fractions for C1 and C6 (carbide) for deposit 1, as a function of annealing temperature. ... 55 Figure 4.8 : Schematic deconvolutions of Pt4p3/2-O1s for deposit 2. ... 56 Figure 4.9: (a) Evolution of the component fractions for Ru3d5/2 and Pt4f7/2; Ru1 is due to Ru° in a Ru-rich environment, and Pt1 is surface Pt° in a Pt-rich environment, identical to deposit 1 and 3. Certain fractions of Ru2 and Pt2 represent Ru in a Pt-rich environment, and Pt in a Ru-rich environment, respectively. Attributions of the other fractions, along with the attributions of Ru3 and Pt3 are discussed later. (b) Evolution of the atomic concentrations for all elements, C refers to both hydrocarbons and carbide, and O represents both metallic and organic carbon oxides, and (c) evolution of the total Pt:Ru atomic ratios for deposit 2, as a function of annealing temperature. ... 58 Figure 4.10: Evolution of the component fractions for C1 and C6 (carbide) for (a) deposit 2, (b) deposit 3, as a function of annealing temperature. ... 58 Figure 4.11: (a) Schematic separation of the valence band spectrum for deposit 1, at room temperature, (b) Evolution of the valence band spectra for deposit 1, as a function of annealing temperature; 1 to 8 represent the samples at room temperature, 150, 250, 350, 450, 580, 720, 770°C, respectively. ... 61 Figure 4.12: Evolution of fwhm of valence band components, (a) deposit 1, (b) deposit 2, and (c) deposit 3, as a function of annealing temperature. ... 62 Figure 4.13: Comparison of the valence band spectra among pure Ru, pure Pt, each of them deposited separately onto HOPG, at room temperature and deposit 1, 2, and 3, at (a) room temperature and (b) after annealing at 715ºC. ... 63 Figure 4.14: High resolution TOF-SIMS comparisons of (a) Ru+ fragment, and (b) Pt- fragment, for deposit 1, as a function of annealing, of PtRu NPs onto HOPG. ... 64
Figure 4.15: High resolution TOF-SIMS comparisons of (a) Ru2+ fragment, (b) Pt2- fragment, and (c) Ru3+ fragment, for deposit 1, as a function of annealing, of PtRu NPs onto HOPG. ... 65 Figure 4.16: Positive SIMS spectra of Ru related fragments at room temperature of deposit 1. ... 66 Figure 4.17: Negative SIMS spectra of Pt related fragments at room temperature of deposit 1. .. 66 Figure 4.18: High resolution SIMS comparisons of (a) RuO+ fragment, and (b) PtOx- fragment, for deposit 1, as a function of annealing, of PtRu NPs onto HOPG. ... 67 Figure 4.19: High resolution positive SIMS comparisons of PtRu+ fragment for deposit 1, as a function of annealing, of PtRu NPs onto HOPG. ... 68 Figure 4.20: High resolution SIMS comparisons of (a) Ru+ fragment, and (b) Pt- fragment, for deposit 2, as a function of annealing, of PtRu NPs onto HOPG. ... 69 Figure 4.21: High resolution SIMS comparisons of C2H- fragment, for deposit 2, as a function of annealing, of PtRu NPs onto HOPG. ... 70 Figure 4.22: High resolution SIMS comparisons of (a) Ru2+ fragment, (b) Pt2- fragment, and (c) Ru3+ fragment, for deposit 2, as a function of annealing, of PtRu NPs onto HOPG. ... 70 Figure 4.23: High resolution SIMS comparisons of (a) RuO+ fragment, and (b) PtOx- fragment, for deposit 2, as a function of annealing, of PtRu NPs onto HOPG. ... 71 Figure 4.24: High resolution positive SIMS comparisons of PtRu+ fragment for deposit 2, as a function of annealing, of PtRu NPs onto HOPG. ... 72 Figure 4.25: High resolution SIMS comparisons of (a) Ru+ fragment, and (b) Pt- fragment, for deposit 3, as a function of annealing, of PtRu NPs onto HOPG. ... 73 Figure 4.26: High resolution SIMS comparisons of (a) Ru2+ fragment, (b) Pt2- fragment, and (c) Ru3+ fragment, for deposit 3, as a function of annealing, of PtRu NPs onto HOPG. ... 74 Figure 4.27: High resolution SIMS comparisons of (a) RuO+ fragment, and (b) PtOx- fragment, for deposit 3, as a function of annealing, of PtRu NPs onto HOPG. ... 74 Figure 4.28: High resolution positive SIMS comparisons of PtRu+ fragment for deposit 3, as a function of annealing, of PtRu NPs onto HOPG. ... 75
Figure 4.29: STEM images of PtRu NPs onto HOPG at (a) room temperature, (b) 650°C, in deposit 1. Dashed arrows point to Ru-rich areas, full arrows point to Pt-rich areas. ... 77 Figure 4.30: EELS elemental mapping of Ru and Pt in PtRu NPs on HOPG at (a) room temperature, (b) 650°C, in deposit 1. ... 78 Figure 4.31: (a) STEM-HAADF image of the cross-section of deposit 2; (b) EELS elemental map of Pt (green) and Ru (red). The uniform blend of colors indicates that the Pt and Ru distribution is uniform. (c) cross-sectional STEM image of PtRu NPs on HOPG at room temperature, obtained when the sample is tilted; The substrate, the PtRu nanoparticles and the protective layers are indicated; (d) EELS elemental mapping of Pt (green) and Ru (red) obtained when deposit 2 the sample is tilted by about 12 degrees and as shown in the HAADF image (c). ... 79 Figure 4.32: (a) EELS elemental map (b) STEM image, of PtRu NPs on HOPG annealed at 650°C, in deposit 2. The sample is slightly tilted, as discussed in Fig. 4.31, to show the individual particles, so that the apparent thickness is not representative of the actual deposit thickness. ... 80 Figure 4.33: EELS elemental mapping of PtRu NPs on HOPG at room temperature, in deposit 3. The HOPG substrate is on the left side of the image. ... 81 Figure 4.34: EELS elemental mapping of PtRu NPs on HOPG annealed at 650°C, in deposit 3. The HOPG substrate is on the left side of the image. ... 81 Figure 4.35: Atomic ratios of Pt3/Ru3 and (a) Pt3:O1, (b) Ru3:O1, as a function of annealing, for deposit 1. ... 83 Figure 4.36: Atomic ration of (a) Pt3:O1, (b) Ru3:O1, and Pt3:Ru3, as a function of annealing, for deposit 2. ... 87 Figure 4.37: Atomic ratio of O1, which is subtracted from Ru3; the remainder is Ru3 in PtRu alloy (deposit 2). ... 88 Figure 4.38: (a) Evolution of the Ru2: O2 atomic ratio for PtRu NPs (b) Atomic ratio of O2, which is subtracted from Ru2; the leftover is Ru2 in Pt environment (deposit 3); the negative values are uncertainties due to measurements. ... 90
Figure 4.39: Atomic ration of (a) Pt3:O1, (b) Ru3:O1, and Pt3:Ru3, as a function of annealing, in deposit 3. ... 91 Figure 5.1: CV plots of methanol oxidation for all deposits 1-3 and pure Pt. ... 99 Figure 5.2: TEM photomicrographs of PtRu NPs deposited onto carbon paper at (a) room temperature, (b) 650°C. ... 100 Figure 5.3: EDS spectra of the PtRu NPs shown in Figure 5.2. The Cu peaks come from the support grid. ... 101
LIST OF SYMBOLS AND ABBREVIATIONS
CO Carbon monoxide
CNT Carbon nanotube
CV Cyclic voltammetry
DMFC Direct methanol fuel cell
ESCA Electron Spectroscopy for Chemical Analysis
E-beam Electron beam
EDS (or EDX) Energy Dispersive X-ray Spectroscopy EELS Electron energy loss spectroscopy
FWHM Full width half maximum
FIB Focused ion beam
HOPG Highly oriented pyrolytic graphite HAADF High angle annular dark field
IMFP Inelastic mean free path
MOR Methanol oxidation reaction
NPs Nanoparticles
OER Oxygen evolution reaction
PVD Physical vapor deposition
STEM Scanning transmission electron microscopy
SEM Scanning electron microscopy
SCLS Surface core level shift
TOF-SIMS Time-of-Flight secondary ion mass spectrometry
TEM Transmission electron microscopy
CHAPTER 1
INTRODUCTION AND ORGANIZATION OF THE
THESIS
1.1 Proton Exchange Membrane Fuel Cells (PEMFC) & Direct Methanol Fuel Cells (DMFC)
The increase of environmental pollution challenges, fossil fuel depletion, the fluctuation of oil prices, and climbing global energy demand necessitate the alternative of efficient energy-converting devices, instead of fossil fuel. Over the last few years, this demand has been satisfied, to some extent, by using fuel cells, which are recognized as clean, silent, power sources with high efficiencies. These fuel cells have been proposed as appropriate power generators, which convert the chemical energy of fuel (such as hydrogen, methanol, ethanol, etc.) into electrical energy with minimal environmental pollution [8-10]. There are five different main categories of fuel cells, in which their classification is generally based on the electrolytes used. One of the best known, and used, is the proton exchange membrane fuel cell (PEMFC). This fuel cell uses hydrogen as a fuel and oxygen from the air as an oxidant. PEMFCs have high energy conversion efficiencies, good performance capabilities, and quick startup at low temperatures, which make them the most promising candidates for portable and transportation applications [10, 11]. The main components of fuel cells are anode, cathode, and electrolyte. In PEMFCs, at the anode, catalyst causes the hydrogen to split into H+ and electrons. The positively charged hydrogen ions and electrons reach to the cathode by passing through the proton exchange membrane electrolyte and an external circuit, respectively. At the cathode, the electrons and H+ combine with oxygen to produce water as the only final product [12]. The electrochemical reactions in both anode and cathode, along with the overall reaction are:
At the anode: H2 → 2H+ + 2e
-At the cathode: ½ O2 + 2H+ + 2e- → H2O
Overall reaction: H2 + ½ O2 → H2O
The direct methanol fuel cell (DMFC) is a variation of the PEMFC, which has advantages over PEMFC systems. The DMFC uses methanol as a fuel, without the need of reforming reactions.
One of the drawbacks with PEMFC is the hydrogen fuel, due to difficulties related to its storage, transportation and infrastructure issues. Methanol is liquid at room temperature, making it easier and safer for storage and use in fuel cells. In addition, the methanol oxidation process in DMFCs transfers six electrons, while the hydrogen oxidation reaction in PEMFCs transfers only two electrons. This indicates that reactions in DMFCs produce three times as much energy as than those of in PEMFC [13, 14]. DMFCs, methanol is oxidized at the anode to produce carbon dioxide, while oxygen molecules from the air are reduced to OH- at the cathode. Hence, water is produced by combining OH- with the electrons and protons coming from the anode. The anodic, cathodic, and overall reactions in DMFCs are:
At the anode: CH3OH + H2O → CO2 + 6H+ + 6e
-At the cathode: 3/2 O2 + 6H+ + 6e- → 3H2O Overall reaction: CH3OH + 3/2 O2 → CO2 + 2H2O
The mechanism of this reaction is still a matter of discussion, and different reaction mechanisms have been proposed. The most accepted theory for methanol oxidation consists of two steps: (1) methanol adsorption onto the substrate, (2) oxidation of adsorbed carbon-containing intermediates by adsorbed OH to generate carbon dioxide [15].
The kinetics of oxygen reduction at the cathode is much slower than the methanol oxidation reaction at the anode, and the reaction mechanism is more complex. The cathode reaction in DMFCs is essentially similar to that of PEMFC. Two pathways have been proposed for the oxygen reduction reaction. One is a direct four-electron pathway, and the other is a peroxide pathway [9, 16].
Heterogeneous catalysis by NPs has attracted great attention, due to its relevance in industrial applications. While catalyst deactivation, during operation, is of vital concern [17], narrow size distribution, uniform particle structure, abundant distribution over the support and elevated effective surface area are all necessary for superior catalytic performance [13]. In PEMFCs, Pt NPs are usually the leading choice as the electrocatalyst for hydrogen oxidation at the anode. The hydrogen oxidation reaction is much easier and intrinsically rapid, compared to the oxygen reduction reaction. In the case of using hydrogen generated in-situ by reforming other fuels (such as methanol, propane, natural gas, etc.), the Pt electrocatalyst would be quickly poisoned by even the small quantity of carbon monoxide (CO) present in the reformed fuel. Because CO is
preferentially adsorbed at the Pt electrocatalyst surface, preventing the dissociative adsorption of hydrogen, this results in a performance loss of the electrocatalyst. To circumvent this issue, other electrocatalysts that provide better CO tolerance are required. Based on many research studies that have been carried out in this area, bimetallic PtRu shows better tolerance to CO than Pt [18]. The electrocatalyst for oxygen reduction at the cathode of PEMFCs is usually Pt or Pt-based alloys. The oxygen reduction reaction at the cathode is much slower than the hydrogen oxidation reaction at the anode. This may be related to the strong O – O bond, highly stable Pt – O or Pt – OH, and the possible formation of peroxide (H2O2) intermediate species during the reduction reactions occurring at the Pt surface. However, regarding the complexity of the multi-electron process of the oxygen reduction reaction, disagreements remain on the mechanism for the intermediate species and also on improving the slow kinetics of the oxygen reduction reaction at the cathode [18-20].
In DMFCs, the cathode reaction is essentially identical to that in PEMFCs, but the anode reaction involves methanol oxidation. The slow reaction kinetics of methanol oxidation is due to several factors, such as the associated six-electron transfer process, the adsorption of the reaction intermediate (CO) on the surface of the electrocatalysts and the related poisoning of the electrocatalyst. At present, bimetallic PtRu is known as the state-of-the-art anode electrocatalyst for DMFCs, which can ameliorate the poisoning effects of CO, and shows significantly higher electrocatalytic activity than pure Pt [13, 21]. Two mechanisms have been suggested for the enhanced CO-tolerance associated with PtRu bimetallic catalysts. One is the “reaction-pair”, also called the “bifunctional mechanism”, which indicates the role of Pt in methanol dehydrogenation, while the role of Ru is to provide oxygen-containing species that can easily oxidize the CO adsorbed on Pt sites [15, 22]. The other mechanism is the “electronic effect”, also called the “ligands effect”, positing that the presence of Ru can modify the electronic structure of nearby Pt atoms. Therefore, the change of electronic structure of Pt atoms can affect Pt-adsorbate bonding and, consequently, the electrocatalytic activity of the catalysts [23, 24].
Over the past few years, much effort has been devoted to the development of PEMFC and DMFC technology, applied to most of the stationary and portable devices. There remain several factors preventing the commercialization of these fuel cells, including the high cost involved in the maintenance of the electrolyte and high loading of costly electrocatalyst, low durability, and the
lack of refueling infrastructure [10]. Several of the primary, crucial concerns in PEMFCs and DMFCs are the cost, durability, and performance of their electrocatalysts [11]. Hence, this thesis has been directed to the synthesis and characterization of a Pt alloy electrocatalyst, followed by a deep study on the surface chemical species, in order to reduce the cost and increase the durability of the catalyst. Details concerning several challenges presented by electrocatalysts, and the governing factors on their performance, are discussed in the next section.
1.2 Ru-based Nanoparticle Catalytic Activity in PEMFCs and DMFCs (Problem Identification)
Ru NPs are particularly effective in methanation and Fischer-Tropsch syntheses [2], and also show both a high oxygen evolution reaction (OER) activity and an elevated stability in acidic fuel cell environments [25]. They have been supported on several materials, such as SiO2, Al2O3, zeolites and carbon substrates, where their catalytic properties are significantly influenced by both the substrate and its pretreatment [26]. Among these supports, carbon has been widely studied [27-30]. It was found that the characteristics of the substrate used may modify the growth of the deposited NPs and, thus, affect their electronic properties. Moreover, NP distribution and adhesion may also be affected, influencing the overall device performance [31].
One carbon substrate commonly used to study NPs is highly oriented pyrolytic graphite (HOPG), due to its inert, well-defined, conducting surface, as well as little, if any, electronic interaction with the NPs [27, 32]. Determining the adhesion of Ru NPs to HOPG is of interest since it is regarded as a main feature in the optimization of catalytic activity.
Since the operating temperatures in both PEMFCs and DMFCs are low, the use of an electrocatalyst, to improve their slow electrode kinetics, is inevitable. In order to identify a proper electrocatalyst for PEMFCs and DMFCs, one should follow these criteria: (i) the electrocatalysts should be stable under the operating conditions of these fuel cells, which use acidic electrolyte and usually operate at < 100 °C, (ii) the cost of the electrocatalyst, which is included in the type and loading used, and (iii) the adsorption capacity, a narrow nanoscale size distribution, high dispersion on support, and effective surface area are all necessary factors for a high performance catalyst [10, 13].
1.2.1 Challenges for Pt NP electrocatalysts
Based on the literature, Pt is the most electroactive catalyst in PEMFCs and DMFCs, because of its chemical adsorption properties of both the fuel and the oxidant[10]. However, Pt catalysts still have some drawbacks. First, due to the need of large Pt loading as the electrode catalyst and the depletion of Pt as a natural resource; its use becomes more and more expensive. Second, trace impurities in the reforming fuel, such as CO, may adsorb on the Pt, which hinder active sites, and cause electrocatalyst poisoning. In addition, due to producing CO as an intermediate species in the methanol oxidation reaction in DMFCs, Pt will again be poisoned. Third, the degradation of Pt catalysts is one of the major factors that reduce the lifetime of a PEMFC. catalyst durability is of great importance in lengthening PEMFC operation life, along with enhancing reliability and reducing the total lifetime cost [33]. The degradation of Pt catalysts is considered to be due to agglomeration, leading to increased NP size, the oxidation of the Pt catalyst that occurs at elevated potentials, and the dissolution of Pt catalysts into the electrolyte. Generally, This is due to their high specific surface energy [34]. The smaller sizes of nanoparticles mean higher specific surface areas, making them more inclined to agglomerate [35]. Gonzalez et al. [36] found that, based on the duration tests in PEMFCs, Pt alloyed with non-precious metal catalysts presents higher stability against dissolution than the pure Pt catalysts. In a review, by Shao et al. the authors suggested that the alloyed metals might increase the resistance of Pt to oxidation [33]. Therefore, alloying Pt with other metals can improve catalyst durability [33, 37, 38].
Thus, in order to improve the performance of PEMFCs and DMFCs, reduce the cost of electrocatalysts, and remove the prohibitive factors preventing commercialization of these fuel cells, some alternate electrocatalysts have been studied [9, 10]. Among various low-Pt and Pt-free catalysts, PtRu bimetallic materials are considered to be among the most promising catalysts in such fuel cells, due to their lower cost, high electrocatalytic activity, high tolerance for CO, superior performance in decomposing methanol, and high activity in oxidizing CO to form CO2 [39-43].
Adding a second metal, to form bimetallic NP catalysts, can improve catalytic performance. One of the reasons is thought to be the modification of the bimetallic system d-band structure[44]. For instance, the formation of PtRu alloys increases their d-orbital vacancy[45] because of the less occupied d orbitals of Ru (d7), compared to those of Pt (d9). It has been suggested that the
increased ability of the PtRu bimetallic surface to take on electrons results in the enhancement of the oxidation process [45]. Moreover, water dehydrogenation occurs more readily on Ru, while methanol dehydrogenation occurs more readily on Pt [13, 46]. Thus, Ru can provide preferential sites for OH adsorption by dehydrogenating water [47]. These OH species then cause the complete removal of CO by oxidizing it to CO2. In addition, the introduction of a second metal can change the d-band center of the bimetallic system, due to the variations in the d-band structure. This is because of the changes in the electronic structure of the bimetallic system and the direct electron interactions between two constituent metals. This leads to changes in the bond strength between the component metals. Ling, et al. [44] found that the deposition of Pt onto nanoporous gold results in the d-band center of the bimetallic system being altered and decreased from -3.93 to -4.24 eV. Such a lowering of the d-band center is essential to weaken the binding strength between Pt active sites and intermediate poisoning species. Thus, alloying reduces the poisoning effect and improves the catalytic activity of Pt [44]. However, the kinetic energy that they used probes the whole NP, not only the NP surface. Since the catalysis occurs at the surface, the authors made assumptions that it applies to the surface. We note that the shift of the d-band center may be only one of several contributions to improved catalytic activity.
1.2.2 Challenges for PtRu NP electrocatalysts
The compositions, morphologies, and structures of PtRu alloy NP systems are of great importance for their surface catalytic activities [6]. In order to understand their role in electrocatalysis, so as to improve performance, one must determine and understand the PtRu NP surface structure. Unfortunately, this remains an issue. Some researchers maintain that Pt diffuses into Ru [3-5], while the others claim the reverse [6, 7, 48]. There is also disagreement as to whether Pt [3-5] or Ru [6, 7] is found at alloy NP surfaces, and as to which form surface oxides [3, 6, 49]. This inconsistency has presented a challenge in determining the optimum structure of the PtRu catalyst. Despite this, most theoretical papers contain calculations based on the assumptions that there are no surface contaminants, and that Pt is always at the surface [50]. As we show here, both are incorrect. Many experimental papers also assume the same, probably following the theoretical assumptions. Because of this, determining the structures of PtRu alloy NPs is an essential key to interpreting their catalytic behaviors and optimizing their performance.
Another important issue in electrocatalysts is their preparation method. Different preparation methods, solid phase or liquid phase methods, may result in different particle sizes and surface compositions. Conventional preparation methods, such as deposition-precipitation and impregnation usually have poor control of metal distribution and surface composition [51-53]. Generally, due to the chemical reduction steps in the liquid phase methods, impurities are included in the structure. The solid phase methods are cleaner and simpler, and one of its sub-groups; physical vapor deposition, is employed to prepare the metal and alloy NPs in this thesis. Since electrocatalysis is a surface phenomenon, any variation in the preparation process could lead to differences in the NP surface [54]. For instance, using a preparation method that produces small and well-separated particles will result in more electrocatalyst atoms with a higher surface area to participate in the reaction, which will improve the utilization of the electrocatalyst. On the other hand, using a preparation method that synthesizes large particles, or even agglomerated particles, diminishes the accessible surface area, decreasing durability, along with decreasing the catalyst activity, and finally, reduces the lifetime of the fuel cell. The effect of the preparation methods on the electrocatalysts surface is a subject that has not been addressed sufficiently. 1.3 Objectives of the Thesis
The general objective of this thesis is the formation of Ru-based NPs onto HOPG, as a substrate, by physical evaporation and the subsequent investigation of their surface chemistry and structure, to be employed and optimized as electrocatalysts to enhance the performance of PEMFCs and DMFCs.
1.3.1 Specific objectives
(1) Preparation of pure Ru NPs deposited onto HOPG, to investigate its oxidation states, surface chemical species, and electronic structure of NPs, and also to determine the adhesion of Ru NPs to HOPG.
(2) To obtain well-separated and small sized Ru NPs, and to perform morphological studies on them.
(3) To prepare PtRu bimetallic NPs deposited in several ways (metal 1 over metal 2, and both metals simultaneously), onto HOPG and to investigating their evolutions as a function of annealing temperature.
(4) To investigate the surface chemical reactions between metals and inevitable adventitious gases (hydrocarbons and oxides), on annealing.
(5) To study the variations in electronic structure, phase and crystal structure of NPs during the annealing process.
1.4 Outline of the Thesis
We investigate the chemical, compositional, and structural properties of NP surfaces, where catalysis activities take place. This is done by the synthesis and characterization of Ru-based NPs deposited onto HOPG and their subsequent analyses by several in-situ and ex-situ surface and bulk techniques. This approach provides a more comprehensive knowledge of the surface constitution that will help to optimize catalytic activity and fuel cell performance.
This thesis consists of five chapters. The current chapter; chapter 1, provides an introduction to fuel cells, especially PEMFCs and DMFCs, several main challenges due to Pt and PtRu electrocatalysts, followed by explaining the general and specific objectives and organization of the thesis. Chapter 2 includes the basic principles of the several surface and bulk experimental tools that were employed in this thesis to investigate the Ru-based NPs. The principle results of this thesis are described in the chapters 3 and 4, and in the appendices.
Chapter 3 presents the preparation of Ru NPs, which are deposited onto HOPG at different thicknesses, using low and high deposition rates. In-situ XPS characterization and ex-situ morphological studies of Ru NPs were carried out in order to investigate the behavior of these NPs. This knowledge was used with our group’s previous study on Pt NPs [1] in the preparation of the PtRu NPs.
Chapter 4 describes the synthesis and characterization of the PtRu bimetallic NPs using three different orders of deposition, deposited onto HOPG. The differences among these three PtRu NPs, in terms of surface and bulk characteristics, are studied by using several analytical and morphological techniques. We wish to fully understand the surface chemistry and structure of PtRu bimetallic NPs, to help us to understand the reasons necessary for catalysis optimization. Chapter 5 focuses on the discussions and conclusions of this thesis and recommendations for future work.
CHAPTER 2
EXPERIMENTAL APPROACH
This work proceeded in two phases, using physical deposition of the metals: one concerns the synthesis of Ru NPs, and the other, the preparation of PtRu NPs, both on HOPG, using three different orders of metal deposition. The preparation protocols of these two phases are described in detail in the Experimental sections of chapters 3 and 4. Several surface and bulk analytical techniques were employed to study surface chemistry, composition, and crystal structure. This chapter discusses the basic principles of these techniques. More specific procedures for each technique are given in the chapters 3 and 4.
2.1
Physical Vapor Deposition (PVD)Physical vapor deposition (PVD) is one of the methods used to produce nanoparticles. PVD employs physical processes, such as heating or sputtering, to produce a vapor, which is followed by condensation onto the substrate [55]. Particles or thin films coated by PVD exhibit excellent coating adhesion, durability and high purity [56]. PVD is partitioned into various sub-groups. One such sub-group, electron beam evaporation, is described in the following section. This is the method utilized in this thesis, to prepare all the NPs.
2.1.1 Electron beam (e-beam) evaporation
The e-beam evaporation method is of great interest due to its high efficiency in material utilization, the structural and morphological control of particles by adjusting the deposition rate, and the significant distribution of the evaporant on the substrate. Figure 2.1 depicts a typical e-beam evaporator. In this technique, the filament is heated to produce a e-beam of electrons. Their path is directed and bent by the deflecting and focusing magnets located in the chamber. The electron beam concentrates large amounts of heat onto a very small area in order to evaporate the material to be deposited. The material evaporated is able to move freely in the vacuum chamber until it condenses onto the substrate surface; this is because deposition in e-beam evaporation systems is always conducted under high vacuum conditions, in which the evaporated particles move from the source to the substrate without colliding with residual gases [57]. E-beam evaporators have the lowest deposition rate (0.01-0.03 Å/s); in our study, this turns to an advantage, as discussed in the Chapter 3. This technique has been particularly fruitful in the production of alloys by evaporating two or more materials.
Figure 2.1: Schematic of electron beam evaporation equipment [58].
2.2 Surface Analysis Techniques
Obtaining a complete description of a surface is always beneficial for surface applications, such as for catalysts and sensors. For this purpose, several surface analysis techniques are required to investigate the surface atomic composition and electronic structure of surface components. Here, two of the most useful surface techniques, XPS and TOF-SIMS, are discussed.
2.2.1 X-ray Photoelectron Spectroscopy (XPS)
X-ray photoelectron spectroscopy, also known as ESCA (Electron Spectroscopy for Chemical Analysis), is a surface technique that is capable of probing depths of 3 – 5 nm. It has been employed for decades and has provided some of the most fundamental information about the elemental composition, chemical state and electronic structure of the surface [59, 60].
As shown in Fig. 2.2, XPS is performed by exciting a sample surface with mono-energetic x-ray photons (usually Mg or Al Kα or synchrotron radiation). The process is based on the
photoelectric effect, which causes both core and valence level electrons to be emitted from the sample surface, when the energy of the x-ray photons is larger than their binding energy.
Einstein equation gives the relation between kinetic and binding energies: (2.1)
where Eb is the binding energy of the core electron, һυ is the energy of the exciting x-ray photon;
Ek is the kinetic energy of the electron measured by the analyzer; and Φ is the work function (the
amount of energy the particle loses in overcoming the surface potential of the sample) [61]. The binding energy of the core electron depends upon several factors, such as the element, the orbital from which the electron is ejected, and the chemical environment of the atom from which the electron is emitted. Hence, the binding energy and intensity of a photoelectron peak permit identification and quantification of all surface elements: the peak intensities measure the quantity of a material at the surface, while the peak positions provide the elemental and chemical composition [60].
Figure 2.2: Schematic of XPS principle.
The distance that an electron can traverse in solid depends on the both material and electron kinetic energies. The surface sensitivity of the XPS is based analyzing those ejected electrons at a
particular energy (defined as the pass energy in the instrument) that have not lost energy through inelastic electron-electron collisions. The inelastic mean free path (IMFP, λ) is the depth at which ~ 37 % of the electrons are attenuated. The IMFP values are found in the “universal curve”, which gives λ for various materials and kinetic energies; the depth probed is taken as 3x the value of λ, the depth at which ~ 95 % of the electrons are attenuated. More details regarding the “universal curve” are given elsewhere [61].
XPS analysis is performed using two types of scans; a lower resolution survey scan and high resolution scan. The former displays all detectable elements at the surface and measures their amounts; the latter, which takes much longer, reveals chemical state and chemical environmental differences. The high resolution scan also separates differences between surface and bulk electronic state contributions that are statistically significant, as found for some transition metals [62]. XPS spectra plot intensity vs. binding energy. Figure 2.3 illustrates a typical XPS spectrum obtained in a survey scan. In that spectrum, there are photoemissions from core and valence levels, as well as x-ray excited Auger emissions. High resolution scans can be carried out on each peak from either core or valence levels.
In XPS spectra, orbitals having angular momenta (i.e., p, d, f) appear as doublets at different binding energies. This is known as spin-orbit splitting; LS coupling in light atoms (generally with atomic number less than 30) and jj coupling in heavier atoms (in our case) [63, 64], as shown in Fig. 2.3 (Ru3p1/2 and Ru3p3/2). For any electron in an orbital having orbital angular momentum, coupling between magnetic fields of spin (s) (or total spin angular momentum (S)) and angular momentum (l) (or total orbital angular momentum (L)) occurs. Both LS and jj coupling could be used in XPS doublets, although the latter is easier to use. Therefore, the XPS peaks are labeled using the nomenclature nlj where n is the principle quantum number, l is, as mentioned above, the
orbital corresponding to the angular momentum quantum number and j = l + s (where s is ± 1/2 ). The peaks related to each orbital with different j values also have specific area ratios based on the respective degeneracy of each spin state. Therefore, the relative intensities of the doublet peaks are determined by (2j1+1)/(2j2+1), where j1 and j2 are the j values for each component of the
doublet [63]. The area ratios and j values of spin-orbit doublets are presented in Table 2.1. These ratios must be considered when doing curve-fitting of the p, d and f core level spectra. In order to quantify the intensity of XPS peaks, the proper modeling of the background signal is required. Among various types of background subtraction, the Shirley technique [65] was employed in this thesis, due to its ease of use. In this background subtraction method, the background intensity at any given binding energy is proportional to the intensity of the total peak area above the background in the lower binding energy peak range [66]. In some cases, because of some inherent uncertainties in the Shirley background subtraction of the spectra, the ratio between the doublets might not follow the exact area ratios in Table 2.1. These small changes in the ratio do not affect other peak component parameters, such as binding energies and atomic component fractions, although the changes lead to better curve-fitting.
Table 2.1: Spin-orbit splitting parameters.
Subshell j values Area ratio
s 1/2 n/a
p 1/2, 3/2 1:2
d 3/2, 5/2 2:3
Different types of bonds of an element appear at different binding energies. In other words, the binding energy of a core electron is sensitive to the chemical environment of the emitting atom. This effect is called a “chemical shift”. For instance, a carbon of a carbonyl group will have slightly different position and intensity than that of a carbon in a carbide group, in the C1s XPS spectrum. Chemical shift information is a very powerful tool for identifying the functional group, chemical environment or oxidation state [62].
Another notable benefit of XPS is its ability to quantify surface atomic concentrations, with good precision. In this technique, the number of ejected electrons is proportional to the number of atoms at the surface. In fact, by using the peak intensity and the relative sensitivity factor, the relative atomic fraction of each element can be determined [67].
Figure 2.4 illustrates the components of our XPS. The specifications of all the instruments used in this thesis are explained in the experimental sections of chapter 3 and 4. The main components of our XPS are the X-ray source, the electron collection lens, the electron energy analyzer, the electron detector, the readout and data processing.
Our XPS system enabled us to perform in-situ synthesis and characterization of the metal and alloy NPs. In this thesis, “in-situ” refers to the synthesis and characterization of the samples without exposure to air. The synthesis of NPs was accomplished by an e-beam evaporator, and annealing steps were carried out using the sample heating stage present in the preparation chamber. The analyses were done using an X-ray source located in the analysis chamber. The entire experiments and analyses were performed under UHV conditions (˂ 3 × 10⁻⁸ torr).
Figure 2.4: A photo of our XPS (VG ESCALAB 3 MARK II).
In our XPS data analysis, we have employed the symmetric peak XPS component analysis method, developed in our laboratory, to identify the surface, volume, electronic and contaminant features of several First, Second and Third Transition Series metal NPs [32, 68-72], showing its validity in the characterization of metal NP surface chemistry and structure.
Historically, metal core level XPS spectra were found to exhibit asymmetries to the higher binding energy side. Based on the Doniach and Šunjić [73] theory, proposed to fit the spectrum, this asymmetry had come to be considered a natural occurrence, attributable tothe promotion of electrons near the Fermi level to empty states just above it; however, this proposal does not explain asymmetries found in non-metals, such as HOPG and carbon nanotubes (CNTs) [68, 69, 74], where the promotion of electrons envisaged by Doniach and Šunjić does not occur.
Our symmetric peak component XPS analysis method [68, 69, 74] posits that the apparently asymmetric XPS peaks are, in fact, symmetrical, and that the asymmetry is due to smaller peak components immediately adjacent to the zerovalent metal peak component, on the higher energy side, where peaks due to compounds of the metal are found. Indeed, in some cases, the asymmetry has been found to change with time, exposure to oxygen and irradiation [68, 69], which is not in accord with the Doniach and Šunjić model [73]. For instance, a freshly prepared
film of Co, in a previous study by our group [75], showed a totally symmetrical 2p doublet; after remaining in the XPS vacuum chamber for several hours, both doublet components became significantly more asymmetrical, with new peaks appearing in the C1s and O1s spectra. This indicates that the inevitable contamination could be a source of metal peak asymmetry. In other words, the experimentally obtained asymmetric XPS peaks are composed of several overlapping minor symmetric peaks rather than a single asymmetric peak [68].
Thus, our use of additional symmetric peaks to account for the asymmetry reveals the presence of component peaks that are otherwise hidden when using asymmetric components; as expected, these component peaks have energies independent of experimental conditions. As explained in the review by Sacher [68], three principles must be employed when applying the symmetric peak component analysis to asymmetric spectra: i) the minor peaks, adjacent to the major peak, whose presence causes the asymmetry, must have a previously identified physical or chemical basis, ii) ligand field effects that occur in some metals, such as Co, must be considered, iii) a chemical bond between two different elements must be quantitatively observed in the XPS spectra of both elements. Again, as noted in the review by Sacher [68] on the subject, these previously hidden component peaks give information on NP surface contamination, oxidation, electronic configuration, and interfacial bonding. In every case [32, 68-72], this information has been confirmed from other sources. Consequently, symmetric component peak analysis is employed in this thesis, and permits us to indicate the electronic structures of Ru and PtRu NPs used in catalysis, their extents of adhesion to the substrates normally used, as well as the contaminants that are found on their surfaces. Symmetric peak component analysis is also capable of distinguishing differences in the chemical and physical environment of an element. Hence, the information previously obtained on pure Pt [1] and our present results on Ru were used to determine the interactions between them in the alloys, and helped distinguish between pure metal and alloy component peaks.
In our Ru study (Chapter 3), the errors in peak positions are estimated to be ≤ ±0.4 eV, with reproducibility ≤ ±0.2 eV and, in area ratios, ≤ ±10 %, with reproducibility ≤ ±5 %. In our PtRu study (Chapter 4), the errors in peak positions are estimated to be ≤ ±0.3 eV, with reproducibility ≤ ±0.2 eV and, in area ratios, ≤ ±3%, with reproducibility ≤ ±2%. These values were obtained through numerous repetitions of each of the spectra obtained.
2.2.2 Time-of-Flight Secondary Ion Mass Spectrometry (TOF-SIMS)
Time-of-flight secondary ion mass spectrometry (TOF-SIMS) is a very sensitive surface analytical technique, with an average probe depth of 1-2 nm, high mass resolution, and high sensitivity (~1ppm). This technique provides detailed elemental and molecular compositions at the surface of solid materials, for both insulating and conducting samples. It also distinguishes the different isotopes of the same element [76].
TOF-SIMS is accomplished by focusing a pulsed beam of energetic primary ions onto a sample surface, producing secondary ions and ion clusters, to be emitted from the very outermost surface of the sample. The primary ions are typically Ga+, Cs+, Bi+, and O-, with energies of 1-25 keV. After the surface is bombarded by the primary ions, the secondary ions are electrostatically accelerated into a field-free drift region, and a time-of-flight analyzer is employed to measure the mass of the emitted positive and negative ions and clusters [76, 77].
There are three operational modes in TOF-SIMS: (1) surface spectroscopy, that can provide mass spectral information, (2) surface imaging in the XY dimension across a sample, which provides spatial distributions of different species and (3) depth profiling, which gives information in the Z direction (into the sample) for in-depth elemental and molecular analysis [78].
TOF-SIMS instruments typically consist of an ultrahigh vacuum system, a particle gun, a flight path (which is either circular or linear), using electrostatic analyzers or reflecting mirrors in order to direct the particle beam, the mass detector system, and a computer and software for system control and analysis. Figure 2.5 illustrates the schematic of a TOF-SIMS instrument [78].