HAL Id: tel-01343673
https://tel.archives-ouvertes.fr/tel-01343673
Submitted on 9 Jul 2016HAL is a multi-disciplinary open access archive for the deposit and dissemination of sci-entific research documents, whether they are pub-lished or not. The documents may come from teaching and research institutions in France or abroad, or from public or private research centers.
L’archive ouverte pluridisciplinaire HAL, est destinée au dépôt et à la diffusion de documents scientifiques de niveau recherche, publiés ou non, émanant des établissements d’enseignement et de recherche français ou étrangers, des laboratoires publics ou privés.
Neuromodulation in the Olfactory Bulb
Richard Smith
To cite this version:
Richard Smith. Neuromodulation in the Olfactory Bulb. Neurons and Cognition [q-bio.NC]. Université Pierre et Marie Curie - Paris VI; University of Maryland, 2015. English. �NNT : 2015PA066194�. �tel-01343673�
Université Pierre et Marie Curie
Université de cotutelle
ED3C
UMR 8118 Laboratorie de Physiologie Cerebrale
Neuromodulation in the Olfactory Bulb
Richard SMITH
Cerveau, Cognition, Comportement
Dirigée par [Alain MARTY, Ricardo ARANEDA]
Présentée et soutenue publiquement le [8 Julliet 2015] Devant un jury composé de :LEE, Hey-Kyoung, Professor, Johns Hopkins Université USA, Rapporteur STOPFER, Mark, Investigator, National Institutes of Health USA, Rapporteur MARTY Alain, Research Directeur, Paris V, Directeur
ARANEDA Ricardo, Professor, Université of Maryland, Directeur VINCENT Pierre, Research Directeur, Paris VI, Member
ROESCH Matthew, Professor, Université of Maryland, Member BUTTS Daniel, Professor, Université of Maryland, Member
Résumé en Français
La neuromodulation de circuits olfactifs par l'acétylcholine (ACh) joue un rôle important dans la discrimination et l'apprentissage d’odeur. Le traitement précoce des signaux chimiosensoriels se produit dans deux régions
fonctionnellement et anatomiquement distinctes, les principaux et accessoires bulbes olfactifs (MOB et AOB), qui reçoivent entrée cholinergique significative du cerveau antérieur basal. Ici, nous explorons la régulation des circuits de l’AOB et la MOB par ACh, et comment cette modulation influence le
comportement à médiation olfactifs. De manière surprenante, malgré la présence d'un circuit conservé, l'activation des récepteurs muscariniques de l'ACh révèle des différences marquées dans la modulation cholinergique des neurones de sortie: l’excitation de l’AOB et l'inhibition de la MOB. Les cellules granulaires (GCs), le neurone intrinsèque le plus abondant dans l'OB,
présentaient également une réponse muscarinique complexe. Alors que les GCs de l’AOB ont été excitées, les GCs de la MOB présentaient une action muscarinique double, une hyperpolarisation et une augmentation de
l'excitabilité non couvert par la dépolarisation cellulaire. Par ailleurs, l’ACh a eu un effet différent sur la relation d'entrée / sortie des MCs dans l’AOB et la MOB, montrant un effet net sur le gain en les MCs de la MOB, mais pas dans l'AOB. Fait intéressant, malgré les différences frappantes dans les actions neuromodulateurs sur les neurones de sortie, l'inhibition de la libération d'ACh chemogenetic produit des perturbations similaires dans les comportements olfactifs médiés par ces deux régions. La diminution de l’ACh dans l'OB a perturbé la discrimination naturelle des odeurs liées moléculairement et
l'enquête naturelle des odeurs associées à des comportements sociaux. Ainsi, la neuromodulation distincte par l’ACh dans ces circuits pourrait déclencher des solutions différentes générales pour le traitement des odeurs et les médiateurs chimiques, ainsi que les comportements olfactifs diverses qu'ils déclenchent.
Summary
Neuromodulation of olfactory circuits by acetylcholine (ACh) plays an important role in odor discrimination and learning. Early processing of chemosensory signals occurs in two functionally and anatomically distinct regions, the main and accessory olfactory bulbs (MOB and AOB), which receive significant cholinergic input from the basal forebrain. Here we explore the regulation of AOB and MOB circuits by ACh, and how this modulation influences olfactory mediated behaviors. Surprisingly, despite the presence of a conserved circuit, activation of muscarinic ACh receptors revealed marked differences in cholinergic modulation of output neurons: excitation in the AOB and inhibition in the MOB. Granule cells (GCs), the most abundant intrinsic neuron in the OB, also exhibited a complex muscarinic response. While GCs in the AOB were excited, MOB GCs exhibited a dual muscarinic action, a hyperpolarization and an increase in excitability uncovered by cell
depolarization. Furthermore, ACh had a different effect on the input/output relationship of MCs in the AOB and MOB, showing a net effect on gain in MCs of the MOB, but not in the AOB. Interestingly, despite the striking differences in neuromodulatory actions on output neurons, chemogenetic inhibition of ACh release produced similar perturbations in olfactory behaviors mediated by these two regions. Decreasing ACh in the OB disrupted the natural discrimination of molecularly related odors and the natural investigation of odors associated with social behaviors. Thus, the distinct neuromodulation by ACh in these circuits could underlie different solutions to the processing of general odors and semiochemicals, and the diverse olfactory behaviors they trigger.
Preface
Organization of sensory processing circuits in the brain is complex and heterogeneous, with each sensory modality comprising of unique cell types and synaptic organization, as well as patterns of short and long rang brain connectivity. The goal of sensory physiology research is simple, identify and investigate components of sensory circuits and determine their contributions to transforming sensory signals into meaningful information. In the past decade, modern genetic approaches have accelerated the precise dissection of sensory neural circuits to test and validate components roles in processing. The present work seeks to evaluate the role of top down neuromodulatory control of the olfactory sensory processing circuit: the olfactory bulb.
TABLE OF CONTENTS PAGE ABSTRACT FRENCH ... i Abstract ENGLISH ... ii ACKNOWLEDGMENTS ... iii PREFACE ... vi
LIST OF FIGURES ... vii
LIST OF ABBREVIATIONS CHAPTERS CHAPTER 1 – Introduction ... 1
1.1 Olfactory System Overview 1.2 Periphery: Olfactory Sensory Neurons and Chemoreception 1.3 The Olfactory Bulb, AOB and MOB Circuits 1.4 Output of the Olfactory Bulb 1.5 Afferent input to the Olfactory bulb 1.6 Cholinergic System and the Olfactory Bulb 1.7 Olfactory System and Behavior CHAPTER 2 – Methods ... 28
2.1 Animals 2.2 Slice preparation 2.3 Data acquisition and analysis 2.4 Confocal imaging and immunohistochemistry 2.5 Stereotaxic viral injections 2.6 Behavioral tests for natural odor discrimination 2.7 Behavioral tests for natural investigation of male and female odors 2.8 Behavioral test for novel object recognition 2.9 Solutions and pharmacological agents CHAPTER 3 – Cholinergic modulation of neuronal excitability in the accessory olfactory bulb ... 40 3.1 Intro
3.2 Results
3.2.1 Muscarinic acetylcholine receptor (mAChR) agonists excite granule cells.
3.2.2 Muscarinic but not nicotinic acetylcholine receptor activation directly excites granule cells.
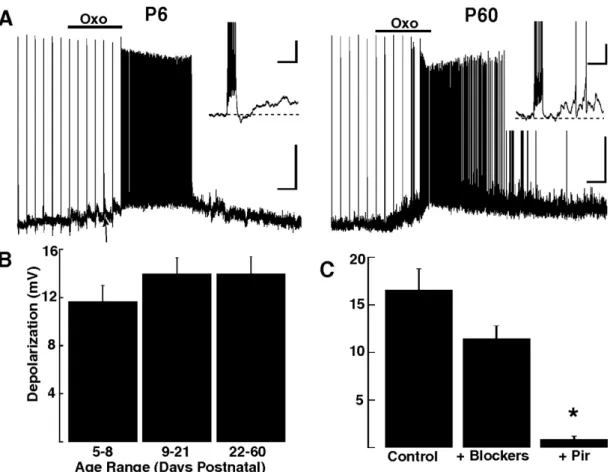
3.2.3 The sADP and depolarization is dependent on extracellular Na. 3.2.4 Excitatory muscarinic responses in GCs are present from early postnatal days.
3.2.5 M1-mAChR activation produces an excitatory response in mitral and tufted cells
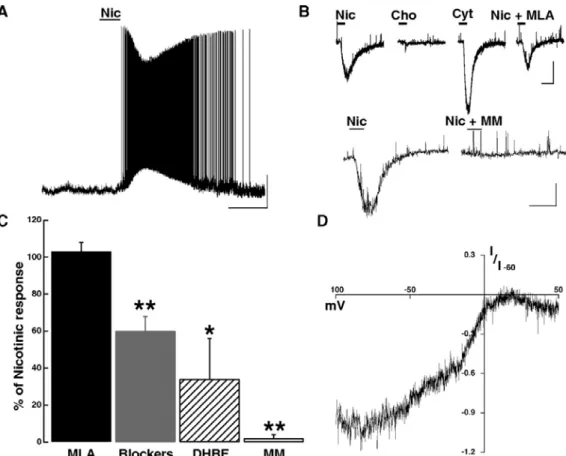
3.2.6 Nicotinic AChR activation excites MCs
3.2.7 Submaximal activation of nicotinic and muscarinic receptors decreases the output from MCs
CHAPTER 4 – Differential Muscarinic Modulation in the Olfactory Bulb ... 70 4.1 Intro
4.2 Results
4.2.1 Muscarinic receptor activation produces opposite effects on mitral cells of the AOB and MOB
4.2.2 Activation of M2 muscarinic receptors hyperpolarizes MOB GCs 4.2.3 Optogenetic activation of HDB cholinergic projections reveals opposing
actions of acetylcholine on output neurons of the AOB and MOB
4.2.4 Cholinergic afferent fiber density is differentially distributed in the AOB and MOB
4.2.5 In vivo modification of HDB cholinergic neurons activity affects natural odor discrimination
4.2.6 Chemogenetic silencing of cholinergic neurons disrupts investigation of social odors
4.3 Discussion
REFERENCES ... 103 APPENDICES
Appendix A – Properties of GABAA receptors in cerebellar molecular layer
interneurons: Studies with GABA uncaging ... 121 A.1 Diagram of the neuronal circuitry in the cerebellar cortex
A.2 In vitro brain slice preparation of the Cerebellum A.3 Design and Calibration of the GABA Uncaging Setup
A.4 Properties of GABA evoked responses (eIPSC) with DPNI-GABA photolysis
A.5 Age dependent immunohistochemical staining of pre- and postsynaptic GABAergic markers
A.6 eIPSCs on MLIs from young and mature ages show differential IPSC kinetics and sensitivity to zolpidem
A.7 Electrophysiological and immunohistochemical analysis of MLIs at young and mature ages
LIST OF FIGURES
CHAPTER 1
FIG 1.1 Peripheral to central synaptic connectivity in the olfactory system FIG 1.2 Synaptic organization of the Main olfactory and Accessory
olfactory bulb
FIG 1.3 Schematic of MOB and AOB MTC axonal targets within central
Structure CHAPTER 2
FIG 2.1- Chemogenetic control of HDB cholinergic neurons (ChAT) in vivo. FIG 2.2- Odor discrimination paradigm and test odors
CHAPTER 3
FIG 3.1 Muscarinic acetylcholine receptor (mAChR) agonists excite
granule cells.
FIG 3.2 Muscarinic but not nicotinic acetylcholine receptor activation
directly excites granule cells.
FIG 3.3 The sADP and depolarization is dependent on extracellular Na. FIG 3.4 Excitatory muscarinic responses in GCs are present from early
postnatal days.
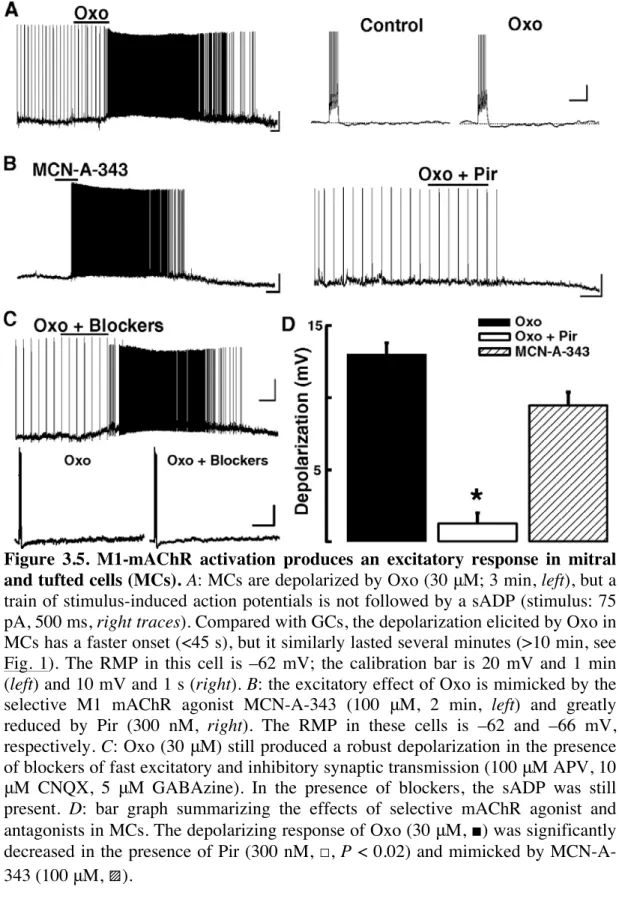
FIG 3.5 M1-mAChR activation produces an excitatory response in mitral
and tufted cells
FIG 3.6 Nicotinic AChR activation excites MCs
FIG 3.7 Submaximal activation of nicotinic and muscarinic receptors
decreases the output from MCs CHAPTER 4
FIG 4.1 Muscarinic receptor activation produces opposite effects on mitral
cells of the AOB and MOB
FIG 4.2 Activation of M2 muscarinic receptors hyperpolarizes MOB GCs FIG 4.3 Optogenetic activation of HDB cholinergic projections reveals
opposing actions of acetylcholine on output neurons of the AOB and MOB
FIG 4.4 Cholinergic afferent fiber density is differentially distributed in the
AOB and MOB
FIG 4.5 In vivo modification of HDB cholinergic neurons activity affects
natural odor discrimination
FIG 4.6 Chemogenetic silencing of cholinergic neurons disrupts
investigation of social odors AMENDMENT A
FIG A.1 Diagram of the neuronal circuitry in the cerebellar cortex FIG A.2 In vitro brain slice preparation of the Cerebellum
FIG A.3 Design and Calibration of the GABA Uncaging Setup
FIG A.4 Properties of GABA evoked responses (eIPSC) with DPNI-GABA
photolysis
FIG A.5 Age dependent immunohistochemical staining of pre- and
postsynaptic GABAergic markers
FIG A.6 eIPSCs on MLIs from young and mature ages show differential
IPSC kinetics and sensitivity to zolpidem
FIG A.7 Electrophysiological and immunohistochemical analysis of MLIs at
LIST OF ABBREVIATIONS
ACh acetylcholine
AChR acetylcholine receptor ARs adrenergic receptors ACA anterior cortical amygdala AON anterior olfactory nucleus
AMPA 2-amino-3-(3-hydroxy-5-methyl-isoxazol-4-yl) propanoic acid AOB Accessory olfactory bulb
AOS Accessory olfactory system AON accessory olfactory nucleus
APV (2R)-amino-5-phosphonopentanoate C6 ethyl hexanoate
C7 ethyl heptanoate C8 ethyl octanoate
ChAT choline acetyl transferase ChR channelrhodopsin
CNQX 6-cyano-7-nitroquinoxaline-2 CNO clozapine-N-oxide
DDI dendrodendritic inhibition DDS dendrodendritic synapse d.p.i. days post injection
DREADD Designed Receptors Exclusively Activated by a Designed Drug dSAC deep short axon cell
dorsal raphe nucleus (DRN) E/I excitation/inhibition
eIPSC evoked inhibitory postsynaptic current EPL external plexiform layer
EPSC excitatory postsynaptic current GABA gamma-aminobutyric acid GC granule cell
GCL granule cell layer
GFP green fluorescent protein GL glomerular layer
GLU glutamate
HDB horizontal limb of the diagonal band of Brocca h.p.i. hours post injection
IPL internal plexiform layer
IPSC inhibitory postsynaptic current
ICAN Calcium activated non-selective cationic current
Light optogenetic stimulation LOT lateral olfactory tract LC locus coeruleus
LTP Long Term Potentiation LEC lateral entorhinal cortex MTC mitral cell
MCL mitral cell layer
MCPO magnocellular preoptic area MeA medial amygdala
mGLUR metabotropic glutamatergic receptor mIPSC miniature inhibitory postsynaptic current MHC Major histocompatibility complex
MOS Main olfactory system MOT Medial olfactory tract MUP Major urinary protein MOB main olfactory bulb M/T mitral/tufted
NA noradrenaline
NMDA N-methyl-D-aspartate
NLO nucleus of the lateral olfactory tract OB olfactory bulb
olfactory nerve layer (ONL) OSN olfactory sensory neurons ORs Olfactory receptor
OT olfactory tubercle
pAOB posterior accessory olfactory bulb PFA paraformaldehyde
PCA posterolateral cortical amygdala PG periglomerular cell
PC piriform cortex
pPC posterior Periform cortex PN days post-natal
RMS rostral migratory stream
sIPSC spontaneous inhibitory postsynaptic current 5HT Serotonin
SVZ subventricular zone ETC external tufted cell TMT trimethlytoluine VNO Vomeronasal organ VNL, Vomeronasal Nerve Layer VNS Vomeronasal system
VR Vomeronasal receptor protein w.p.i. weeks post injection
Olfactory System Overview
The detection and processing of environmental and social chemical stimuli by the olfactory system (OS) is essential for the survival of most mammalian species. The OS consists of two parallel pathways that include the
Vomeronasal system (VNS) and the main olfactory system (MOS). Together, they analyze the broad array of chemosensory signals that range from small volatiles of simple chemical structure, to complex proteins. These odor signals in turn trigger a host of survival behaviors, including food consumption, aggression, mating, maternal functions, detection of
conspecifics, and predator detection. Odors bind to chemosensory receptors located on olfactory sensory neurons (OSNs), specialized cells found in peripheral structures, which transmit odor signals to the brain. The olfactory bulb (OB) is the first brain region where processing of odor signals occurs before odor information is relied to cortical and subcortical areas. The OB consists of two anatomically distinct regions, the main olfactory bulb (MOB), which is part of the MOS and detects mostly volatile odors, and the accessory olfactory bulb (AOB), which is part of the VNS. In addition to small molecules, the VNS relies information about non-volatiles signals including proteins, collectively known as pheromones, which trigger behaviors such as mating and aggression. Unlike other sensory modalities, projections from the OB reach cortical layers directly, bypassing the thalamus. However, similar to the thalamus, the OB neural circuit is highly regulated by top down
neuromodulatory systems and cortical inputs. Among these regulatory inputs, state dependent activation of two neuromodulatory systems, the cholinergic and noradrenergic systems, play an important role in mechanisms underlying
provides an attractive model to study neuromodulation of a sensory system at a cellular, circuit, and behavioral level.
Olfactory Sensory Neurons and Chemoreception
Chemical odorants enter the nostrils and bind one of five families of
chemosensory G-protein coupled receptors (GPCRs) (Buck and Axel, 1991; Kaupp, 2010).Olfactory receptors (ORs) consist of the largest family of GPCRs (~1100 genes depending on species), generating diverse
physiochemical binding properties to detect millions of volatile odors in the olfactory epithelium (OE) (Zhang and Firestein, 2002). Two vomeronasal GPCRs types exist (V1R and V2R, VRs herein), detecting odor molecules within the liquid milieu in the vomeronasal organ (VNO), located ventral to the nasal cavity entrance in most mammals(See Fig 1.1, (Tirindelli et al., 2009). Generally, OSNs follow the “one neuron, one receptor rule”, whereby OSNs express a single type of OR (or VR) on their cilia and these receptors show a specific odor ligand binding profile (Buck and Axel, 1991; Kaupp, 2010). ORs have different chemical receptive ranges; some ORs are classified as
“generalists” and respond to many odors, while other ORs “specialists” display a narrow odor range (Araneda et al., 2000, 2004). Ultimately, the detection of odors occurs through a combinatorial strategy, whereby activation of several ORs types combine to generate olfactory odor
representations (Mori and Sakano, 2011). MOS ORs (~1,000) are scattered across the OE in a highly overlapping manner, however a very course spatial organization may exist (Ressler et al., 1993; Miyamichi et al., 2005; Imai et al., 2010). Conversely, V1R and V2Rs are spatially separated in the dorsal and ventral regions of the VNO (Jia and Halpern, 1996). Odor binding to ORs
and VRs produces a GPCR-led activation of OSNs for electrical amplification and robust transmission of sensory signals via axonal segments to the OB (Shepherd and Greer, 1998). OSN generated electrical signals arrive to the olfactory nerve layer (ONL) where OSN axon terminals form glutamatergic synapses with projection neurons, Mitral and Tufted cells (MTC herein) in the
glomerulus, a glial ensheathed bundle of synapses located on the superficial surface of the OB (Shepherd and Greer, 1998). Generally, in the mouse MOS, OSNs expressing the same OR converge within two of approx ~1,800 OB glomeruli (Fig 1.1A) (Royet et al., 1988; Mombaerts et al., 1996). In the VNS, OSNs expressing the same VRs converge to 10-30 small glomeruli,
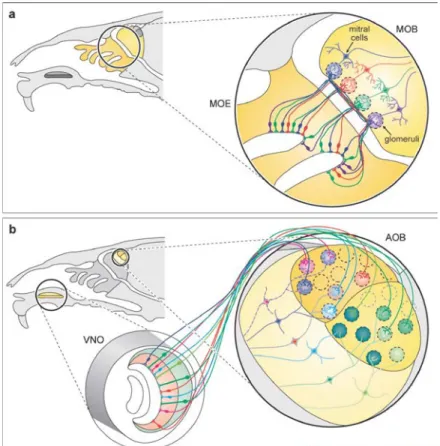
Fig 1.1 Synaptic connectivity in the olfactory bulb. Sensory projections from the Vomeronasal organ (VNO) and olfactory epithelium (MOE) into the accessory and main olfactory bulb (AOB and MOB, respectively). A. MOB mitral cells project a single apical dendrite to a glomerulus that is, in turn, innervated by sensory neurons expressing the same OR (color coded in this diagram). B. VRs in the sensory epithelium of the VNO are segregated into apical and basal zones, which project to multiple glomeruli along an antero-posterior axis. AOB mitral cells project several apical dendrites to multiple glomeruli.
giving the VNS a lower ratio of OSNs to glomeruli (Fig 1.1B) (Rodriguez et al., 1999). These glomerular structures provide the first location where the initial processing of odors signals occur in the OB (Shao et al., 2009; Gire et al., 2012).
The Olfactory Bulb, AOB and MOB Circuits
The OB is the initial site of odor processing, generating the first odor
representations in the olfactory pathway (Mori et al., 1999; Takahashi et al., 2004). In the OB, the most salient physiological mechanism in olfactory
processing is the precisely regulated excitability of the output neurons (MTCs) by the more numerous inhibitory interneurons (Shepherd and Greer, 1998). The most characterized among these inhibitory neurorns are the granule cells (GCs), the largest in number, and the periglomerular cells (PGCs) (Fig 1.2). These interneurons produce a robust inhibition of MTCs through lateral, feedforward, and recurrent inhibition at dendrodendritic synapses (DDS, Fig. 1.2) (Schoppa and Urban, 2003; Arevian et al., 2008). DDS have been extensively studied in the MOB, and are thought to function in a similar fashion in the AOB (Rall and Shepherd, 1968; Price and Powell, 1970a; Shpak et al., 2014). Briefly, the DDS reciprocal synapse consist of excitatory glutamatergic input from MTCs to GCs and PGCs, which induces the release of γ-aminobutyric acid (GABA) from the dendrites of GCs (or PGCs), in turn, inhibiting the MTC (See Fig 1.2) (Isaacson and Strowbridge, 1998; Schoppa and Urban, 2003). Through DDS inhibition, these interneurons effectively shape MTC spatial odor patterns and continue evolve during the odor response (Spors and Grinvald, 2002; Niessing and Friedrich, 2010). During odor investigation, MTCs are spontaneously active and typically show spike
locking with respiration cycle via OSN activation (Rinberg et al., 2006a; Cury and Uchida, 2010). Several layers of MTC processing exists, including latency of response and spike temporal phase modifications (Margrie and Schaefer, 2003; Dhawale et al., 2010; Smear et al., 2011), decreases in spiking (Rinberg et al., 2006a; Davison and Katz, 2007), changes in relative timing of MTCs spikes and temporal spiking patterns (Cury and Uchida, 2010; Haddad et al., 2013) and modifications to MC synchronization (Kay and
Stopfer, 2006). These provide a powerful mechanism for the transformation of olfactory signals within the OB and major targets for top-down modulation. In addition, MTC spatiotemporal patterns can be modulated by learning, as modifications of odor meaning or providing an associative reward in the presence of an odor can produce changes in MTC firing patterns (Freeman and Schneider, 1982; Kay and Laurent, 1999; Doucette et al., 2011). Additionally, the glomerular synaptic network is important for processing incoming odor signals and rich GABAergic architecture primarily contributes to, among others, gain control and contrast enhancement of the incoming sensory signals (Olsen and Wilson, 2008; Shao et al., 2009; Gire et al., 2012; Carey et al., 2015). It is notable that DDS inhibition onto MTCs occurs at two different sites, from PGCs at the level of the input, while from GCs occurs at lateral dendrites mostly. These synaptic interactions have been shown to be the targets of several afferent neuromodulatory systems (Schoppa and Urban, 2003; Ennis et al., 2007).
Last, the OB’s anatomical isolation provides a unique opportunity to study sensory transformations with minimal interference comparably to the dense inter-connectivity between the thalamus and cortex of other sensory systems.
Moreover, the OBs multilayered structure with feedback loops and centrifugal input lend support to the role of the OBs as more than a relay synapse, but an active participant in the precisely timed activity of neurons in modifying odor transformations.
Output of the Olfactory Bulb
The MOS and VNS both process chemosensory cues, which are represented in different brain areas and elicit distinct behavioral effects. Long range MTCs axonal projections synapse within several cortical and subcortical target structures, including a prominent connection by the VNS MTCs within
Figure 1.2 Synaptic organization of the main olfactory and accessory olfactory bulb Left. OSNs in the main olfactory system expressing a single odorant receptor project to the same glomerulus in the OB and shown are two representative populations of OSNs (blue, green). MCs of the MOB have a single apical dendrite projecting to a single glomerulus and several lateral dendrites that contact GC dendrites. Right, in the VNS, OSNs expressing the same VRs project to multiple small glomeruli (various colors). MCs of the AOB (blue, green) have several apical dendrites projecting to multiple glomeruli. In both regions, PGCs and GCs inhibit MTC activity through dendrodendritic synapses (DDS). Centre circle, schematic diagram of a MTC-GC DDS in the MOB. Glutamate released from MTCs acts on glutamate receptors to induce recurrent and lateral release of GABA from GCs. OSN, Olfactory Sensory Neurons; ONL, Olfactory Nerve
Layer; VNL, Vomeronasal Nerve Layer; GL, Glomerular Layer; MCL, Mitral Cell Layer; GCL, Granule Cell Layer; Lateral Olfactory Tract (LOT)
limbic structures. MOB MTCs primarily target the olfactory cortex (OC) and several olfactory associated areas, which include the anterior olfactory
nucleus (AON), the piriform cortex (PC), the tenia tecta, the olfactory tubercle (OT), the cortical amygdala, and the entorhinal cortex (EC) (Haberly, 2001; Mori and Sakano, 2011). Neuroanatomical and physiological studies reveal that MOB MTCs axons synapse broadly across the PC, with no obvious spatial orientation, including those MTCs receiving input from the same glomerulus (Ghosh et al., 2011; Sosulski et al., 2011; Igarashi et al., 2012). The anterior PC is thought to function in pattern recognition, whereby
coincident MTC inputs onto pyramidal neurons provides long term
potentiation (LTP) mechanisms for associating odor features that represent an odor (Stettler and Axel, 2009; Davison and Ehlers, 2011). The connectivity in the posterior PC (pPC) suggests it functions as a higher-order association cortex, performing multimodal associations (Haberly, 1985). The lack of an organized spatial odor map in PC, as determined by anatomical methods, is further confounded by the absence of “spike timing” based coding or odor-specific spatial patterns of activation, as those observed in the OB. These observations suggest a robust transformation of information that occurs from the OB to PC, and that odor signals may change from “timing” based to “firing rate” based representations in the PC (Uchida et al., 2000; Illig and Haberly, 2003). More recent studies, following two-point activation across specific MTC glomeruli using optogenetics, have suggested that PC can read out gross relative timing differences at PC pyramidal cells (Haddad et al., 2013). Within the VNS, MTCs primarily target subcortical areas of the limbic system, including the medial amygdala (MA), posteromedial cortical amygdala (PCA),
accessory olfactory nucleus (AON), and the bed nucleus of the stria terminalis (BN) (Scalia and Winans, 1975; von Campenhausen and Mori, 2000). While V1Rs and V2Rs show anterior-posterior anatomical separation in their AOB MTC targeting, MTC axonal projections do not reflect this spatial patterning within amygdaloid target structures (Fig 1.3) (Salazar and
Brennan, 2001; Mohedano-Moriano et al., 2007, 2008). Interestingly, a crude spatial organization may exist in the hypothalamus where MTC activation of neurohormonal responses can modulate sexual behaviors, maternal care, and fear responses (Brennan and Peele, 2003).
Crosstalk between AOB and MOB MTC upstream targets does exist, including AOB overlap within classically described MOB target areas, including the nucleus of the lateral olfactory tract (NLO), anterior cortical amygdaloid nucleus. MOB projections also overlap with AOB target
structures, such as ventral anterior amygdala (VAa), the bed nucleus of the accessory olfactory tract (BST), and the anteroventral medial amygdaloid nucleus (Licht and Meredith, 1987; Pro-Sistiaga et al., 2007). The medial amygdala (MeA) also integrates cues from both the VNS and MOS and plays a vital role in social recognition (Brennan and Keverne, 2015). While it is clear that concurrent transmission of sensory signals to upstream olfactory
associated areas occurs, it remains to be shown how combinatorial signals generate olfactory representations.
! Figure 1.3 Schematic of MOB and AOB MTC axonal projections in the brain. Horizontal brain section stained with Westeria Flurobundia (WFA) marker. Arrows originating in the AOB and MOB send projection arrows to target cortical and subcortical structure. For example, MTCs of the MOB project to cortical areas mostly AON, anterior olfactory nucleus; OT, olfactory tubercle; PC, piriform cortex; NLO, nucleus of the lateral olfactory tract; ACo, anterior cortical amygdala; PMCo, posterolateral cortical amygdala; MeA, medial amygdala; LEC, lateral entorhinal cortex; PCa, posteromedial cortical amygdala; BST, bed nucleus of the stria terminalis (Mori and Sakano, 2011) !
Afferent input to the Olfactory bulb
Unlike the other sensory modalities, the OS operates without a thalamic relay and thus an important area for top down processing. Afferent input arising from several cortical and subcortical structures, including MTC recipient areas, are a critical component of olfactory processing. Analysis of PC -> OB axonal targets reveals a disseminated projection that lacks a topographic organization, paralleling the lack of organization in OB->PC projections (Boyd et al., 2015). Cortical pyramidal neurons send glutamatergic axons to the OB, primarily synapsing onto GCs, and activate GABA release to inhibit MTC odor responses (von BAUMGARTEN et al., 1962; Price and Powell, 1970b; Mori and Takagi, 1978; Halasz and Shepherd, 1983). These cortical glutamatergic axons can sufficiently activate NMDA receptors for short and long-term
plasticity (de Olmos et al., 1978; Shipley and Adamek, 1984; Dietz and Murthy, 2005; Balu et al., 2007) and this glutamatergic afferent activation provides a robust plasticity mechanism for mediating signals in the OB (Wilson, 1995; McNamara et al., 2008; Gao and Strowbridge, 2009). Interestingly, amygdaloid structures also project glutamatergic afferents to AOB GCs, although little is known of their functional role (Fan and Luo, 2009). Additionally, feedback projections from olfactory associated areas to the MOB have been shown to be important for odor reward associations and modulate of interneurons (Kiselycznyk et al., 2006; Mouret et al., 2009a). In addition to glutamatergic OB innervation, GABAergic nuclei located in the HDB/MCPOproject afferent fibers to the MOB and AOB, and disruption of this top-down inhibitory input can interfere with odor discrimination (Nunez-Parra et al., 2013). The BST also sends GABAergic fibers to AOB, however
little is known of the functional purpose for this afferent GABAergic input to the AOB (Fan and Luo, 2009).
Activation of neuromodulatory systems occurs on a state dependent basis, adapting the tone of neuromodulatory release to the demands of the
behavioral task and animals environmental (Marder, 2012). Several
neuromodulatory centers project afferent axons to the OBs, including the cholinergic system from nucleus of the diagonal band of broca (HDB) (Ichikawa and Hirata, 1986), the noradrenergic system from the locus coeruleus (LC) (McLean et al., 1989), and the serotonergic system from the raphe nuclei (RN) (McLean et al., 1989; Fletcher and Chen, 2010). Changes in MTC spike timing and synchronizations evoked by neuromodulators can affect several aspects of OB processing, including generating contrasting odor representations, variations in the signal to noise ratio, and short- and long-term plasticity mechanisms (Devore and Linster, 2012). For example, noradrenergic modulation of MTC synchrony has been shown during an odor reward task (Doucette et al., 2011). Noradrenergic activation in the AOB and MOB triggers robust inhibition of MTCs via activation of α1-adrenergic
receptors (ARs) located on GCs (Smith et al., 2009; Zimnik et al., 2013). Noradrenaline (NA) acting on the AOB circuitry is thought to promote the structural and functional synaptic plasticity underlying VNS mediated
behaviors that require learning (Brennan and Keverne, 1997; Matsuoka et al., 2004). Specifically, noradrenergic modulation of AOB circuitry underlies the formation of memory in the “Bruce effect” in mice, as well as a role in
association between the conditioned odor and a reward (Brennan et al., 1998; Brennan and Peele, 2003). In sheep, NA plays an important role in olfactory
learning of offspring odor (Lévy et al., 1990). Serotonergic input targets the OB GL, where serotonin (5-HT) acts on PGCs to increase the inhibitory tone on MCs (McLean and Shipley, 1987; Hardy et al., 2005; Petzold et al., 2009; Liu et al., 2012). 5-HT may also synchronize inhibitory inputs among nearby, but not distant pairs of MTCs, thus contributing to MC firing dynamics
(Schmidt and Strowbridge, 2014). While, the role of 5-HT in social stress, anxiety, and aggression has been well documented, little is known how 5-HT contributes to olfactory mediated behaviors and under what context activation of 5-HT modulates these behaviors (Sachs et al., 2013; Huo et al., 2014).
Importantly, the concurrent activation ofneuromodulatory systems to varying degrees provides multiple and opposing roles on OB neurons transforming sensory signals en route to secondary structures (Marder, 2012).
Cholinergic System and the Olfactory Bulb
The OB receives a rich projection of cholinergic axons from nuclei residing in the horizontal limb of the diagonal band of broca (HDB) in the basal forebrain (Wenk et al., 1980; Zaborszky et al., 1986). The majority of cholinergic neurons (>70%) in the HDB send axons to the OB, where ACh activates both nicotinic and muscarinic ACh receptors (nAChR and mAChR, receptively), located within the multiple layers of the OB (Macrides et al., 1981; Ojima et al., 1988; Kasa et al., 1995; Le Jeune et al., 1995). Cholinergic neurons in the HDB are regulated in a behavioral state dependent manner, displaying neuronal bursting during active states (e.g. attention) and synchronize with gamma and theta oscillations (Manns et al., 2000; Lee et al., 2005; Parikh
and Sarter, 2008). Recent work suggests the activation of post synaptic targets by ACh likely occurs by a volume transmission mechanism (bulk neurotransmitter release in space), instead of the classic “wired” model with direct neurotransmitter release at the synapse (Sarter et al., 2009). Thus, activation of cholinergic axons leads to global changes in ACh levels to activate target neurons, which results in prolonged duration of its activation (Descarries et al., 1997). Furthermore, cholinergic neurons modulate several functions critical for generating neural representations of visual,
somatosensory, and auditory signals (Tremblay et al., 1990; Kilgard and Merzenich, 1998; Goard and Dan, 2009).
The mAChR family is divided into five metabotropic receptor subtypes, termed M1-M5 mAChRs, and upon activation mAChRs elicits distinct cellular effects (Lanzafame et al., 2003; Gotti et al., 2006). Among the five mAChR subtypes, two subfamilies exist, the “M1-like” mAChRs (M1, M3, M5) which couple to PLC and excite neurons, and the “M2-like” mAChRs (M2, M4), which inhibit adenlylate cyclase (AC) to inhibit neurons (Thiele, 2013). On the other hand, nAChRs are ligand-gated non-selective cationic ion channels composed of five subunits that, unlike the neuromuscular junction channel, exist in the brain as a combination of α2–α10 and β2–β4 subunits. Different subunit compositions bestow unique activation kinetics and conductance properties to each receptor subtype (Fucile, 2004). In the OB, AChRs exhibit differential patterns of distribution across its neuronal layers, and nAChRs are predominantly found in the glomerular layer while mAChR in internal layers, raising the interesting possibility that activation of these receptors modulate different aspects of olfactory processing (Hill et al., 1993; Le Jeune et al.,
1996; Keiger and Walker, 2000; Whiteaker et al., 2009). Recently, the presence of a small population of local cholinergic interneurons in the MOB was described, which were identified by their expression of choline acetyl transferase (ChAT), an enzyme critical for the production of ACh. A functional role of these neurons to the OB circuit remains unknown (Krosnowski et al., 2012).
Cholinergic axons densely innervate the GABAergic interneuron population of the OB and changes in brain state is capable to modify inhibition at the GC to MC DDS (Elaagouby et al., 1991; Kasa et al., 1995; Tsuno et al., 2008). ACh binds M1-mAChRs on GCs and activates a slow after depolarizing current (sADP) following a stimulus-induced train of action potentials that potentiates the strength of inhibition onto MTC (Pressler et al., 2007; Smith and Araneda, 2010). The activation of a sADP appears to be a conserved neuromodulatory target in GCs, as metabotropic glutamate receptor type 1 (mGluR1), and α1A
ARs activation also elicit the sADP (Smith et al., 2009; Smith and Araneda, 2010). Characterization of the ionic mechanisms underlying the M1-mAChR, α1 ARs, and mGluR1 induced sADP indicated that this is mediated by a
nonselective cationic current (ICAN), which as in other brain regions is thought
to occur through activation of transient receptor potential (TRP) channels (Yan et al., 2009; Smith and Araneda, 2010). Neuromodulation of the sADP provides an additional mechanism to increase inhibition at DDS. However, another study of cholinergic neuromodulation of AOB GCs indicated that the M1-mAChR mediated excitation originated through closure of KCNQ/Kv7 channels (Takahashi and Kaba, 2010). The reason for these discrepancies are not known, but, regardless of the mechanism, neuromodulation of the GC
lateral inhibitory network is thought to be an important contributor to MTCs spiking dynamics and modifying odor representation decorrelation (Linster and Cleland, 2002; Cleland and Linster, 2005; Lepousez and Lledo, 2013). In addition, the glomerular microcircuit has several properties for processing distributed odor representations, particularly gain modulation, thresholding of responses and feedforward activation (Carey et al., 2015). ACh has also been shown to modulate the MOB glomerular circuit, as activation of nAChR produces a depolarization on apical dendrites of MTC, external tufted cells (ETC), and periglomerular cells (Castillo et al., 1999; Pignatelli and Belluzzi, 2008; D’Souza and Vijayaraghavan, 2012; D’Souza et al., 2013).
Interestingly, although still a not fully settled issue, external tufted cells (ETCs) seem to convey and modulate sensory input in a diffuse multistep mechanism onto MCs, which suggests ACh may contribute a larger role then previous thought to modulation on glomerular processing (Shao et al., 2009; Gire et al., 2012).
Results from in vivo and in vitro studies revealed mixed results observing cellular effects of ACh activation of OB neurons. For example, electrical stimulation of HDB neurons inhibits GCs and increases the activity of MTC cells by disinhibition (Kunze et al., 1991; Zhan et al., 2013). Conversely, using more selective optogenetic stimulation of HDB ChAT nuclei, the ACh effect on MOB MCs becomes inhibitory (Ma and Luo, 2012; Rothermel et al., 2014). However, in the same study (Rothermel et al., 2014), when optogenetic stimulation occurred superficially in the MOB, thus activating glomerular circuitry preferentially to the deeper inhibitory network, MTC neurons were excited. The observed disinhibitory effect could be ascribed to nonselective stimulation of GABAerigic neurons which reside juxtaposed in the HDB to
ChAT neurons and thus GABA release could be mediating this effect at several layers (Nunez-Parra et al., 2013). It is noteworthy that a small subset of HDB neurons project to the PC and AON, albeit to a much lesser degree, and could potentially affect OB processing through feedback projections (Woolf et al., 1986; Markopoulos et al., 2012).
Interestingly, Alzheimer’s disease and ageing related pathophysiology is highly correlated with cholinergic dysfunction (Durand et al., 1998). In fact, in several neurodogenerative diseases, including AD, olfactory symptoms are the earliest markers of disease. This highlights the importance of
understanding synaptic and circuit levels of cholinergic modulation in the OB circuits.
Olfactory System and Behavior
Social interactions in many mammalian species rely on the concurrent detection and processing of chemosensory signals by the MOS and VNS. Classically, the MOS has been associated with learned responses to odors, whereas the VNS is thought to mediate innate odor responses. However, recent evidences demonstrating neuroanatomical overlap of AOB and MOB MTC axonal projections to central structures suggests that a combined olfactory representation is more likely to underlie the execution of behaviors (Mucignat-Caretta et al., 2012). As MOS and VNS simultaneously detect biologically relevant odors, both volatile and non-volatiles, deciphering the degree to which one system contributes to specific olfactory behaviors is challenging, if not impossible with current experimental approaches.
Following the advent of molecular biology approaches to ablate sensory system components, the VNS and MOS contributions to detecting biologically relevant odor still remains unclear. For example, transgenic knockout mice lacking the TRPC2 channel (TRPC2 -/-), the primary cationic channel conductance in VRs, leads to indiscriminate male courtship and mounting toward females, however, these male mice can successfully mate with females (Leypold et al., 2002; Stowers et al., 2002; Kimchi et al., 2007). Further, male mice with VNOs surgically removed (VNOx) mate successfully, but also display impaired sexual behaviors and individual recognition through nonvolatile odorants (Kimchi et al., 2007). Most intriguingly, the VNOx
induced disruption of sexual behavior only exists in sexually naïve males, as sexually experienced males that receive VNOx exhibit normal copulatory behaviors (Pfeiffer and Johnston, 1994). Intriguingly, more recent evidence demonstrates TRPC2-expressing sensory neurons in the main olfactory epithelium of the mouse, suggesting TRPC2 may play a functional role in the MOS, and that behavioral phenotypes observed in the TRPC2 -/- are entirely due to VNO disruption (Omura and Mombaerts, 2014). Further confounding the classic VNS role in sexual behaviors, disruption of the MOE, either using chemical wash or a transgenic knockout mouse for CNGA2 channel (CNGA2 -/-), the primary cationic conductance in MOE ORs, also caused male mice display a marked decrease (chemical wash) and completely abolished (CNGA2 -/-) mating behaviors (Mandiyan et al., 2005).
Several additional biologically relevant olfactory behaviors rely on overlapping MOS and VNS roles. For example, odors critical for reproductive behaviors, such as mate identification and neonatal care, are detected by both of these
systems (Keller et al., 2009). The MOS mediates response to the air born mammary pheromone 2-methylbut-2-enal (2MB2) in rabbits, the sex pheromone trimethyl amine in mice, and the predator odor signal
trimethlytoluine (TMT) (Schaal et al., 2003; Staples et al., 2008). However in mice, major urinary proteins (MUPs) are exclusively detected by VNS V2Rs and mediate avoidance behaviors (Papes et al., 2010). In addition, the VNS mediates the response to sex hormone ESP1 (Haga et al., 2010).
The MOS and VNS also seem to play a complimentary role in mediating aggression responses. In rodents, male to male territorial aggression is an innate social behavior triggered by urinary compounds (Chamero et al., 2007). This behavior is most commonly assessed with the resident intruder paradigm, in which a male intruding mouse is presented in the home cage of a resident male mouse, leading to a aggressive encounter, which can be quantified ((Koolhaas et al., 2013) described in methods). Male mice with disrupted function of the VNO, VNOx and TRPC2 (-/-), and fail to display proper aggression (Clancy et al., 1984; Maruniak et al., 1986; Stowers et al., 2002; Kimchi et al., 2007). Surprisingly, male mice with disrupted function in the MOE via chemical ablation of OSNs, or in transgenic CNGA2 -/- mice, display decreased aggressive behaviors toward intruding male mice
(Mandiyan et al., 2005; Keller et al., 2006). Recently it has been shown that MOB targets in the cortical amygdala function in innate odor driven responses (Root et al., 2014). Taken together, these studies support the hypothesis that both systems participate in the detection of aggression relevant odors and that parallel contributions to chemosensory perception may underlie triggering of these olfactory mediate behaviors.
Several reproductive and social behaviors are mediated by precise neuromodulatory changes in physiological and neuroendocrine states (Brennan, 2009). For example, NA is important for innate and learned fear responses in mice, as well as the formation of stud memory in mice (Brennan and Keverne, 1997; Brennan and Peele, 2003; Luo et al., 2003; Matsuoka et al., 2004; Do Monte et al., 2008), while NA in the MOB triggers maternal recognition in ewes, highlighting the role of olfactory circuits and
neuromodulators in biologically relevant behaviors (Lévy et al., 1990). Interestingly, despite the crucial role of the VNS in the processing of
pheromonal information, the behavioral and cellular effects of the ACh in this system is largely unknown (Halpern and Martinez-Marcos, 2003).
The most widely used test of MOS function is the odor discrimination task, where mice can be tested for performance based on difficulty of an two odor discrimination test (i.e habituation/dishabituation paradigm) (Rinberg et al., 2006b). Pharmacological modification of cholinergic activity can impair or enhance odor discrimination, modify olfactory perception and short-term olfactory memories, and these effects are thought to occur via changes in odor coding by MTCs (Roman et al., 1993; Ravel et al., 1994; Doty et al., 1999; Mandairon et al., 2006; Chaudhury et al., 2009). Moreover, local infusion of cholinergic antagonists in the PC can disrupt acquisition of olfactory pattern separation, suggesting cholinergic activation could play a functional role in the cortex to mediate different olfactory behaviors (Chapuis and Wilson, 2013).
CHAPTER 2: Methods
Animals
All animal procedures were carried out in accordance to the guidelines of the Institutional Animal Care and Use Committee (IACUC) of the University of Maryland. Electrophysiological and behavioral experiments were performed on wild-type strains (C57/BL6, Jackson Labs; Cf1/129S, Charles River) or transgenic mice expressing proteins under the choline acetyltransferase (ChAT) promoter: the Cre, Tau-GFP, and
ChAT-Channelrhodopsin2-YFP lines (ChAT-ChR). The presence of the yellow fluorescent protein (YFP) in the latter allows for direct fluorescence detection of ChR expressing neurons. The ChAT-Cre and ChAT-ChR were obtained from Jackson Labs, stock # 006410 and 014546 (Rossi et al., 2011; Zhao et al., 2011). The Chat-Tau-GFP line was generously provided by Dr. Sukumar Vijayaraghavan (Salcedo et al., 2011), and the M1 and M1/M3 −/− double knockout mouse were provided by Dr. Jurgen Wess, NIH (Gautam et al., 2004). The OMP-YPF mice was obtained from Jackson Labs, stock # 014173 (Shusterman et al., 2011). Experiments were conducted in mice ranging in age from postnatal day 20 (PD-20) through 6 months old. Animals were kept on a 12-h light/dark cycle with access to food and water ad libitum. Behavioral testing occurred within a 5 hour window after the start of the dark phase of the light cycle.
Slice preparation
Electrophysiological recordings were performed in OB slices using methods previously described (Smith et al., 2009). Briefly, after euthanasia, the brain
was quickly removed and placed in oxygenated ice-cold artificial
cerebrospinal fluid (ACSF) containing low Ca2+ (1 mM) and high Mg2+ (6 mM). Sagittal and horizontal sections (250 µm) of the OB were obtained using a Leica microslicer (Redding, CA). Slices were then transferred to an incubation chamber containing normal ACSF (see below) and left to recuperate at 35°C for 30 min, and at room temperature thereafter. For all experiments, the extracellular solution was ACSF of the following composition (in mM): 125 NaCl, 25 NaHCO3, 1.25 NaH2PO4, 3 KCl, 2 CaCl2, 1 MgCl2, 3 myo-inositol, 0.3 ascorbic acid, 2 Na-pyruvate, and 15 glucose, continuously oxygenated (95% O2/5% CO2). Experiments were performed at room temperature (∼25°C).
Data acquisition and analysis
After incubation, the slices were transferred to a recording chamber mounted on the stage of an Olympus BX51 microscope. Recordings were performed using a dual EPC10 amplifier (HEKA, Union City, NY) in the current-clamp mode. Fluorescence labeled neurons were visualized using 10X and 40X LUMPlanFI/IR Olympus water immersion objectives. Fluorescent illumination was achieved using an OPTOLED (Cairn Research LTD, UK) with blue and white LEDs (blue exciter λ 488 nm, green exciter λ 594 nm, Chroma
Technology, VT). Emitted light was collected using an ORCA-Flash4.0 V2 sCMOS camera (Hamamatsu, Japan). LED stimulations were commanded using the PatchMaster software (HEKA USA, Bellmore, NY) and imaging analysis was performed offline using the ImageJ, IgorPro software
(Wavemetrics, OR) and MATLAB. Current simulations mimicking in vivo synaptic activity were generated with MATLAB software and modeled using
neuronal parameters previously described (Galan et al., 2008; Padmanabhan and Urban, 2010). These simulated currents were superimposed onto direct current stimuli of different intensity (-20 to 80 pA) that were randomly
interleaved. For ChR light stimulations, the blue light (λ 488 nm) intensity after the 40x objective was placed over the OB was 5 mW. Recordings were performed using standard patch pipettes (3-8 MΩ resistance), with an internal solution of the following composition (in mM): 120 K-gluconate, 10
Na-Gluconate, 4 NaCl, 10 HEPES-K, 10 Na phosphocreatine, 2 Na-ATP, 4 Mg-ATP, and 0.3 GTP, adjusted to pH 7.3 with KOH. In voltage-clamp, the internal solution had the following composition (in mM): 125 Cs-gluconate, 4 NaCl, 2 MgCl2,
2 CaCl2, 2 EGTA, 10 HEPES, 2 Na-ATP, 4 Mg-ATP, and 0.3 GTP adjusted to pH 7.3
with CsOH. The fluorescent marker Alexa-Fluor 594 (10 µM, Life
Technologies) was included in the pipette solution for reconstruction and post hoc analysis of cell morphology using confocal imaging. MCs lacking primary and/or lateral dendrites were not included in the analysis. For Ca-imaging experiments, slices from ChAT-Cre mice expressing hM4Di (see below),
containing the HDB, were transferred to a Milicell culture dish (Millipore Corp, Billerica, MA) containing 5 mL of oxygenated ACSF with 5 µM of the calcium indicator Fluo-4 AM (Molecular Probes, Life Technologies). Slices were submerged in the dye for 20 min and then transferred to the recording chamber. Illumination was achieved using an OPTOLED blue LED (exciter 488 nm center wavelength, Chroma; Cairn Research LTD). The emitted light was collected using an ORCA-Flash4.0 camera (Hamamatsu), and images were recorded using the HCimage software (Hamamatsu). The data in Fig. 5B correspond to optical recordings of selected HDB neurons responding to clozapine N-oxide (CNO). The ratio of the change in fluorescence with
respect to baseline was expressed as ∆F/F0. Electrophysiology and imaging
analysis was performed offline using the ImageJ and IgorPro (Wavemetrics) software. The afterhyperpolarization (AHP) was measured as the most negative value of membrane potential following the depolarizing stimulus, and its peak usually occurred within 100 ms after the end of the pulse. The sADP was measured as the most positive value of membrane potential after the end of the pulse and its peak generally occurred within 5–10 s of the end of stimulus. The baseline value of
membrane potential prestimulus was subtracted from each of these values; therefore the reported values of sADP correspond to the ΔV. The size of the sADP reported here corresponds to averages of the largest sADP recorded in different cells in the presence of agonist or agonist plus antagonist. To quantify the increase in synaptic activity induced by mAChR activation, we calculated the frequency of spontaneous excitatory potentials before and after oxotremorine (Oxo) addition. The average dose-response curve (DRC) for nicotine (Nic) was obtained from cells where at least three different concentrations of nicotine were applied, including 30 µM, which was used to normalize the responses. The DRC for Oxo was obtained in each cell using a concentration range of 0.3–10 µM, and the responses were normalized to 10 µM. For Nic and Oxo, the DRC for each cell was fitted to the Hill equation using the IgorPro software. The current-voltage relation for Nic in MCs was obtained using a ramp protocol from –120 to +60 mV (300 mV/ms) and in the presence of Ni 100 µM, Cd 100 µM, d-2-amino-5-phosphonopentanoic acid (APV) 100 µM, 2,3-dihydroxy-6-nitro-7-sulfamoybenzo-(f)-quinoxaline (NBQX) 10 µM, BMI 10 µM, and TTX 1 µM. Data values are presented as the mean ± SEM and statistical significance (p values) for pairwise comparisons were calculated using the Student’s t test, and presented as follows (unless noted in Figure): *p < 0.05, **p < 0.02 and ***p < 0.01.
Confocal imaging and immunohistochemistry
Mice were perfused intracardially with 4% paraformaldehyde (PFA) and after dissection, the brains were post fixed overnight at 4 °C. Subsequently, the brains were placed in phosphate buffered saline (PBS) and sagittally sliced at 100 µm. Similarly, for MCs fluorescently labeled during electrophysiological recordings, at the end of the experiments, slices were placed in 4% PFA for 20 min at room temperature (RT) and then washed overnight in PBS. Cells were visualized using TO-PRO-3 (T3605, Life Technologies) or DAPI (F6057, Sigma-Aldrich). For double-labeling immunofluorescence, free-floating
sections (100 µm) obtained in a Vibroslicer (Vibratome Series 1000) were washed twice in PBS and then incubated with 10% donkey serum (Sigma Aldrich) in 0.1% PBS-Triton X-100 (PBS-T) for 1 h at RT. Slices were incubated overnight with one or more of the following primary antibodies, diluted in PBS-T with 2.5% of donkey serum; goat anti-ChAT (1:500, ab144p, Millipore), rabbit anti-VAChT (1:150, ab68984, Abcam), mouse anti-AChE (1:100, ab2803, Abcam), rabbit anti GFP (1:1000, A11122, Life Technologies) and mouse anti-RFP (1:750, ab65856, Abcam). After incubation with the primary antibodies the samples were washed with PBS-T seven times (5 min each), and then incubated for 2 h at RT with the secondary antibody: donkey anti-rabbit Alexa-488 (A-21206, Life Technologies); donkey anti-mouse Alexa-594 21207, Life Technologies) and donkey anti-goat Alexa-488 (A-11055, Life Technologies), all diluted at 1:750 in PBS-T with donkey serum (2.5%). The sections were then washed three times in PBS-T and then four times in regular PBS (5 min each). To visualize immunofluorescence, slices were mounted with Vectashield (Vector Laboratories) and imaged with a Leica SP5x confocal microscope (Leica Microsystems). Confocal imaging
reconstructions and analysis were performed using the Leica software and ImageJ. For analysis of the density of ChAT positive (ChAT+) fibers in the OB (Fig. 4.4), we used an anti-GFP antibody to enhance the signal.
Reconstruction were produced from stacked confocal images (63x, 50 µm in the z plane) and fluorescence intensity profiles were generated along a randomly selected 10 µm wide ROI. Fluorescence intensity values were quantified for the glomerular layer (GL), mitral cell layer (MCL), and granule cell layer (GCL). For each slice the fluorescence intensity values were normalized to the background fluorescence (ΔF/F), and values were averaged across animals. Analysis of axonal fiber density in the OB was performed as previously described (Krosnowski et al., 2012). Briefly, the raw images are filtered (5px median filter) and normalized to the peak values for each image. We then determined the average fluorescence intensity
Stereotaxic viral injections
Expression of the hM4Di and hM3Dq DREADDS in ChAT-Cre mice was
achieved by stereotaxic targeted injections (1 'L) of the adenovirus AAV8-hSyn-DIO-hM3D(Gq)-mCherry or AAV8-hSyn-DIO-hM4D(Gi)-mCherry (University of North Carolina vector core) bilaterally into the HDB. Anesthetized mice (1.5% Isoflurane) were head-fixed (Model 900, Kopf Instruments) and a 33-gauge needle (5 µL syringe, Hamilton Company) was
! "#$%&'!()*!+,'-.$'/'0#1!1./0&.2!.3!456!1,.2#/'&$#1!/'%&./7!8+,9:;!!"# $!$%) 9)!"#$%$&#'()*!#'%+$#),+!&-!'!%$*&./),',#!'0$,&1'22&*)'#$0!3)%42!566789!*&,#'),),+!'!0&4/:;1 -:&($0!),3$%#$0!&<$,!%$'0),+!-%'.$!$,*&0),+!=>?@A 5667B1=";,1@CD1=>[email protected]=$%%;9! &%!=>G@)!5667B1=";,1@CD1=>G@5E)91.F=$%%;9!),#&!#=$!H@I!&-!!"#$%&'(!#%',2+$,)*!.)*$J!),!
K=)*=! F%$1%$*&./),'2$! )2! =)+=:;! ',0! 2<$*)-)*'::;! $(<%$22$0! ),! '*$#;:*=&:),$! <%&04*),+! ,$4%&,2! 86;)! L=$2$! 667! 3$*#&%2! -'*):)#'#$! #=$! $(<%$22)&,! &-! .F=$%%;! ),! =>?@A! &%! =>G@)!
$(*:42)3$:;! ),! F%$1$(<%$22),+! *$::2M! ! ! +)! @NO6@@2! '%$! .4#',#! .42*'%),)*! %$*$<#&%2J! =>?@A!!
',0!=>G@)M!!!FPD!'*#)3'#)&,!&-!=>?@A!*&4<:$2!K)#=!EA!#&!'*#)3'#$!QRF1I!#&!2#).4:'#$!QCQ8!
=;0%&:;2)2! ),#&! ),&2)#&:1#%)2<=&2<='#$! 5CQ?9! ',0! 0)'*;:+:;*$%&:! 5@6E9J! #=$,! @6E! '*#)3'#$2! QSFJ! ',0! CQ?! '*#)3'#$2! #=$! CQ?! %$*$<#&%! 5CQ?N9! #&! *'42$! *':*)4.! %$:$'2$! -%&.! #=$! ONJ! ',0! :$'02! #&! *$::4:'%! $(*)#'#)&,M! ! ! FPD! '*#)3'#)&,! &-! =>G@)! *&4<:$2! #&! E)1EQFN2! &<$,2! ECNS! #&!
'*#)3'#$! '! =;<$%<&:'%)T),+! *4%%$,#! 56:2&! 2$$! U)+4%$! VMW9M! U)+4%$! F! .&0)-)$0! -%&.! X! Y$22! N$3)$KJ!8Z[?M!
inserted through a 1 mm craniotomy window. The speed of virus injection (100 nL/min) was achieved by using a syringe pump (Micro4 Microsyringe pump, World Precision Instruments). Injections in the HDB was targeted using the following coordinates, in relation to bregma (in mm); Dorsal-Ventral axis -5.4, Medial-Lateral -1.625, Anterior-Posterior +0.14. Virus injections occurred at PD-30 and behavioral experiments were conducted beginning 6 weeks after the virus injection. We note that at 6 weeks post injection, the presence of the DREADDs can be readily detected using antibodies, however the red fluorescence (mCherry) in live tissue is very low, making the targeted patch recordings difficult.
Behavioral tests for natural odor discrimination
Odor discrimination was tested using the habituation/dishabituation paradigm as previously described (Nunez-Parra et al., 2013). Briefly, ChAT-Cre mice virally transfected with hM4Di or hM3Dq received an intra peritoneal (i.p.)
injection of PBS (control) or the biologically inert ligand clozapine N-oxide (CNO, 0.5mg/1 mL/100g, treated). Activation of DREADDS with CNO allows for modulation of HDB cholinergic neurons at physiological levels, with optimal behavioral effects observed 2 hours post CNO injection (Sternson and Roth, 2014). Ninety minutes post injection, mice were placed in a clean cage (20 cm x 40 cm) in the presence of an unscented wooden block for 30 minutes.
Following this familiarization period, both groups were tested for their ability to discriminate between the following odor pairs; ethyl heptanoate (C7)/ ethyl octanoate (C8), ethyl hexanoate (C6)/ ethyl octanoate (C8), L-carvone /D-carvone and "-pinene /#-pinene. During the habituation phase, each mouse was exposed during three consecutive trials to a wooden block scented with 100 'L of the first odor (1:1,000 dilution). The fourth exposure consisted of the test odor (dishabituation); each exposure lasted 2 min, with a 1 min inter trial interval. Each trial was videotaped for off-line quantification of the time the mouse spent investigating the block. The investigation time was defined as the total time when the mouse’s nose was within a 2 cm radius of the wooden block. For assessment of odor threshold in the ChAT-hM4Di and
hM3Dq mice, C7 was tested at increasing odor concentrations (1:60,000;
1:40,000; 1:30,000; 1:20,000) following three presentations of a block
“scented” with distilled water. Odor discrimination was considered successful ! ! ! "#$%&'!()(!<=.&!5#71&#-#/>0#./!:'70!?>&>=#$-)! $)*+!F=$.)*':!2#%4*#4%$!&-!&0&%2!#$2#$0!),!='/)#4'#)&,\0)2='/)#4'#)&,! <'%'0)+.! 9)! R1! ',0! @1F'%3&,$J! 6)! $#=;:! =$(',&'#$! 5FW9J! $#=;:! =$<#',&'#$!5F]9J!$#=;:!&*#',&'#$5FB9M!+)!^_`!<),$,$M!!,)--).+!E%'<=)*! 0$<)*#2! #).$:),$! -&%! &0&%! <%$2$,#'#)&,2! 04%),+! ='/)#)')#&,\0)2='/')#4')#&,!<'%'0)+.M!!
when mice showed a significant increase in investigation during the presentation of the test odor (C7).
Behavioral tests for natural investigation of male and female odors
Assessment of aggression-induced avoidance of conspecific odors in males was conducted using a modified resident-intruder paradigm (Koolhaas et al., 2013). Sexually naïve ChAT- hM4Di mice (intruders) and background
matched CF1/129S mice (residents) were housed in isolation for two weeks prior to the experiments. Following the isolation period, experiments were performed in a neutral environment (20 cm x 40 cm cage) and soiled bedding from a conspecific was presented in a petri dish (100 x 15 mm) for 15 min. Ninety minutes post injection of PBS, or CNO, the ChAT-hM4Di intruder mice
were presented again with soiled bedding from a resident male. Next, ChAT- hM4Di intruder mice undergo an aggressive encounter with the resident in
which the ChAT- hM4Di intruder is defeated. Following the aggressive
encounter, the ChAT- hM4Di intruder is returned to the neutral test arena and
presented again with the soiled bedding from the resident mouse. To assess male preference for female bedding, male ChAT-hM4Di mice were first placed
in the test arena in the presence of male soiled bedding as a control. Next, they were presented with female soiled bedding (15 min each). Female soiled bedding was obtained from group housed, sexually naïve, age/background matched mice (CF1/129S). All experiments were filmed using a camera with IR sensitivity for offline analysis (Full Spectrum 1080p IR Camera, Cleveland Paranormal Supply Co, OH). Mice trajectories were analyzed using a custom MATLAB tracking software. Data shown in Fig. 4.6 are presented as a ratio from Trial 2 to Trial 1 (Trial 2 / Trial 1) of the average distance from the dish
the intruder spent during the trial. Larger absolute values for the ratio indicate preference or avoidance for the soiled bedding. Quantifications of stereotypic social behaviors were performed by a blind observer and quantified as the total duration (s) within the 15 min investigation trial. The behaviors quantified included; investigating, (mouse nose in downward position on/in the petri dish), exploring (traversing cage, digging, climbing on walls, nondescript movement), grooming, and freezing.
Behavioral test for novel object recognition
The two samples, one environment, version of the novel object recognition (NOR) task was used following the protocol (Bevins and Besheer, 2006). The training objects used were two blue marbles, and the novel object used was a yellow wooden cube of approximately similar size. Prior to the NOR task, ChAT-hM4Di mice were familiarized to the testing arena for 10 minutes during
two consecutive days. For NOR, the training period was 10 minutes, followed by a 45 minute interval before a 5 minute testing period. CNO injections were administered 2 hours before the start of training. The familiarization, training, and testing periods, were filmed and analyzed in custom MATLAB software to quantify investigation times and motor behavior in general.
Solutions and pharmacological agents
The following drugs were bath applied: N,N,N-‐trimethyl-‐4-‐(2-‐oxo-‐1-‐pyrolidinyl)-‐ 2-‐butyn-‐1-‐ammonium iodide (oxo), 6-‐imino-‐3-‐(4-‐methoxyphenyl)-‐1(6H)-‐
pyridazinebutanoic acid hydrobromide (GABAzine), 6-‐cyano-‐7-‐ nitroquinoxaline-‐2,3-‐dione disodium (CNQX), DL-‐2-‐Amino-‐5-‐
phosphonopentanoic acid (APV), 11-‐[[2-‐[(Diethylamino)methyl]-‐1-‐
piperidinyl]acetyl]-‐5,11-‐dihydro-‐6H-‐pyrido[2,3-‐b][1,4]benzodiazepin-‐6-‐one (AFDX-‐116), [S-‐(R*,R*)]-‐[3-‐[[1-‐(3,4-‐Dichlorophenyl)ethyl]amino]-‐2-‐
hydroxypropyl](cyclohexylmethyl) phosphinic acid (CGP-‐54626), (−)-‐nicotine ditartrate (Nic), tetrodotoxin (TTX), 4-‐[[[(3-‐chlorophenyl)amino]carbonyl]oxy]-‐ N,N,N-‐trimethyl-‐2-‐butyn-‐1-‐aminium chloride (MCN-‐A-‐343), 1,1-‐dimethyl-‐4-‐ diphenylacetoxypiperidinium iodide (4-‐DAMP), (−)-‐cytisine (Cys),
mecamylamine hydrochloride (MM), dihydro-‐β-‐erythroidine hydrobromide (DHBE), methyllycaconitine citrate (MLA), LY367385, and N-‐methyl-‐d-‐ glucamine (NMDG).
For electrophysiology recordings the speed of perfusion permitted for full solution exchange of the recording chamber in < 30 s. However, the reported values of "time to peak" are an overestimate, as we do not subtract the dead volume in the perfusion line, which also adds to the total time it takes the agonist to reach the recorded neuron. Therefore, in a few experiments we conducted experiments using local perfusion of drugs (AutoMate Scientific, CA). Antagonists were applied for at least 10 min before the application of the
agonist. All drugs were purchased from Tocris Cookson (UK) unless otherwise indicated. CNO, (Enzo Life Science) was prepared fresh daily in PBS at
0.5mg/mL, and injected at 0.5mg/100g. All odors used for behavior experiments were purchased from Sigma-‐Aldrich (St. Louis, MO).
Chapter 3 Cholinergic modulation of neuronal excitability in
the accessory olfactory bulb
Citation
Smith RS, Weitz CJ & Araneda RC (2009). Excitatory actions of
noradrenaline and metabotropic glutamate receptor activation in granule cells of the accessory olfactory bulb. J Neurophysiol 102, 1103–1114
Abstract
The accessory olfactory bulb (AOB), the first relay of chemosensory information in the Vomeronasal system, receives extensive cholinergic innervation from the basal forebrain. Cholinergic modulation of neuronal activity in the olfactory bulb has been hypothesized to play an important role in olfactory processing; however, little is known about the cellular actions of acetylcholine (ACh) within the AOB. Here using in vitro slice preparation, we show that muscarinic acetylcholine receptor (mAChR) activation increases neuronal excitability of granule and mitral/tufted cells (GCs and MCs) in the AOB. Activation of mAChRs increased excitability of GCs by three distinct mechanisms: induction of a long-lasting depolarization, activation of a slow afterdepolarization (sADP), and an increase in excitatory glutamatergic input due to MC depolarization. The depolarization and sADP were elicited by the selective agonist 4-[[[(3-chlorophenyl)amino]carbonyl]oxy]-N,N,N-trimethyl-2-butyn-1-aminium chloride (100 µM) and blocked by low concentrations of pirenzepine (300 nM), indicating that they result from activation of M1-like mAChRs. In contrast, cholinergic stimulation increased the excitability of MCs via recruitment of nicotinic AChRs (nAChRs) and M1-like mAChRs.
Submaximal activation of these receptors, however, decreased the excitability of MCs. Surprisingly, we found that unlike GCs in the main olfactory bulb, GCs in the AOB are excited by mAChR activation in young postnatal neurons, suggesting marked differences in cholinergic regulation of development between these two regions of the olfactory bulb.
Introduction
The olfactory bulb (OB) is the site of initial information processing in the olfactory pathway. The most abundant neurons within the main and
accessory OB (MOB and AOB, respectively) are the inhibitory granule cells (GCs). The GCs regulate the excitability of the principal projection neurons, the mitral and tufted cells (MCs) through GABAergic inhibition at reciprocal dendrodendritic synapses (Shepherd and Greer 1998). The processing of sensory information in the OB, and the relay of this information to higher centers by the MCs is crucial for the survival of most mammals (e.g., feeding and mating). The inhibitory synapses from GCs to MCs play an important role in olfactory processing and are the target of several afferent neuromodulatory systems to the OB (Ennis et al. 2007; Schoppa and Urban 2003).
The OB receives a rich cholinergic innervation from the nucleus of the horizontal limb of the diagonal band of Broca (HDB), located in the basal forebrain, which has divergent projections that innervate all layers of the OB (Kasa et al. 1995; Le Jeune and Jourdan 1991; Le Jeune et al. 1995; Nickell and Shipley 1988; Ojima et al. 1988; Zaborszky et al. 1986). Two types of cholinergic receptors, nicotinic and muscarinic receptors, mediate the actions of acetylcholine (ACh) throughout the brain (nAChRs and mAChRs,
respectively). ACh receptors are further divided into subtypes that elicit distinct cellular effects on activation, thereby providing a diverse array of mechanisms to regulate neuronal activity (Lanzafame et al., 2003; Gotti et al., 2006). Both nAChRs and mAChRs are found in the OB, albeit with a
differential pattern of distribution, suggesting that selective activation of these receptors could modulate different aspects of olfactory processing (Hill et al.,