UNIVERSITÉ DE MONTRÉAL
DESIGN OF A GAS-SOLID FLUIDIZED BED REACTOR AT HIGH
TEMPERATURE AND HIGH PRESSURE
BORHAN ABDELGAWAD
DÉPARTEMENT DE GÉNIE CHIMIQUE ÉCOLE POLYTECHNIQUE DE MONTRÉAL
MÉMOIRE PRÉSENTÉ EN VUE DE L’OBTENTION DU DIPLÔME DE MAÎTRISE ÈS SCIENCES APPLIQUÉES
(GÉNIE CHIMIQUE) AVRIL 2013
UNIVERSITÉ DE MONTRÉAL
ÉCOLE POLYTECHNIQUE DE MONTRÉAL
Ce mémoire intitulé:
DESIGN OF A GAS-SOLID FLUIDIZED BED REACTOR AT HIGH TEMPERATURE AND HIGH PRESSURE
presenté par : ABDELGAWAD Borhan
en vue de l’obtention du diplôme de : Maîtrise ès sciences appliquées a été dûment accepté par le jury d’examen constitué de :
M.FRADETTE Louis, Ph.D, président
M.CHAOUKI Jamal, Ph.D, membre et directeur de recherche M.DOUCET Jocelyn, Ph.D, membre
DEDICATION
ACKNOWLEDGEMENTS
Thanks be to God for my life through all tests. May your name be exalted, honoured, and glorified. I would like to express my deep appreciation and gratitude to the following people for their help and support. I have been indebted in the preparation of this thesis to my supervisor, Dr. Jamal Chaouki who gave me the opportunity to be part of this fascinating project and whose encouragement and guidance enabled me to become a better engineer. Furthermore, his ongoing care during my time of need will forever be appreciated.
The financial support provided by Total E&P, the industrial partner of this research chair and the Natural Sciences and Engineering Research Council of Canada (NSERC) is greatly appreciated. Furthermore, my sincerest gratitude goes to Dr Jean-Phillipe Laviolette who has provided me with new ideas and methods to perfect my design. I am grateful for all the support I received from Professor Chaouki’s research group to whom I wish nothing but success and happiness in life. The help and support I received from Dr. Rouzbeh Jafari and Mr Yazid Belkhir along with the entire staff of Ecole Polytechnique’s Chemical engineering department will forever be remembered and deeply appreciated. I would also like to express my sincerest gratitude to Dr Elizabeth Jones for her constant help and invaluable support throughout my masters.
The informal support and encouragement of my family and friends through both the good and the bad times has been indispensable, and I would like to thank all of them for being the wonderful people they are. My deepest gratitude goes to Claire Erwes for all her help and support throughout, whether if it’s for always making me feel like the center of attention whenever I would complain, or just for being awesome.
I would like to thank my best friend and brother Ahmed Farid for always being by my side whenever I needed him. I would also like to thank Bassel Hakoura and Omar El-Kayyali, who were always there for me whether if it was to help proof read a document, listen to my complaints or just hang out. I would like to thank Eyad El-Sadi and Youssef Ebeid for being great friends who would always take the time to check up on me whenever I disappeared to study. I would also like to thank Ahmed El-Baghdadi and Nasser El-Shawwa for always being available to help with any topic no matter how random it was. My sincerest gratitude and best wishes goes to, Ahmad Aziz, Jad Al-Rabi and Alia Bessisso for being my second family in Canada.
I am forever thankful for all the love and best wishes of my brother Mohamed and sisters Doua and Heba, which – despite their physical absence – helped me in the successful completion of my studies in Canada. I would also like to thank my uncle, Mohamed Fayek Abulela for his care and devotion during my studies as well as being a true role model. Finally, my most profound appreciation goes to my parents, Ahmed Abdelgawad and Aya Abulela who have been a constant source of support whether it be emotional, moral or of course financial – during my postgraduate years. If it were not for their sacrifices, patience and hard work this thesis would certainly not have existed. It is to them that I dedicate this work.
RÉSUMÉ
De nombreux procédés de raffinage et de pétrochimie sont réalisés dans des réacteurs agités ou dans les lits fluidisés qui impliquent des fluides polyphasiques dans des conditions extrêmes. L'utilisation de haute température et / ou haute pression lors de la conversion et la manipulation de fluides, se traduit par des conditions de traitement extrêmes pour lesquelles l'hydrodynamique demeure inconnu. En conséquence, avec seulement quelques études à haute température et très peu à haute température et haute pression, le développement de nouveaux modèles et de critères de conception lors de l'utilisation de conditions extrêmes est donc d'un intérêt immédiat pour Total, le partenaire industriel de cette chaire de recherche.
L’objectif de ce mémoire est d'examiner, ainsi que de comparer les modèles déjà publiés sur la fluidisation dans des conditions ambiantes et extrêmes, tout en mettant l'accent sur les informations nécessaires à la conception de réacteurs gaz-solide. Par conséquent, une conception détaillée d'un lit fluidisé qui permettrait un fonctionnement flexible à haute température et à haute pression sous plusieurs vitesses de gaz sera menée afin de servir pour le futur développement de nouveaux modèles hydrodynamiques.
Afin d'illustrer la nécessité de ce réacteur pilote, les effets résultant de l'utilisation de conditions d'opération extrêmes (haute température, pression et vitesse) sur la fluidisation et plus précisément la taille des bulles ont été démontrées. Ainsi, trois corrélations de taille de bulles ont été choisies: la première pour avoir été modélisée à haute pression et vitesse, la deuxième pour avoir été développée à haute température et la troisième pour avoir été une des corrélations les plus couramment citée dans les livres de conception de réacteur à lit fluidisé. Aucun de ces modèles a fourni des valeurs acceptables au-delà de sa plage désignée. En outre, l’effet de diamètre de bulles sur le transfert de masse, ainsi que sur la conversion, le taux d’entraînement et la hauteur limite de désengagement (TDH) a été étudiée tout en appliquant chacun des différents modèles de taille de bulles. Ainsi, plusieurs divergences ont été notées entre les résultats obtenus et les tendances attendues. En utilisant des représentations graphiques de l’entrainement en fonction de la hauteur au dessus du lit, TDH a été jugée indépendant de la taille des bulles. De plus, celui-ci varie avec la température, la pression et la vitesse, ce qui est contraire à plusieurs corrélations existantes. Par ailleurs, à des vitesses élevées, malgré l'obtention d'une grande valeur du TDH à la fois graphiquement et en utilisant les différents modèles existants, les changements
globaux dans le taux d’entrainement total sont négligeables. Par conséquent, dimensionner la zone de désengagement a partir de TDH tel que suggéré par la plupart des livres de conception de réacteurs à lits fluidisés, pourrait ne pas être rentable. De plus, en utilisant différents diamètres de bulles lors du calcul de la conversion du méthane dans la réaction de reformage, ce besoin de développer de nouveaux modèles a été une autre fois démontré à travers l’obtention de résultats qui diffèrent des valeurs attendues lorsque les paramètres d’opération sont changés.
Ainsi, avec ce besoin de développer de nouveaux modèles de fluidisation aux conditions extrêmes illustrées, la conception complète d'un réacteur à lit fluidisé et son procédé a été menée. Les conditions d’opération ont été choisis afin de servir en tant qu’une extrapolation adéquate à la réalité industrielle. Les dimensions du réacteur ont été choisis afin de permettre la comparaison avec un réacteur qui fonctionne à haute température existant actuellement dans notre laboratoire. En outre, ces conditions ont également été choisies tout en respectant les contraintes définies par le compresseur ainsi que les limites départementales liées à l'installation de ce réacteur au sein de l’université. Ce réacteur sera donc opéré à des températures de 25 à 1000°C et des pressions entre 1 et 20 atm, avec un diamètre de 15 cm à la base et 50 cm pour la zone de désengagement. La vitesse du gaz sera comprise entre 0,1 m/s et 2 m/s afin de couvrir le régime bouillonnant ainsi que le régime turbulent. Du sable ou autre type de catalyseur sera utilisé en tant que matière du lit. La taille de particule moyenne sera donc comprise entre 60 um et 500 um, de manière à inclure les particules de type Geldart A et B, avec une densité allant de 1 à 2.5g/cm3. De l’air comprimé provenant de trois différents compresseurs sera utilisé en tant que gaz de fluidisation. Afin de chauffer le réacteur aux températures requises, un système de chauffage a été conçu. Ce système comprend une conduite isolée où un appareil de chauffage électrique à haute pression capable de résister à des faibles débits sera attaché. Cet appareil de chauffage électrique sera utilisé pour préchauffer la conduite jusqu'à ce que la température d'auto-inflammation du gaz naturel est atteinte. À ce moment, le gaz naturel sera introduit avec l'air comprimé à travers des ports situés le long de la conduite. Ce système de chauffage est alors relié à la boîte à vent qui a été conçue pour permettre une conversion du méthane de plus de 99% afin d’assurer une réduction maximale de la concentration du monoxyde de carbone résultant de la combustion du gaz naturel.
De plus, pour s’assurer d’obtenir une fluidisation équitable à travers le lit, un distributeur à tuyères a été conçu afin de permettre une flexibilité d’opération sous les conditions choisies. Pour
empêcher l'entraînement des particules hors du réacteur, un cyclone ainsi qu’un filtre à haute température seront placés en série à l'intérieur de la zone de désengagement. Enfin, afin d'assurer que les vannes de régulation en aval du réacteur ne soit pas soumises à des températures supérieures à 300C, de l'eau distillée provenant d’un réservoir sous pression, sera pompée dans un purgeur vapeur à la sortie du réacteur.
Ainsi, l'atteinte de l'objectif de ce travail consistant en la conception d'un réacteur gaz-solide à lit fluidisé pour un fonctionnement souple sous des conditions ambiantes et extrêmes, a été réalisé à travers une description détaillée du procédé et une procédure d'opération.
ABSTRACT
Numerous processes of refining and petro chemistry involve multiphase fluids at extreme conditions, and are realized in agitated reactors or in fluidized beds. The use of high temperature and/or high pressure during conversion and handling of high viscosity materials and/or viscosity ratios results in extreme processing conditions for which the multiphase process hydrodynamics are completely unknown. Subsequently, with only a few studies at high temperature and almost none at high temperature and high pressure, general and reliable design criteria for the use of extreme conditions are scarce and therefore are of immediate interest to Total, the industrial partner of this research chair.
The aim of this work is to review and compare the already published models on fluidization at ambient and extreme conditions with emphasis on the information necessary for designing gas-solid reactors. Consequently, a detailed design of a fluidized bed reactor that would allow flexible operation at high temperature and high pressure at several gas velocities will be conducted in order to serve for the future development of new hydrodynamic models.
In order to illustrate the need for this laboratory scale reactor, the effect of using extreme operating conditions (high temperature, pressure and velocity) on fluidization and more specifically bubble size were demonstrated. Three bubble size correlations were chosen: the first for being respectively modeled at high pressure and velocity, the second for being modeled at high temperature and the third for being one of the most commonly used models in design books. None of these correlations provided acceptable values beyond their designated range. Furthermore, the impact of bubble diameter on mass transfer, reaction conversion, entrainment and the transport disengaging height (TDH) were studied through the application of each of these bubble size models. By doing so, several discrepancies between the obtained results and the expected trends were highlighted. Using entrainment plots, TDH was found to be independent of bubble size and vary with temperature, pressure and velocity, which is contrary to several existing correlations. Moreover, at high velocities, despite obtaining a large TDH value both graphically and by using the existing models, the overall changes in the total flux are negligible which would imply that sizing the freeboard accordingly, as suggested by most design books, might not be profitable.
By using different bubble diameters while computing the conversion of methane in the methane steam reforming reaction, the need for new models was once more demonstrated with different operating conditions providing different results from the expected trends.
With the need for new fluidization models at extreme conditions illustrated, the complete design of a fluidized bed reactor and its respective process was conducted. The operating conditions were chosen as an adequate extrapolation to industrial reality, while the reactor dimensions were chosen based on an existent reactor currently operating at high temperature in our laboratory. Furthermore, these conditions were also chosen while respecting the constraints defined by the compressor and the inherent limitations of the university experimental facility. The temperature of operation will be varied from room temperature to 1000 oC and the pressure will range from atmospheric pressure up to 20 atm. The reactor’s bed diameter is 15 cm at the bottom with a freeboard diameter of 50cm. The gas velocity will range from 0.1 m/s up to 2 m/s in order to cover the bubbling and turbulent regime. The bed material will be sand or another type of catalyst with a mean particle size ranging from 60 μm up to 500 μm, so as to cover Geldart A and B particles, and a specific gravity ranging from 1 to 2.5g/cm3. The chosen fluidization medium will be compressed air that will be provided by three different compressors.
In order to heat up the reactor to the required temperatures, a heating system was designed. This heating system comprises of an insulated pipe where a high pressure electric heater capable of withstanding low flowrates is attached. This electrical heater will be used to preheat the pipe until the auto-ignition temperature of natural gas is achieved. At this point, natural gas will be fed to the pipe along with the compressed air. This heating system will be connected to the windbox which was designed to allow over 99% conversion of methane to ensure that carbon monoxide concentration resulting from the natural gas combustion is at a minimum.
In order to provide even fluidization, a bubble cap distributor was designed to allow flexibility and freedom of operation under the chosen conditions. To prevent solid entrainment out of the reactor, a cyclone and high temperature filter will be placed in series inside the freeboard. Finally, in order to ensure that the control valve downstream of the reactor would not be subjected to temperature higher than 300C, distilled water from a pressurized tank will be pumped in a steam trap at the reactor exit in order to reduce the temperature of the gas.
With a detailed process description and operating procedure provided, the objective of this work of designing a gas-solid fluidized bed reactor and its utilities for flexible operation from ambient conditions up to high temperature and high pressure, were successfully met.
TABLE OF CONTENT
DEDICATION ... III ACKNOWLEDGEMENTS ... IV RÉSUMÉ ... VI ABSTRACT ... IX TABLE OF CONTENT ... XII LIST OF TABLES ... XV LISTE OF FIGURES ... XVII NOMENCLATURE ... XXI LIST OF APPENDICES ... XXVIII
CHAPTER 1 INTRODUCTION ... 1
1.1 Problem Statement and Motivation ... 1
1.2 Objectives ... 2
CHAPTER 2 LITTERATURE REVIEW ... 3
2.1 Fluidized Bed Principles ... 3
2.2 Fluidization Regimes ... 5
2.3 Effects of Particle Size and Density ... 7
2.4 Solid Mixing and Entrainment ... 8
2.5 Application of High Temperature and Pressure ... 9
CHAPTER 3 INFLUENCE OF USING EXTREME OPERATING CONDITIONS ON FLUIDIZED BED REACTORS ... 11
3.1 Influence of extreme conditions on fluidization ... 12
3.2 Bubble size under extreme conditions ... 13
3.2.2 Effect of pressure on bubble size ... 19
3.2.3 Effect of temperature on bubble size ... 21
3.3 Influence of Extreme Operating Conditions on Entrainment and TDH ... 26
3.3.1 Entrainment modelling ... 26
3.3.2 TDH modelling and influence of extreme conditions ... 38
3.4 Mass Transfer in Fluidized Beds ... 42
3.4.1 Effect of velocity on mass transfer ... 44
3.4.2 Effect of pressure on mass transfer ... 46
3.4.3 Effect of temperature on mass transfer ... 48
3.5 Effect of Extreme Conditions on Reaction Conversion ... 50
3.5.1 Methane steam reforming kinetics ... 50
3.5.2 Methane steam reforming modelling ... 53
3.6 Conclusion ... 64
CHAPTER 4 DESIGN OF THE FLUIDIZED BED REACTOR ... 67
4.1 Operating and Design Conditions ... 67
4.2 Reactor Design: Techniques and Procedures ... 68
4.2.1 Windbox/Plenum Design ... 68
4.2.2 Distributor Design ... 70
4.2.3 Particle Separation ... 77
4.2.4 Reactor Shell and Refractory Design ... 81
4.2.5 Reactor Heating System ... 83
4.3 Process Description ... 85
CHAPTER 5 FINAL REACTOR DESIGN AND PROCESS DESCRIPTION ... 89
5.1.1 Windbox final dimensions ... 89
5.1.2 Distributor final dimensions ... 90
5.1.3 Cyclone and filter final dimensions ... 93
5.1.4 Reactor shell and refractory final dimensions ... 95
5.1.5 Heating system final dimensions ... 97
5.2 Detailed Process Description ... 98
5.2.1 P&ID0001: Compressor System ... 98
5.2.2 P&ID0002: Fluidized Bed Heater and Windbox ... 99
5.2.3 P&ID0003: Fluidized Bed Freeboard and Gas Sampling ... 101
5.2.4 P&ID0004: Water Injection System ... 102
5.2.5 P&ID0005: Detention Tank and Discharge Manifold ... 103
5.3 Operating Procedure ... 103
5.3.1 Operating Procedure ... 103
5.3.2 Reactor heating at ambient pressure (TBED≤ 800oC) ... 105
5.3.3 REACTOR HEATING AT AMBIENT PRESSURE (800oC < TBED≤ 1000oC) .... 105
5.3.4 INCREASING THE PRESSURE ... 106
5.3.5 REACTOR SHUTDOWN ... 106
CHAPTER 6 CONCLUSION AND RECOMMENDATIONS ... 107
6.1 Conclusion ... 107
6.2 Recommendations ... 109
REFERENCES ... 110
LIST OF TABLES
Table 1- Applications of high temperature and pressure in industrial fluidized beds ... 10
Table 2- Applicability range of the bubble size correlations by Mori and Wen (1975), Horio and Nonaka (1987) and Cai et al (1994) ... 16
Table 3- Specifications of the experimental results of Yamazaki et al (1991) ... 17
Table 4- Specifications of the experimental results of Hoffmann and Yates (1985) ... 19
Table 5- Specifications of the experimental results of Sanaei et al (2012) ... 22
Table 6- Choi et al (1991) correlation for entrainment rate (applicable for a velocity range from 0.3 to 7m/s, a particle diameter range of 0.005 to 1mm and a reactor diameter for 0.06 to 1m) ... 28
Table 7- Drag Coefficient for different Reynolds numbers ... 29
Table 8-Validity range of the entrainment correlation by Choi et al. (1999) ... 29
Table 9-Specifications used in the simulation where the effect of the bubble size correlations by Mori and Wen (1975), Horio and Nonaka (1987) and Cai et al (1994) with respect to velocity at high temperature and pressure on the entrainment rate model by Choi et al (1999) ... 31
Table 10- TDH values based on the plot of the entrainment correlation of Choi et al (1999) ... 39
Table 11- Common TDH correlation as reported in the handbook of fluidization and fluid-particle systems[6] ... 40
Table 12- Comparison of the TDH values obtained using the entrainment model of Choi et al and the correlation of Sciazko et al ... 41
Table 13- Methane steam reforming reactions and kinetic models ... 51
Table 14- Kinetic parameters ... 52
Table 15- State Equations for the Dynamic Two- Phase Structure Model (DTP) ... 54
Table 17- Comparison of the predicted bubble size using the correlations by Mori and Wen (1975), Horio and Nonaka (1987) and Cai et al (1994) with the expected trends in the
literature at high temperature, pressure and velocity. ... 65
Table 18- Plenum Design Equations ... 69
Table 19- Natural gas combustion reactions and kinetic models ... 70
Table 20- Most common cyclone dimensions ... 79
Table 21- Circumferential and longitudinal stress equations ... 82
Table 22- Heat Flux Balance ... 83
Table 23- Methane combustion conversion with respect to pressure ... 89
Table 24- Stainless steel properties ... 92
Table 25- Cyclone simulation results ... 94
Table 26- Carbon steel properties ... 96
Table 27- Reactor wall and refractory thickness simulation results ... 96
LISTE OF FIGURES
Figure 1- Fluid Bed Sections ... 4
Figure 2- Transport Disengaging Height ... 5
Figure 3- Fluidization regimes ... 6
Figure 4- Geldart Particles ... 7
Figure 5- Gasification process ... 10
Figure 6-Comparison of the bubble size correlations by Mori and Wen (1975), Horio and Nonaka (1987) and Cai et al (1994) with the experimental values of Yamazaki et al (1991) with respect to velocity at ambient pressure and temperature. ... 18
Figure 7-Comparison of the bubble size correlations by Mori and Wen (1975), Horio and Nonaka (1987) and Cai et al (1994) with the experimental values of Hoffman and Yates (1985) with respect to pressure at ambient temperature and a gas velocity of 0.12m/s ... 20
Figure 8-Comparison of the bubble size correlations by Mori and Wen (1975) and Cai et al (1994) with the experimental values of Hoffman and Yates (1985) with respect to pressure at ambient temperature and a gas velocity of 0.12m/s ... 20
Figure 9- Comparison of the bubble size correlations by Mori and Wen (1975), Horio and Nonaka (1987) and Cai et al (1994) with the experimental values of Sanaei et al (2012) with respect to temperature at ambient pressure and a velocity of 0.38m/s ... 23
Figure 10- Bubble size vs temperature (adapted by Sanaei et al (2012)) at ambient pressure and a velocity of 0.38m/s ... 23
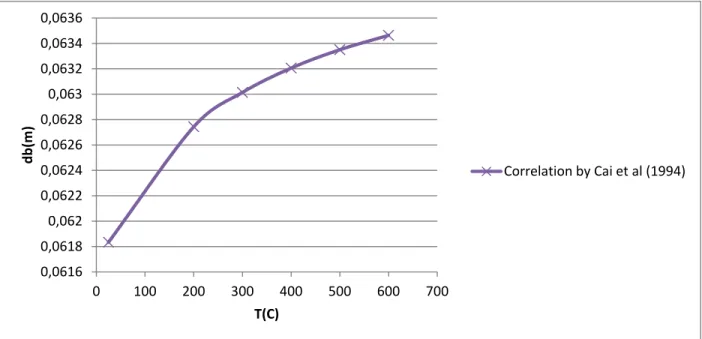
Figure 11- Bubble size vs temperature (according to the correlation by Cai et al (1994)) at ambient pressure and a velocity of 0.38m/s at ambient pressure and a velocity of 0.38m/s . 24 Figure 12- Bubble size vs temperature (according to the correlation by Mori and Wen (1975)) at ambient pressure and a velocity of 0.38m/s ... 24
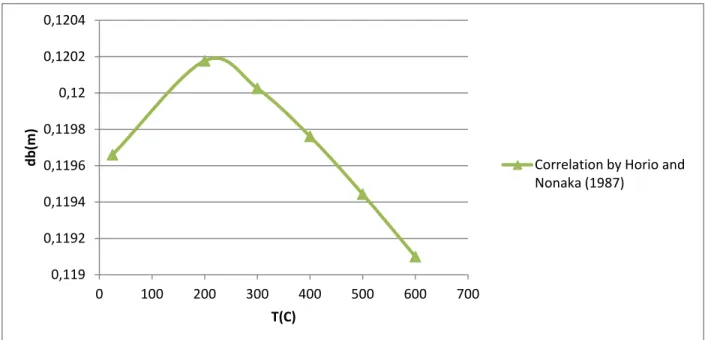
Figure 13- Bubble size vs temperature (according to the correlation by Horio and Nonaka (1987)) at ambient pressure and a velocity of 0.38m/s ... 25
Figure 14- Comparison of the entrainment rate with respect to height above the bed using the bubble size correlations by Mori and Wen (1975), Horio and Nonaka (1987) and Cai et al (1994) at ambient temperature and pressure and a superficial gas velocity of 0.3m/s ... 32 Figure 15- Comparison of the entrainment rate with respect to height above the bed using the
bubble size correlations by Mori and Wen (1975), Horio and Nonaka (1987) and Cai et al (1994) at ambient temperature and pressure and a superficial gas velocity of 1.3m/s ... 32 Figure 16- Comparison of the entrainment rate with respect to height above the bed using the
bubble size correlations by Mori and Wen (1975), Horio and Nonaka (1987) and Cai et al (1994) at ambient temperature, a pressure of 20atm and a superficial gas velocity of 0.3m/s ... 33 Figure 17- Comparison of the entrainment rate with respect to height above the bed using the
bubble size correlations by Mori and Wen (1975), Horio and Nonaka (1987) and Cai et al (1994) at ambient temperature, a pressure of 20atm and a superficial gas velocity of 1.3m/s ... 33 Figure 18- Comparison of the entrainment rate with respect to height above the bed using the
bubble size correlations by Mori and Wen (1975), Horio and Nonaka (1987) and Cai et al (1994) at ambient pressure, a temperature of 600°C and a superficial gas velocity of 0.3m/s ... 34 Figure 19- Comparison of the entrainment rate with respect to height above the bed using the
bubble size correlations by Mori and Wen (1975), Horio and Nonaka (1987) and Cai et al (1994) at ambient pressure, a temperature of 600°C and a superficial gas velocity of 1.3m/s ... 34 Figure 20- Comparison of the interchange mass transfer coefficient with respect to superficial
velocity using the bubble size correlations by Mori and Wen (1975) and Horio and Nonaka (1987) ... 45 Figure 21- Interchange mass transfer coefficient with respect to superficial velocity using the
Figure 22- Comparison of the interchange mass transfer coefficient with respect to pressure using the bubble size correlations by Mori and Wen (1975), Horio and Nonaka (1987) and Cai et al (1994) ... 47 Figure 23- Comparison of the interchange mass transfer coefficient with respect to temperature
using the bubble size correlations by Mori and Wen (1975), Horio and Nonaka (1987) and Cai et al (1994) ... 49 Figure 24- Comparison of the bubble size correlations by Mori and Wen (1975), Horio and
Nonaka (1987) and Cai et al (1994) with respect to pressure at U=0.07m/s and T=650C .... 56 Figure 25- Comparison of the methane conversion with respect to pressure using the bubble size
correlations by Mori and Wen (1975), Horio and Nonaka (1987) and Cai et al (1994) with the experimental values of Roy et al (1999) at U=0.07m/s and T=650C ... 56 Figure 26- Comparison of the bubble size correlations by Mori and Wen (1975), Horio and
Nonaka (1987) and Cai et al (1994) over a pressure range of (0.3 to 6MPa) at U=0.07m/s and T=650C ... 57 Figure 27- Comparison of the methane conversion over a pressure range of (0.3 to 6MPa) using
the bubble size correlations by Mori and Wen (1975), Horio and Nonaka (1987) and Cai et al (1994) at U=0.07m/s and T=650C ... 58 Figure 28- Comparison of the bubble size correlations by Mori and Wen (1975), Horio and
Nonaka (1987) and Cai et al (1994) over a pressure range of (0.3 to 6MPa) at U=1.3m/s and T=650C... 59 Figure 29- Comparison of the methane conversion over a pressure range of (0.3 to 6MPa) using
the bubble size correlations by Mori and Wen (1975), Horio and Nonaka (1987) and Cai et al (1994) at U=1.3m/s and T=650C ... 59 Figure 30- Comparison of the bubble size correlations by Mori and Wen (1975), Horio and
Nonaka (1987) and Cai et al (1994) with respect to temperature at U=0.07m/s and P=0.55MPa ... 61 Figure 31- Comparison of the bubble size correlations by Mori and Wen (1975), Horio and
Nonaka (1987) and Cai et al (1994) with the experimental values of Roy et al (1999) with respect to temperature at U=0.07m/s and P=0.55MPa ... 61
Figure 32- Comparison of the bubble size correlations by Mori and Wen (1975), Horio and Nonaka (1987) and Cai et al (1994) with respect to temperature at U=1.3m/s and
P=0.55MPa ... 62
Figure 33- Comparison of the bubble size correlations by Mori and Wen (1975), Horio and Nonaka (1987) and Cai et al (1994) with respect to temperature at U=1.3m/s and P=0.55MPa ... 63
Figure 34- Schematics of bubble cap distributor ... 74
Figure 35- Jet configurations ... 75
Figure 36- Cyclone and filter disposition in the freeboard ... 77
Figure 37- Typical cyclone configuration ... 78
Figure 38- Reactor Shell Modeling ... 82
Figure 39- Heating System schematics ... 84
Figure 40- Process Flow Diagram ... 88
Figure 41- Final bubble cap dimensions ... 91
Figure 42- Final cyclone dimensions ... 94
Figure 43- System pressure as a function of the required Amount of Cooling Water to reduce the gas temperature from 1000 to 250C ... 102
NOMENCLATURE
AFR Stoichiometric air-fuel ratio -
ai Decay constant -
Ar Archimedes number -
At Cross sectional area of the reactor m2
c Dust concentration g/ m3
CA Mean concentration of specie A kmol/m3
CAb Concentration of specie A in the bubble phase kmol/m3 CAe Concentration of specie A in the emulsion phase kmol/m3
CD Discharge coefficient -
Cd Drag coefficient -
Cph Plate design factor -
D Molecular diffusivity m2/s
db Average bubble size m
db0 Initial bubble diameter from Mori and Wen m db∞ Maximum bubble diameter from Mori and Wen m dbM Maximum bubble diameter from Horio and Nonaka m
Dcyc Diameter of cyclone body m
Dentry Diameter of the windbox gas inlet m
Dfb Diameter of the freeboard m
dflame Theoretical flame dimension m
dh Diameter of hole m
Dh Header diameter
dp Particle average diameter m
dp50 Cut size for which 50% of solids of a given size are collected m
dpi Diameter of a given particle i m
Dplenum Diameter of the windbox m
Dt Reactor diameter m
E Modulus of elasticity Pa
Ei0 Bed surface flux kg/(m2.s)
Ei∞ Elutriation flux kg/(m2.s)
Eu Euler number -
Euc Euler number from Shepherd and Lapple -
F∆P Force due to the pressure drop N
Fd Drag force per projection area Pa
Fd Froude number -
fp Maximum allowable design stress Pa
g Gravitational acceleration (9.8) m/s2
h Natural convection coefficient (W/m2.K)
Hb Bed Height M
Hcyc Height of cyclone inlet m
Hplenum Height of the windbox m
J Momentum of fuel jet N
K Distributor pressure drop coefficient -
k1 Reaction constant kmol/(kgcat·s·kPa0.25)
K1 Equilibrium constant kPa2
k2 Reaction constant kmol/(kgcat·s·kPa)
K2 Equilibrium constant kPa0
k3 Reaction constant kmol/(kgcat·s·kPa0.25)
K3 Equilibrium constant kPa2
kA Thermal conductivity of material A (W/m.K)
KBE Interphase mass exchange coefficient between bubble and emulsion
s-1
KCO Adsorption coefficient kPa–1
Kfouling Fouling factor -
KH2O Adsorption coefficient -
Ki∞ Elutriation rate of a particle of size i kg/(m2.s)
Lbcyc Length of cyclone cylindrical section m
Lccyc Length of cyclone conical section m
Ldown Downwardly directed gas jet length m
Lflame Flame length m
Lhor Horizontally directed gas jet length m
Lmf Minimum fluidization height m
Lup Upwardly directed gas jet length m
m Constant -
mgas Mass flowrate of the gas kg/s
N Number of holes -
n Constant -
P Pressure Pa
PA Partial pressure of component A kPa
Q Volumetric flowrate of gas m3/s
R Universal Gas constant (8.314) J/(mol.K)
r Reactor/plate radius m
Remf Reynolds number at minimum fluidization velocity -
Rep Particle Reynolds number -
ri Reaction rate of reaction i kmol/(m3.s)
Scyc Diameter of cyclone vortex m
Stk50 Stokes number -
T Temperature K
T∞ Ambient air temperature K
TDH Transport disengaging height m
tp Plate minimum thickness m
tshell Outer reactor wall metal shell thickness m
Tw Temperature at the reactor outer wall K
U Superficial gas velocity m/s
Ub Bubbling velocity m/s
Ue Emulsion Velocity m/s
Ufuel Velocity of the fuel m/s
Uh Gas velocity through the grid hole m/s
Umf Minimum fluidization velocity m/s
W Force due to weight of the solids on the distributor N
xi Mass fraction of particles of component i in the fluidized bed -
z Axial height above the distributor plate m
Zf Shvab-Zek’dovich variable -
GREEK SYMBOLS
α Parameter in methane oxidation reaction -
δ Bubble fraction -
ΔPb Pressure drop across the bed Pa
ΔPcyc Pressure drop across the cyclone Pa
ΔPd Pressure drop across the distributor Pa
ε Average bed voidage -
ε b Average bubble voidage -
ε e Average emulsion voidage -
ε mf Minimum fluidization voidage -
η Total collection efficiency -
ηi Collection efficiency of a particle size i -
λ Ligament efficiency -
μ Gas viscosity kg/(m.s)
ν Poisson’s ratio -
ρfp Density of the flame product kg/m3
ρg Density of gas kg/m3
ρp Density of particles kg/m3
σ Yield strength Pa
LIST OF APPENDICES
Appendix1: Reactor, Cyclone and Distributor Schematics ... 119 Appendix2: Heating System Schematic ... 120 Appendix 3: Piping and Instrumentation Diagrams ... 121 Appendix 4: Process Tables ... 127 Appendix 5: Equipment List ... 140 Appendix 6: Distributor Pressure Drop ... 141
CHAPTER 1
INTRODUCTION
1.1 Problem Statement and Motivation
In the mining and petro chemical industries, numerous conversion processes involve the use of catalysts, and are realized in fluidized bed reactors[1, 2] because of their many advantages, such as good solid mixing and good temperature control[3].
Despite being considered today as an ideal solution for many industrial applications[1], gas-solid fluidized bed reactors can vary significantly depending on the nature of the gas, the solids, and the operating conditions, which can lead to different hydrodynamic behaviours and therefore requires the use of very different flow models[2].
With feedstocks changing rapidly in the fuel and power fields due to the shortage of conventional resources; new sources, such as biomass, coal, and petcoke are emerging as future industrial solutions. However, their diversity and complex nature requires the use of extreme conditions during their handling and processing in fluidized bed reactors. In fact, most industrial gas–solid fluidized bed reactors operate at temperatures well above ambient, and some also operate at elevated pressures (pressured gasification, production of polyolefins…etc)[4]. While most design correlation are developed at ambient conditions, the effect of high temperature and high pressure have been found to cause modifications in the structure and dynamics of fluidized beds which are overlooked when only the gas properties in the equations are altered. In order to develop more appropriate hydrodynamic models, designing a bench scale fluidized bed reactor that would operate at high temperature and/or high pressure is indispensable to compensate for the lack of experimental results that exists today.
In fact, only a few laboratory scale fluidized bed reactors have been recorded to run at extreme conditions, with most of them operating at high temperature or high pressure.
Designing a reactor that operates at high temperature and high pressure is therefore of great bearing as it will contribute to the understanding of fundamental fluidization phenomena at extreme conditions by illustrating the effects of both temperature and pressure on hydrodynamics. Improvements in this field will not only have a significant impact on investments and revenues generated in the oil, petrochemical, and energy businesses; but it will also give invaluable insight on the design of fluidized bed reactors when more extreme conditions are present.
1.2 Objectives
The purpose of this thesis is to review and compare the already published models on fluidization at ambient and extreme conditions with emphasis on the information necessary for designing gas-solid reactors. Consequently, a detailed design of a fluidized bed that would allow flexible operation at high temperature and high pressure at several gas velocities will be conducted in order to serve for the future development of new hydrodynamic models. In order to accomplish this feat, the following objectives will be completed:
1- Study and Conduct a background study on fluidized bed technology and its application in industry as well as the different fluidization regimes.
2- Study and Conduct a full literature review on fluidization in order to illustrate the fundamental design variables, their respective correlations at extreme conditions and their limitations.
3- Design the fluidized bed reactor and its utilities, for flexible operation from ambient conditions up to high temperature and high pressure based on design books and papers. 4- Design a complete control process and operating procedure that would allow safe
operation of this reactor.
The following chapters present the accomplishment of these objectives. At first, chapter 2 is a full literature review where the principles of fluidization and fluidized beds will be presented along with their applications. In Chapter 3, the influence of the use of extreme conditions on, bubble size, entrainment and mass transfer will be discussed. Furthermore, the impact of temperature and pressure on reaction conversion using a dynamic two-phase hydrodynamic model (DTP) will also be presented in this section. Chapter 4 is a detailed design the bench scale fluidized bed that would operate from ambient to high temperature (1000°C) and high pressure (20atm) at several gas velocities (from 0.1 to 2m/s) in order to serve for the future development of new hydrodynamic models. Chapter 5 presents the process used for the operation of the fluidized bed reactor and its utilities. Finally, in Chapter 6 the conclusion of this work as well as recommendations for future studies will be discussed. All references used can be found at the end of Chapter 6.
CHAPTER 2
LITTERATURE REVIEW
2.1 Fluidized Bed Principles
As the name would suggest, fluidized bed reactors use the principles of fluidization where gas is passed through a distributor on which granular solid materials lie (usually a catalyst) at high enough velocities to suspend the solid and cause it to behave like a fluid by subjecting it to pressure gradients. These properties result in many advantages, among which uniform particle distribution, gas solid contact and intense mixing, high conversion per unit mass of catalyst, uniform temperature gradient and continuous state operation.[5]
Before proceeding any further, it is of the upmost importance to define the different parts of a fluidized bed reactor. At the beginning, gas is passed through a grid, also known as a gas distributor, which provides stable and even fluidization across the reactor’s cross-section by creating a pressure drop. A plenum chamber is usually placed under the grid in order to pre-distribute the gas uniformly before it flows through the distributor. The solids placed above the grid constitute the bed whose level, also known as the bed height, may vary based on the operating conditions of the reactor; such as gas velocity, gas properties and solid properties. The vertical space above the bed height which takes the larger volume of the whole unit is referred to by the freeboard and has the main task of preventing large amounts of the bed material from being carried out of the reactor by the gas stream.
A solid collection device such as a cyclone or filters is usually placed inside the freeboard in order to return entrained material to the bed[5]. These different sections are illustrated in Figure 1 below.
When gas flows through the bed, two distinct parts can be observed; the bubble phase and the emulsion phase. Voids, also referred to as bubbles, constitute the bubble phase and are created as a result of gas flowing through the bed. As gas velocity is increased these bubbles often lose their shape as they move upward to burst at the bed surface which induces particle ejection into the freeboard. The emulsion phase refers to the solid rich part of the bed. As particles are injected into the freeboard, their concentration will decay with height, as some will fall back into the bed, before becoming constant. The distance between the point where solids’ concentration becomes
constant and the surface of the fluidized bed is referred to as the Transport Disengaging Height (TDH) [6] and is illustrated in Figure 2.
Figure 1- Fluid Bed Sections
As far as the designing of fluidized beds is concerned, the freeboard must be dimensioned to have a height of at least the TDH in order to reduce carryovers with any further height increase having little impact on entrainment. This can prove itself to be a hard task when dealing with high temperature and pressure as the determination of TDH tend to be more difficult.
In the literature, two distinct TDH values have been reported depending on the type of used particles: coarse or fine. Due to their terminal velocity being larger than the superficial gas velocity, coarse particles are ejected out of the bed by the bursting bubbles before falling back. The height they reach is referred to as the splash height or TDH(C). Fines on the other hand, have terminal velocities smaller than the gas and therefore reach more important heights which are referred to as TDH(F). In most design applications TDH(F) is simply referred to as TDH due to its higher value, and therefore this terminology will be used throughout this work.
Several research papers have been dedicated to the study and prediction of the transport disengaging height based on different influencing parameters such as the superficial gas velocity, bubble and column diameter, and solids and gas properties. Tannous et al (2008) [7] cited that the relationships to predict the TDH can be observed clearly in an extensive review outlined in three categories: graphical correlations, semi-empirical models, and empirical correlations[8-10].
Figure 2- Transport Disengaging Height
2.2 Fluidization Regimes
Fluidization behaviour may differ based on the operating conditions of the reactor; such as gas velocity and gas and solid properties. Upon these observations, researchers have long established the existence of different fluidization regimes which are illustrated in Figure 3.
The state of fluidization begins at the minimum fluidization velocity Umf. As the gas flow across the bed is increased, there exists a velocity known as the minimum fluidization velocity, Umf, at which the resulting pressure drop is high enough to lift and suspend the solids by balancing the weight of the bed.
When the gas flow is further increased, the bubbling regime is reached. This regime starts when a minimum bubbling velocity, Umb, is reached, where bubbles appear and a distinction between the
bubble and emulsion phase can be established. As these bubbles move upward in the bed, they tend to burst at the bed surface; ejecting particles into the freeboard.
The turbulent regime is reached when the terminal velocity of the ejected particles, UC, is surpassed by the gas and the bed material no longer falls back as it is entrained out of the reactor. A solid particle collection device such as a cyclone or filters is usually placed at a high enough height to ensure particles recirculation and avoid depletion of the bed as the velocity is increased. Under these conditions, despite bubbles often losing their shape, beds with recognizable surfaces are referred to as turbulent fluidized beds.
The fast fluidization regime is characterized by the dominance of the gas phase as the bed level disappears due to a further increase in gas velocity. The transition velocity from the turbulent to the fast fluidization regime is referred to as the transport velocity, Utr, with reactors operating under these conditions known as fast fluidization fluidized bed reactors. Finally the pneumatic transport is reached when all of the bed is depleted.
Depending on the desired product or the wanted effect, fluidized bed reactors can be operated in any of the aforementioned regimes. For instance, due to many distinct advantages, turbulent fluidized bed reactors are sometimes preferred to both bubbling and fast fluidization reactors because of their dynamic gas-solids contacting, high solids holdup, high exchange rate of the gas between the void and the emulsion phases, and relative spatial uniformity in flow properties. Industrial examples include Fischer-Tropsch synthesis, acrylonitrile production and FCC regeneration.
2.3 Effects of Particle Size and Density
The behaviour of fluidized solids have been divided into four groups by Geldart (1973) based on the difference in density between the fluidizing gas and the used particles, (ρp-ρg) and by the mean particle size dp as illustrated on Figure 4.
Geldart C Particles: This group is characterized by cohesive or very fine particles (usually less
than 20 microns). Due to their large surface area combined with low mass, interparticle forces tend to be greater than those resulting from the action of the gas which in turns renders fluidization extremely difficult. As a result, particles fail to flow in a manner that produces bubbles and the bed is unable to expend.
Geldart A Particles: In this group, particles are characterized as aeratable with a small mean
particle size or/and low particle density. In fact, manufactured catalysts often belong to this group with particle sizes ranging from 20 to 100 microns. Due to the slightly cohesive structure of these particles, gas velocity must be increased beyond Umf in order for bubbles to occur.
Geldart B Particles: These particles are characterized by being like sand with a mean particle
diameter of about 150 microns. Due to the non cohesiveness of these particles, bubbles appear as soon as fluidization starts (ie Umf=Umb) shifting the bed’s behaviour to the bubbling regime.
Geldart D Particles: These are large and/or dense particles in the order of 1 or more millimetres.
When velocity is increased, a jet is formed in the bed creating a spouting motion.
2.4 Solid Mixing and Entrainment
In most fluidized bed applications, the freeboard occupies the largest volume of the reactor and thus particular care must be taken when designing it. As the freeboard has the main task of preventing large amounts of the bed material from being carried out of the reactor by the gas stream, understanding solid entrainment above the bed (the flux of solids carried out of the fluidized bed by the gas) is fundamental in the sizing of this section. Furthermore, understanding the influence of the freeboard diameter, particle properties and operating conditions can play a fundamental role in the design of the solid separation unit that will be installed.
While there is a general agreement on the importance of bubbles in the projection of particle from the bed into the freeboard[11], the exact mechanism behind this phenomena remains an area of dispute.
After ejection of the particles into the freeboard, their velocity will gradually decelerate which would lead to one of two scenarios: the solids will either be entrained out of the reactor or will fall back into the bed.
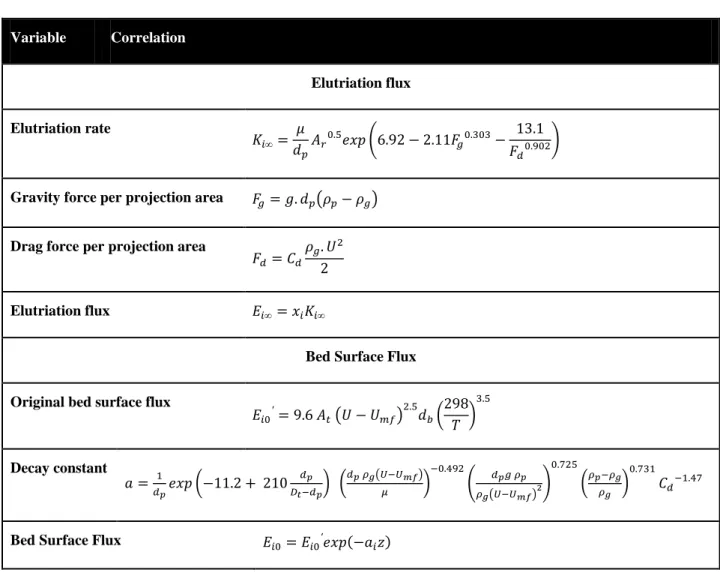
The most generally used model to predict the entrainment rate was created by Large et al (1976) [12]. According to Large et al, modelling of the entrainment flux, for a given particle size i, consists of the addition of two fluxes. The first flux involved in the modelling of the total entrainment according to Large et al is that of the continuously flowing solids from the bed surface to the outlet of the reactor, also known as the elutriation flux.
The second flux involved in the modelling of the total entrainment according to Large et al is that of the solids which tend to fall back into the bed.
Furthermore, Large et al reported that the bed surface flux decreases exponentially with increasing height above the bed surface. Despite agreement between researchers on the format of the model of Large et al, developing suitable correlations to predict both the elutriation flux and the bed surface flux remains an area of dispute due to the influence of pressure and temperature on entrainment as will be presented in Chapter 3.
2.5 Application of High Temperature and Pressure
Since 1922 when fluidization was first introduced in a coal gasification process, the use of fluidized beds have significantly increased over a wide spectrum of applications due to their many advantages such as good solid mixing, high heat and mass transfer and good temperature control[13]. Despite these advantages, fewer fluidized beds are being operated today under ambient conditions due the competitive nature of the market as well as the constant need of developing more efficient solutions, which has lead to a wide interest in high temperature and pressure operation. In fact, operation under extreme conditions has been proven to be of fundamental importance in different industrial cases. For instance, in the fuel and power fields, the diversity and complex nature of new sources, such as biomass, coal, and petcoke require the use of extreme conditions during their handling and processing in fluidized bed reactors. Another good example where high temperature and pressure are used can be found in the mining industry. With the nature of ore becoming more complex and harder to refine due to the presence of carbonaceous matters or sulfides that renders gold extraction more difficult, significant pre-treatment is required to achieve feasible extraction processes. A key component to eliminate carbonaceous maters in the pre-treatment process is oxidation at high temperature and pressure. Furthermore, roasting, which is used to induce a reaction and the expelling of volatile matter without causing fusion, is commonly done in fluidized bed reactors operating at high temperature and pressure.
The use of extreme conditions can also result in higher revenues. A good testament of that is pressurized gasification.
In gasification, when pressure is increased, the material and mechanical problems associated with the gasifier are also increased not to mention that most of the combustion reactions are favored at low pressure. By looking at these restrictions, it is difficult to understand why high pressure is used or how it can generate higher revenues. In fact, when pressure is increased, one of its effects is the reduction in the required volumes which represent 30 to 40% of the fixed capital investment[14]. Moreover, an increase in pressure also results in a faster reaction rate which in turns further reduces the required equipment sizes. Another benefit of using pressurized gasification is the elimination of the costly compression steps downstream of the combustion/pyrolysis step as illustrated in Figure 5. CO2 emissions from coal-burning power
plants have also been reported to drop when pressurized fluidized bed boilers are used since they use less fuel to produce the same amount of power.
Brown et al (1979)[15] conducted a comparative study between a high pressure and a low pressure process where ammonia is produced from coal and a high pressure and a low pressure process for the production of methanol. They concluded that the high pressure processes resulted in an increase in coal consumption not to mention a reduction in compressor power consumptions, and much more compact gas cleaning equipment.
Figure 5- Gasification process
Many other examples, where extreme conditions are used, exist today in industry; some of which are illustrated in table 1 below.
Table 1- Applications of high temperature and pressure in industrial fluidized beds
Process Pressure range (atm) Temperature range (C)
Fischer–Tropsch [16, 17] 18-30 300-350
Ammonia synthesis [17, 18] 20-100 300-600
Methanol synthesis [17, 19] 40-100 220-280
PFBC Combined Cycle for coal combustion [17, 20]
10-16 600-1300
CHAPTER 3
INFLUENCE OF USING EXTREME OPERATING
CONDITIONS ON FLUIDIZED BED REACTORS
When dealing with gas-solid fluidized bed reactors at elevated temperatures and pressures, it is important to understand the influence of operating under extreme conditions in order to be able to improve upon what exists today; whether it be attaining rapid rates of chemical reaction (e.g. gasification of coal, combustion of solid fuels and fuel additives, reduction of mineral ores, synthesis of industrially useful chemicals via surface catalysis), or controlling or suppressing the resulting reactions (corrosion, gasification, or embrittlement of structural components or containment materials). Several papers and articles have been dedicated to study the effect of elevated temperature and pressure on the performance of fluidized bed reactors. In fact, operating under extreme conditions has been reported to alter fluidization behaviour and bubble size with the latter considered as one of, if not the most important variable related to reactor performance.
The purpose of the following section as the title would suggest, is to demonstrate the effect of using extreme operating conditions (high temperature, pressure and velocity) on fluidization and more specifically bubble size. Subsequently, the impact of bubble size on mass transfer, reaction conversion and the transport disengaging height (TDH) will be studied. By doing so, the aim of this section is to illustrate the limitations of some of the most common correlations found in the literature, and to demonstrate the need of developing new models at high temperature, pressure and velocity.
In section 3.1, some of the reported trends of the influence of high pressure and temperature on fluidization will be presented. In section 3.2, some of the different findings and correlations developed to estimate bubble size will be presented along with the influence of temperature, pressure and velocity on three different correlations. This section will be followed by a study of entrainment under extreme conditions and more specifically the different existing correlations to predict the transport disengaging height in section 3.3. Section 3.4 will then present a review on mass transfer in fluidized bed reactors. Finally, the methane steam reforming reaction, which was chosen for this study, will be presented in section 3.5 along with its kinetics. A detailed study using the same three bubble size correlations will then be conducted in order to illustrate the
influence of temperature, pressure and velocity on conversion. Finally, the conclusions of this chapter will be listed in section 3.6.
3.1 Influence of extreme conditions on fluidization
In process engineering, the effects of temperature and pressure have long interested researchers for many different reasons: whether it is to attain rapid rates of chemical reactions (e.g. gasification of coal, combustion of solid fuels and fuel additives, reduction of mineral ores, synthesis of industrially useful chemicals via surface catalysis), or to control or suppress the resulting reactions (corrosion, gasification, or embrittlement of structural components or containment materials), the ability to improve upon what exists is dependent upon understanding the effects related to the operating conditions[22]. Henceforth, when dealing with gas-solid fluidized bed reactors at elevated temperatures and pressures, understanding the influence of operating under these conditions on fluidization is fundamental. In fact, many research papers have been dedicated to studying the effects of pressure and temperature individually on fluidized beds.
For instance, an increase in pressure in a gaseous reaction has been reported to increase the number of collisions between reactants which in turns influences the rate constant that may change the rate of reaction and can therefore be used to improve selectivity. Pressure has also been found to have a major influence when gas-solid reactions with porous catalysts are involved, as it can alter the gas film resistance at the surface of the catalyst which in turns affects the diffusion of the reactants through the pores. The aforementioned effects have long intrigued researchers as to their influence on fluidization. For instance, at elevated pressures, many researchers concluded that fluidized bed reactors can be characterized by smaller bubbles [23, 24], a higher heat transfer rate[25], and a decrease in particle segregation[26]. Interestingly, Li et al. (2002) observed a wider range of particulate flow regime at higher pressures[4]. Lie et al. also reported a stronger effect of pressure on a bed of Geldart A particles than that of Geldart B and D[27]. Notable effects were also observed on flow patterns when subjected to high pressure. Lie et al. noted a more homogeneous structure near the turbulent regime and reported that under these conditions, the particle–fluid interactions intensified while the particle-particle interactions were suppressed allowing the gas–solid flow structure to form a more homogeneous flow. Moreover,
they also concluded that the extension in the uniform fluidization regime led to a shortening in the width of the bubbling regime[4].
Industrially, with most gas-solid fluidized beds operating within the temperature range of ambient to 1100oC, the effect of temperature has also received great interest from researchers who studied the influence it presents on different fluidization parameters, such as mean velocities and diffusivity of particles, by affecting gas density and viscosity. In fact, variations of these two parameters were until recently believed to be the only variables that determine the effect of temperature on gas-solid systems. Today however, it is believed that changes in density and viscosity of the gas are not sufficient to account for the observed deviation from classical models at high temperature [28-30]. These observations include changes in the bed’s behaviour as well as in the physical properties of the particles [28, 29]. In fact, Cui et al. (2003) have observed that for FCC particles, the bed behaviour would shift significantly from Geldart A towards Geldart B [29] while Lettieri et al. (2000) showed how interparticle forces at high temperature can cause the transition of the fluidization behavior from Geldart A to Geldart C [31]. Sanaei et al. (2010) [32]explained how temperature affected emulsion surface tension which led to an increase in solid mixing and particle diffusivity when the temperature was increased from ambient to around 300◦C, followed by a decrease beyond that temperature.
3.2 Bubble size under extreme conditions
Bubble size has been reported to be one of, if not the most important variable related to reactor performance. It has been proven to control the most fundamental fluidization parameters such as bubble rising velocity, gas interchange rate between phases, particle circulation rate, heat transfer, and elutriation of fine particles from the bed surface[33]. Therefore it is of the upmost importance to be able to model and understand the impact that operation under extreme conditions has on bubble size. In the literature, many papers and articles have been dedicated to the study of bubbling behaviour with some reporting the observed trends at high temperature, pressure and velocity.
High pressure has been reported to yield smaller maximum stable bubble size and reduced bubble frequency[34]. In fact, Varadi et al (1978) [35] explained that an increase in pressure induces a decrease in the apparent viscosity of the emulsion phase which in turns causes bubble splitting by division from the roof and therefore a reduction in bubble size. Interestingly, Varadi et al (1978)
[35], Row et al (1984) [36], and Cai et al (1989) [37] reported that at low gas velocities, a slight increase in bubble size can be observed in the lower pressure range (less or much less than 10 bar) followed by a decrease in the upper pressure range. With velocity clearly affecting bubble size, several sources reported its effects to differ based on the operating flow regime. Bubble size was found to increase with velocity under the bubbling regime,[38, 39] and decrease with velocity under the turbulent regime [37, 40].
With the effects of pressure and velocity agreed upon between most researchers, the effects of temperature have yielded more debates.
While some such as Tone et al. (1974) [41], Geldart and Kapoor (1976) [42], and Zhang et al. (1982) [43] reported that bubble diameter decreases with increasing temperature, others such as Chan and Knowlton (1987) [23] reported that bubble size is independent of temperature.
Sanaei et al (2012)[44], evaluated bubble diameters at high temperature and observed that bubbles can grow up to a maximum diameter by increasing the temperature up to 300 ºC after which the diameter of the bubbles is decreased. They explained this observation by the effect of interparticle forces on bubble size. In fact, at temperatures below 300 an increase in the gas viscosity is dominant in comparison with gas density decrease whereas at higher temperatures the decrease in gas density is more effective. As a result, the drag force decreases after increasing initially, therefore explaining how a first increase in temperature facilitates bubble growth while further increase leads to a decrease in bubble diameter.
With these bubble size trends reported with respect to temperature, pressure and gas velocity, it is important to have a model where these observations are manifested.
Several bubble diameter correlations have been proposed in the literature with unfortunately most providing inconsistent results when high temperature, pressure and velocity are applied [33, 45]. Gogolek and Grace (1995) [46] presented an overview of different correlations to find the average bubble size at high pressure. They wrote that a reliable correlation to estimate the mean bubble size, db was proposed by Mori and Wen (1975) [47] for Geldart A and B powders where db is a function of the initial and maximum bubble size. Furthermore, this correlation has been cited in various design and fluidization books and can be considered as one of the most commonly used models to predict bubble size [1, 9, 48]:
𝑑𝑏(𝑧) = (𝑑𝑏∞− 𝑑𝑏0)𝑒𝑥𝑝 �−0.3𝑧𝐷 𝑡 �
Where, both the initial and maximum bubble diameters db0 and db∞ can be predicted using the following correlations:
𝑑𝑏∞= 0.941�𝜋𝐷𝑡2�𝑈 − 𝑈𝑚𝑓��0.4
𝑑𝑏0 = 0.872�𝐴𝑡�𝑈 − 𝑈𝑚𝑓��0.4
Cai et al (1994) [45] presented a good revue on some of the existing correlations that take into account the effects of pressure and velocity on bubble size and emphasized on the contradictory results that they offered due to several experimental factors.
In fact, Cai et al [45] observed that almost all the currently available bubble size correlations predict a monotonic increase in bubble size with gas velocity and pressure. In order to have the same trends as those observed by other researches with respect to bubble size, Cai et al developed their own correlation based on different experimental results with a wide range of velocities, pressures and particle diameters.
𝑑𝑏= 0.38𝑧0.8𝑃0.06�𝑈 − 𝑈𝑚𝑓�0.42𝑒𝑥𝑝 �−1.4. 10−4𝑃2− 0.25�𝑈 − 𝑈𝑚𝑓�2− 0.1𝑃�𝑈 − 𝑈𝑚𝑓�� Cai’s correlation however was not modelled to take into account temperature due to what they considered uncertainties with respect to its effects.
Horio and Nonaka (1987) [33] developed their own bubble diameter correlation for Geldart A and B powders that takes into account the effects of temperature based on the observations of Tone et al (1974) [41]. 𝑑𝑏 =𝐷𝑡[−𝛾𝑀+ (𝛾𝑀 2 + 4𝑑 𝑏𝑀/𝐷𝑡)0.5]2 4 Where
𝑑𝑏𝑀 = 2.59𝑔−0.2��𝑈0− 𝑈𝑚𝑓�𝐴𝑡�0.4
𝛾𝑀 = 2.56 × 10⁻²(𝐷𝑡/𝑔) 0.5 𝑈𝑚𝑓
In all of the aforementioned correlations, Umf can be calculated by the correlation developed by Wen and Yu [49]. Their equation relates the particle Reynolds number at minimum fluidization velocity, Remf, to the Archimedes number, Ar.
Remf = 𝑑𝑝. 𝑈𝜇𝑚𝑓. 𝜌𝑔 = (1135.7 + 0.0408Ar)0.5− 33.7
Where
𝐴𝑟 = 𝑑𝑝3𝜌𝑔�𝜌𝑝− 𝜌𝑔�𝑔/𝜇2
In order to verify the efficiency of the aforementioned models with regards to extreme operating conditions, each correlation was plotted in the following sections and compared to experimental results from different sources. The applicability range of these correlations can be found in table 2 below.
Table 2- Applicability range of the bubble size correlations by Mori and Wen (1975), Horio and Nonaka (1987) and Cai et al (1994)
Correlation Dt (m) T (C) U-Umf (m/s) P (atm)
Mori and Wen (1975) 0.3-1.3 25 0.008-0.5 1
Horio and Nonaka (1987) 0.079-1.3 30-650 0.008-0.5 1
3.2.1 Effect of velocity on bubble size
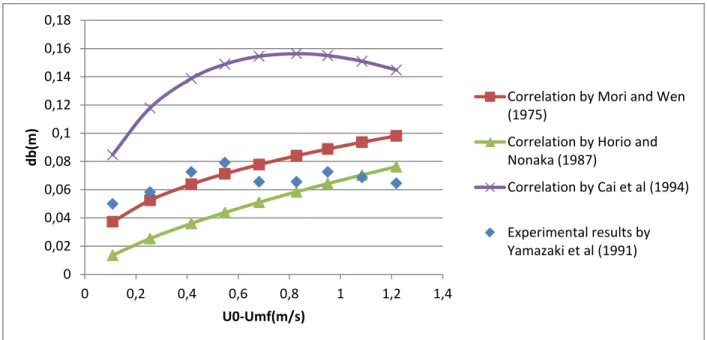
In order to evaluate the efficiency of the chosen correlations with respect to velocity, they were plotted in Figure 6 and compared to the experimental values of Yamazaki et al (1991)[50] whose specifications are listed in table 3 below.
Table 3- Specifications of the experimental results of Yamazaki et al (1991)
Parameter Value Dt (m) 0.2 H (m) 0.5 dp (μm) 64 ρp (kg/m3) 850 P(atm) 1 T(C) 25 U(m/s) 0.45-1.1
Experimental method Optical fiber probe
Figure 6-Comparison of the bubble size correlations by Mori and Wen (1975), Horio and Nonaka (1987) and Cai et al (1994) with the experimental values of Yamazaki et al (1991) with respect to velocity at ambient pressure and temperature.
In Figure 6, the effects of velocity on bubble size can be divided on two regions: low velocity (0.1-0.6m/s) and high velocity (>0.6m/s).
At low velocities, all three correlations predict an increase in bubble size with the model by Cai et al overestimating bubble diameter by up to twice the experimental value. At these velocities, the correlation by Mori and Wen provides the best results with a percentage error ranging between 7 and 20%. The percentage error from Horio and Nonaka is between 45 and 80%.
As velocity is increased however, Yamazaki et al show experimentally that bubble size starts to decrease. This trend is in fact consistent with the observations of Rowe et al [38], Weimer et al [39] and Sellakumar and V. Zakkay [40] who reported that the effects of velocity on bubble size differ based on the operating flow regime where the bubble diameter increases in the bubbling regime and decreases in the turbulent regime. This decrease is inconsistent with the correlation of Mori and Wen and that of Horio and Nonaka which predict an increase in bubble size over the whole velocity range.
0 0,02 0,04 0,06 0,08 0,1 0,12 0,14 0,16 0,18 0 0,2 0,4 0,6 0,8 1 1,2 1,4 db( m ) U0-Umf(m/s)
Correlation by Mori and Wen (1975)
Correlation by Horio and Nonaka (1987)
Correlation by Cai et al (1994) Experimental results by Yamazaki et al (1991)
This decrease in bubble size can be observed by the correlation of Cai et al at a higher velocity of 0.8m/s. The obtained results from this model, albeit offering the same trend as the experimental findings, still presented a very large percent error ranging from 50 to 57%.
3.2.2 Effect of pressure on bubble size
In order to assess the ability of each model to efficiently predict bubble size with respect to the applied pressure, each correlation was plotted in Figures 7 and 8 and compared to the experimental values of Hoffmann and Yates (1985)[51] whose specifications are listed in table 4 below.
Table 4- Specifications of the experimental results of Hoffmann and Yates (1985)
Parameter Value Dt (m) 0.17 H (m) 0.4 dp (μm) 45 ρp (kg/m3) 1417 U(m/s) 0.12 T(C) 25 P(atm) 1-81
Experimental method X-rays imaging
Figure 7-Comparison of the bubble size correlations by Mori and Wen (1975), Horio and Nonaka (1987) and Cai et al (1994) with the experimental values of Hoffman and Yates (1985) with respect to pressure at ambient temperature and a gas velocity of 0.12m/s
Figure 8-Comparison of the bubble size correlations by Mori and Wen (1975) and Cai et al (1994) with the experimental values of Hoffman and Yates (1985) with respect to pressure at ambient temperature and a gas velocity of 0.12m/s
0 0,02 0,04 0,06 0,08 0,1 0,12 0,14 0 10 20 30 40 50 60 70 db( m ) P(atm)
Correlation by Mori and Wen (1975)
Correlation by Horio and Nonaka (1987)
Correlation by Cai et al (1994) Experimental results by Hoffmann and Yates (1985)
0 0,01 0,02 0,03 0,04 0,05 0,06 0 10 20 30 40 50 60 70 db( m ) P(atm)
Correlation by Mori and Wen (1975)
Correlation by Cai et al (1994) Experimental results by Hoffmann and Yates (1985)
At first glance, it is clear that the correlation by Horio and Nonaka greatly overestimates bubble size when compared to the experimental values of Hoffman and Yates by more than 300%. In Figure 8, only the correlation by Mori and Wen and that of Cai et al have been plotted with the experimental values of Hoffman and Yates. The effects of pressure on bubble size can be divided into two regions: form 1 to 17atm and from 17 to 70atm.
In the first region, both correlations predict an increase in bubble size with the model by Mori and Wen providing a larger percent error ranging from 36 to 43% compared to 15 to 30% for the model by Cai et al.
When pressure is increased further, Hoffman and Yates showed that bubble size decreases. This trend has been reported by many researchers [37, 51, 52], among which Cai et al, who reported that at constant temperature and velocity, bubble size decreases with increasing pressure in both the bubbling and turbulent regimes except at very low gas velocities.
This decrease is inconsistent with the correlation of Mori and Wen and that of Horio and Nonaka which predict an increase in bubble size over the whole pressure range. Furthermore, as pressure is raised, the percent error of the obtained results from the correlation of Cai et al decreases to 10% despite yielding initially much higher percentages (30% at 17atm).
3.2.3 Effect of temperature on bubble size
In order to evaluate the influence of temperature on bubble size, the chosen correlations were plotted in Figures 9 to 13 and compared to the experimental values of Sanaei et al (2012)[44] whose specifications can be found in table 5.


![Table 11- Common TDH correlation as reported in the handbook of fluidization and fluid-particle systems[6]](https://thumb-eu.123doks.com/thumbv2/123doknet/2322265.29342/68.918.103.818.159.719/table-common-correlation-reported-handbook-fluidization-particle-systems.webp)