HAL Id: tel-01127451
https://tel.archives-ouvertes.fr/tel-01127451
Submitted on 7 Mar 2015HAL is a multi-disciplinary open access
archive for the deposit and dissemination of sci-entific research documents, whether they are pub-lished or not. The documents may come from teaching and research institutions in France or abroad, or from public or private research centers.
L’archive ouverte pluridisciplinaire HAL, est destinée au dépôt et à la diffusion de documents scientifiques de niveau recherche, publiés ou non, émanant des établissements d’enseignement et de recherche français ou étrangers, des laboratoires publics ou privés.
Genetic determinants of cardiovascular disease :
heritability and genetic risk score
Elias Levy Itshak Salfati
To cite this version:
Elias Levy Itshak Salfati. Genetic determinants of cardiovascular disease : heritability and genetic risk score. Cardiology and cardiovascular system. Université René Descartes - Paris V, 2014. English. �NNT : 2014PA05S014�. �tel-01127451�
THESE de DOCTORAT DE
L’UNIVERSITE PARIS DESCARTES
Spécialité
Pathologies Cardio-vasculaire Ecole doctorale 273 Biologie et biotechnologie (B2T)
Présentée par
Elias Levy Itshak Salfati
Pour obtenir le grade deDocteur de L’UNIVERSITE PARIS DESCARTES
Genetic Determinants of Cardiovascular Disease:
Heritability and Genetic Risk Score
Devant le jury composé de:
Dr. Bernard Lévy Directeur de Thèse
Dr. François Cambien Rapporteur
Pr. Jean-Yves Boëlle Rapporteur
Dr. Emmanuel Messas Examinateur
Pr. Joël Ménard Examinateur
ABSTRACT
Complex diseases such as cardiovascular disease (CVD) are influenced by both genetic and environmental factors. Estimation of an individual’s cardiovascular risk usually involves measurement of risk factors correlated with risk of CVD (e.g. age, sex, smoking, blood pressure, and total cholesterol). Lately, several biomarkers have been evaluated for their ability to improve prediction of cardiovascular disease beyond traditional risk factors. The interest in novel loci is propelled notably by emerging discoveries from the advent of genome-wide association studies (GWAS) of genetic variants associated with risk for common diseases. GWAS has greatly enhanced our knowledge of the genetic architecture of cardiovascular disease, yielding over 50 variants confirmed to be associated with CVD to date, as well as over 200 associated with traditional cardiovascular risk factors (e.g. lipids, blood pressure, body mass index, and type 2 diabetes mellitus). This recent and continuing success in discovering increasing numbers of robustly associated genetic markers has led to reassessment of whether genetic data can provide clinically useful information by refining risk prediction and moderating disease risk through a more efficient application of prevention strategies. In this thesis, we first address novel approach to survey the genetic architecture of hypertension (i.e. major risk factor for premature CVD), then construct risk prediction models for coronary artery disease (CAD; i.e. most common type of CVD) and finally establish a common genetic basis of the strongest predictor of clinical complications of CAD, subclinical atherosclerosis, to add incremental prognostic value above traditional risk scores across a range of ages.
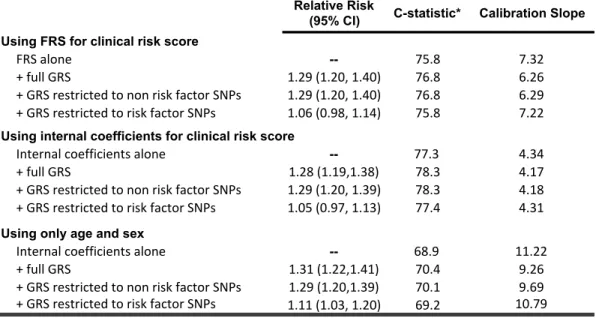
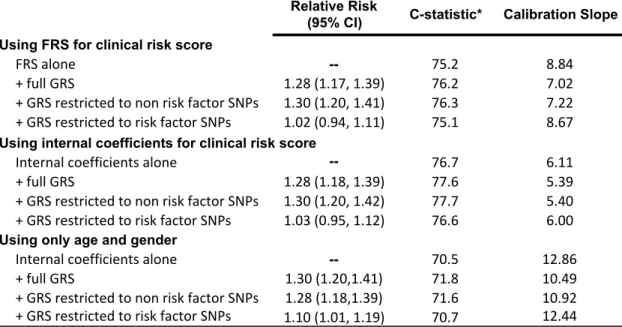
We show that, for first visit measurements, the heritability is ~25%/~45% and ~30%/~37% for systolic (SBP) and diastolic blood pressure (DBP) in European (N=8,901) and African (N=2,860) ancestry individuals from the Atherosclerosis Risk in Communities (ARIC) cohort, respectively, in accord with prior studies. Then we present a means to combine a polygenic risk score - genetic effects among an ensemble of markers - with an independent assessment of clinical risk using a log-link function. We apply the method to the prediction of coronary heart disease (CHD) in the ARIC cohort. The addition of a genetic risk score (GRS) to a clinical risk score (CRS) improves both discrimination and calibration for CHD in ARIC and subsequently reveal how this genetic information influences risk assessment and thus potentially clinical management. Finally, Among 1561 cases and 5068 controls, from several clinical and genetic datasets available through the NCBI's database of Genotypes and Phenotypes (dbGAP), we found a one SD increase in the genetic risk score of 49 CAD SNPs was associated with a 28% increased risk of having advanced subclinical coronary atherosclerosis (p = 1.43 x 10⁻¹⁶). This increase in risk was significant in every 15-year age stratum (.01 > p > 9.4 x 10⁻⁷) and was remarkably similar across all age strata (p test of heterogeneity = 0.98). We obtained near identical results and levels of significance when we restricted the genetic risk score to 32 SNPs not associated with traditional risk factors.
Accordingly, common variation largely recapitulates the known heritability of blood pressure traits. The vast majority of this heritability varies by chromosome, depending on its length, and is largely concentrated in intronic and intergenic regions of the genome but widely distributed across the common allele frequency spectrum. Respectively, our proposed method to combine genetic information at established susceptibility loci with a non-genetic risk prediction tool facilitates the standardized incorporation of a GRS in risk assessment. Lastly, multi-locus GRS derived from the high-risk alleles of SNPs associated with clinical complications of CAD is strongly associated with the presence of advanced subclinical atherosclerosis. This susceptibility to plaque formation is life long, remarkably homogenous, and not driven by exposure to traditional risk factors.
Table of Contents
CHAPTER 1: INTRODUCTION ... 3
1.1 Blood pressure, major cardiovascular risk factor ... 3
1.2 Hypertension, major Cardiovascular Disease risk factor ... 4
1.3 The Genetics of Hypertension ... 4
1.4 Genome-Wide Association Studies (GWAS) of Hypertension ... 5
1.5 The Heritability (h2) of Hypertension ... 6
1.6 The hunt for missing Heritability ... 7
1.7 Development of Atherosclerosis ... 8
1.8 The most common type of Cardiovascular Disease ... 9
1.9 The strongest predictor of Coronary Artery Disease: CAC ... 9
1.10 Genome-Wide Association Studies of CAD ... 10
1.11 Clinical and Genetic Risk Assessment of Cardiovascular Disease ... 12
CHAPTER 2: THE HERITABILITY OF BLOOD PRESSURE ... 14
Preface to the Manuscript ... 14
2.1 Abstract: ... 17
2.3 Results: ... 20
2.4 Discussion: ... 25
2.5 Materials and Methods: ... 28
Legends to Figures: ... 32
Legends to Tables: ... 38
Legend to Supplementary Table: ... 45
CHAPTER 3: CLINICAL AND GENETIC RISK ASSESSMENT OF CARDIOVASCULAR DISEASE ... 52
Preface to the Manuscript ... 52
3.1 Abstract ... 55
3.2 Introduction ... 56
3.3 Methods ... 57
3.3.1 SNP Selection & Weighting ... 57
3.3.3 Clinical Risk Score Assessment ... 59
3.3.4 Imputation of ARIC raw genotype data to 1000 genomes ... 59
3.3.5 GRS Construction ... 60
3.3.6 Combining Clinical and Genetic Risk ... 60
3.3.7 Evaluation of performance of risk scores ... 62
3.3.8 Risk Reports ... 63
3.4 Results ... 64
3.4.1 ARIC cohort exclusions ... 64
3.4.2 Risk Scores ... 64
3.4.3 Performance of risk scores and sensitivity analyses ... 64
3.4.4 Risk Reports ... 65
3.5 Discussion ... 66
Figure Legends ... 70
CHAPTER 4: GENETIC RISK ASSESSMENT OF CORONARY PLAQUE BURDEN ... 77
Preface to the Manuscript ... 77
4.1 Abstract ... 80
4.2 Introduction ... 81
4.3 Material and Methods ... 82
4.3.1 Study Population ... 82
4.3.2 Case definition ... 82
4.3.3 SNP Selection and Imputation ... 83
4.3.4 Construction of the GRS ... 83 4.3.5 Statistical Analysis ... 84 4.4 Results ... 85 4.5 Discussion ... 86 Legends to Figures: ... 91 Legends to Tables: ... 95
Legend to Supplementary Figures: ... 98
CHAPTER 5: DISCUSSION ... 101
CHAPTER 1: INTRODUCTION
1.1 Blood pressure, major cardiovascular risk factor
“The measurement of [blood pressure] is likely the clinical procedure of greatest importance that is performed in the sloppiest manner.” 1
Blood pressure is the pressure within the major arterial system of the body measured in millimeters of mercury (mm Hg) with a sphygmomanometer and usually expressed as the systolic - contraction of the ventricles, heart beats - over the diastolic pressure (filling of the heart with blood between ventricles contractions, heart rests between beats). In other words, systolic pressure is the maximum blood pressure and diastolic pressure is the minimum pressure recorded just prior to the next contraction.
Optimal blood pressure is less than 120 mm Hg systolic and 80 mm Hg and ideally perfused adequately vital organs2 without causing damages. Organs inadequately perfused experience ischemic damage and are unable to perform efficiently. For instance, poor renal perfusion may trigger renal failure with thorough metabolic outcomes. In contrast, elevated blood pressures may cause end organ damage with harmful consequences such as heart attack, stroke, kidney failure and dissecting aneurysm. Blood pressure is considered high if it is 140 mm Hg systolic and/or 90 mm Hg diastolic or higher2.
Low blood pressure is manifested by fatigue or shortness of breath on effort. Since perfusion pressure is inadequate, the increased oxygen and nutrient demand by exercising muscles cannot be satisfied and can cause symptoms of dizziness and fainting. The most frequent causes of low blood pressure are due to dehydration or reduced blood volume.
1.2 Hypertension, major Cardiovascular Disease risk factor
Untreated high blood pressure (BP) is an important major cardiovascular risk factor for ischemic heart disease, cardiac and renal failure and accounts for a large fraction of morbidity and mortality worldwide3. In North America, nearly one third of the adults over 20 years of age suffer from Hypertension (HTN) 3.
Essentially, blood pressure is a quantitative trait controlled by cardiac output4, peripheral vascular resistance and blood volume. This trait varies between subjects by a variety of environmental and physiologic factors such as age, BMI (body mass index), smoking and physical activity; yet adjustment for these covariates only explain a small proportion of blood pressure variability. Application of genetics and genomics offer subsequently a major opportunity to elucidate the remaining fraction of blood pressure variation.
1.3 The Genetics of Hypertension
The nature of the inherited basis of hypertension has been questioned in the 1950s, since the classic work of Lord Robert Platt and Sir George Pickering5. Platt claimed that hypertension was influenced by a single Mendelian genetic variant responsible of a dichotomous frequency distribution curve of blood pressure levels. Pickering, while recognizing the importance of inherited factors in blood pressure regulation, countered that multifactorial genetic inheritance drove a continuous, unimodal blood pressure distribution with the hypertensive and non-hypertensive segments defined by an arbitrary line. Platt’s hypothesis is supported by rare variants with large effects that cause monogenic hypertension syndromes, whereas Pickering’s theory is substantiated by variants (polygenic) with small effect sizes that collectively contribute to essential hypertension.
Over the years, researchers have gained insight into the genetic architecture of hypertension as a result of technologic advances that permit the genotyping of million single nucleotide polymorphisms (SNPs) on a single microarray6. These genomic tools enable the investigation of a considerable proportion of the common human genetic
variation throughout the genome. According to numerous studies, it appears that common variants act on common disease at many loci7-10, explaining little individually but explaining a much larger share of the trait or disease collectively. Previous investigations of complex genetic disease by candidate gene studies or linkage analysis were not designed toward identification of variants with these features11. The genome-wide association study (GWAS) offers the first opportunity to test such hypotheses12, 13.
1.4 Genome-Wide Association Studies (GWAS) of Hypertension
Association testing of every single SNP against blood pressure traits opens the way for an unbiased interrogation of genetic causes of these traits. The basic methodology used to test for association between blood pressure and hundreds of thousands of SNPs disseminated throughout the human genome is rudimentary: an association statistic is calculated to assess the relationship between each SNP and the phenotype of interest, generally by linear regression for continuous phenotypes or by logistic regression for dichotomous phenotypes. In other words, it compares the frequency of SNPs in cases and controls; high frequency of the SNP in cases suggests close proximity to a genetic risk variant. The number of tests performed is equivalent to the number of SNPs; although the number of independent tests is lower since many SNPs are correlated. Given the large numbers of tests carried-out, highly significant results can be obtained by chance. Subsequently this burden of multiple testing required stringent thresholds14, 15, current practice seems to prefer a threshold of P = 5 × 10⁻⁸ (based on an adjusted p-value of 0.05 for one-million tests).
In order to infer genotypes at un-typed SNPs, genotypes used for GWAS are imputed to the 1000 Genomes Project datasets15, 16, bringing the number of variants up to ∼30 million. Imputation backbone of the 1000 Genomes project, therefore increase statistical power and extend the allele frequency spectrum analyzed.
The first GWAS to identify HTN variants was carried out by the Wellcome Trust Case Control Consortium (WTCCC) in 2007 using 2,000 cases and 3,000 shared controls17. From this large-scale analysis no variants reached genome-wide significance,
calling out the need for larger sample sizes. Since then, several consortia and individual studies have identified over 49 variants associated with SBP, DBP, or HTN18-28. These discovery efforts were carried out using samples of European descent, such as the CHARGE (Cohorts for Heart and Aging Research in Genomic Epidemiology) consortium, the Global BP Gen (Global BP Genetics) consortium, and the ICBP (International Consortium for BP).
To date, several loci have been identified for SBP, DBP, and HTN as a result of the contribution of the ICBP effort and many other studies. The ICBP-GWAS experiment of 2011 included 69 395 individuals and further replication genotyping in up to 133 661 subjects18. This study described 29 SNPs with genome-wide significance and replicated 13 loci identified in previous effort. As of now, 49 causal variants are associated to blood pressure traits and interestingly all of the alleles increasing SBP/DBP also increased the risk of HTN. Of the 49 variants significantly associated with SBP, DBP and HTN, a minority is near a gene related to BP. The remaining variants are localized in genomic regions that were previously unsuspected for their link with BP. The effect sizes for each individual genetic variant are small, typically 1 mmHg for SBP and 0.5 mmHg for DBP. Even collectively, the variance tagged by the 49 associated SNPs explains only 1-2% of the expected narrow-sense heritability (h2) for SBP and DBP18, defined as the ratio of the additive genetic values (combined effect of all loci) to the total phenotypic variance.
1.5 The Heritability (h2) of Hypertension
Heritability is often estimated to summarize the proportion of phenotypic variation due to variation in genetic factors29, 30. Given its definition the heritability always lies between 0 and 1. Current estimate of the heritability of BP is approximately 25 times larger than the variation accounted by GWAS SNPs18. This mismatch between the high heritability estimates from quantitative genetic analyses and the small fraction of variance explained through GWAS findings has been designated as the ‘missing heritability’31, 32. This discrepancy is likely due to rare genetic variants (“common disease–rare variant” hypothesis33, 34) or because genotyped SNPs are in incomplete linkage disequilibrium (LD) with the causal variants35. Since non-additive genetic effects
(gene-by-gene or gene-by-environment interactions) do not contribute to the narrow-sense heritability. Part of these “missing” genetic factors contribute to the estimated genetic effect, but are not detected in GWAS analyses, which capture only additive effects of common SNPs with minor allele frequencies (MAF) of 5%. Lack of complete LD might, for instance, occur if causal variants have lower MAF than genotyped SNPs. A second suggested explanation is that multiple additional common genetic variants contributing to the genetic effect observed in quantitative genetic studies have such small effect sizes (fail to pass stringent significance thresholds) that they remain undetected in large data sets used in contemporary GWAS analyses.
1.6 The hunt for missing Heritability
GWASs have successfully identified thousands of SNPs significantly associated with complex traits and diseases in human by examining each SNP individually for significance; yet these variants typically account for only a small fraction of the genetic variation36. Alternatively, the narrow sense heritability explained by the common SNPs may be estimated by adapting a linear mixed-effects model for all SNPs simultaneously37. The effects of the SNPs are treated statistically as random, and the variance explained by all the SNPs together is estimated. This approach subsequently decomposes the phenotypic variance into genetic and residual variance components. Usually, the estimate of heritability is applied to related individuals where the genetic relationships are assessed by using family pedigree or SNP data. Recent study pointed out that heritability could be estimated using genetic relationships obtained from autosomal SNPs for unrelated individuals since degree of genetic resemblance for common SNPs at the whole-genome level is normally distributed among unrelated individuals35. The main difference between the latter and the former estimates is due to the difference in LD between the common SNP and the rest of the genome, with the assumption that closely related individuals would be in greater LD than unrelated subjects. Thus, heritability estimated with the genetic relationships of unrelated individuals is attributed to the common variants while that estimated with genetic relationships of related individuals is attributed to the entire genome. Furthermore, estimate of the genetic variance using common markers in unrelated individuals is directly comparable to results from GWAS,
since both are based on the same experimental design. While the method does not identify single variants, it quantifies the overall contribution from the additive effects of SNPs in currently available DNA array.
This alternative approach designed to overcome the weaknesses of GWAS can provide an unbiased estimate of the variance explained by all SNPs, given that only a small fraction of the BP heritability is currently explained by genome-wide significant SNPs18.
Untreated elevated blood pressure is not only a well-established cardiovascular risk factor but predisposes to and accelerates atherosclerosis38-40.
1.7 Development of Atherosclerosis
Atherosclerosis is a degenerative inflammatory disorder characterized by the progressive deposition of lipids and fibrous matrix in the arterial wall, which accounts for substantial cardiovascular morbidity and mortality3, 41, 42. The first stages of atherosclerosis are characterized by the loss of the normal barrier function of the endothelium, lipoprotein abnormalities that promote the accumulation of lipoproteins, particularly low-density lipoproteins (LDL), in the intimal region43. In response to the lipoprotein accumulation, dysfunctional endothelial cells express a number of adhesion molecules and selectins that promote the binding of circulating monocytes to vascular endothelial cells42, 43. Monocytes are then exposed to chemokine that induces the transmigration of bound monocytes into the sub-endothelial space. In the inflamed intima, a cytokine or growth factor give rise to the differentiation of monocytes into macrophages. This step is critical for the development of atherosclerosis44. Macrophages are subsequently exposed to modified LDL and express scavenger receptors that bind and promote the ingestion of oxidized LDL. As the macrophage progressively accumulates cholesterol, the macrophage takes on the appearance of a lipid-laden foam cell. In concert, T-lymphocytes infiltrate the developing lesion site from both the intimal and adventitial aspects of the vessel wall, where it secretes inflammatory cytokines and growth factors45. This provides a signal for smooth muscle cells to alter their
cytoskeleton, migrate from the media into the intimal space, where they proliferate and secrete extracellular matrix components that form a fibrous cap over the developing lesion42, 43, 46. The ongoing inflammatory response in the vascular wall continues to provide signals for further LDL uptake and leucocyte infiltration, creating conditions for further growth of the atherosclerotic lesion47. Over time, the atherosclerotic lesion continues to expand at its base via the same mechanisms that led to formation of the initial fatty streak.
1.8 The most common type of Cardiovascular Disease
The stability of the advanced atherosclerotic lesion or plaque (lipid core bounded by a fibrous cap) depends on its cellular and extracellular contents. Plaques with small lipid cores, thick fibrous caps, few inflammatory cells and a preponderance of smooth muscle cells are typically stable; conversely, those with large lipid cores, thin fibrous caps, numerous macrophages and relatively few smooth muscle cells are most likely to rupture (vulnerable plaque). Atherosclerotic lesion rupture usually are caused by resident activated macrophages, T cells, at sites of plaque rupture that secrete several types of molecules such as cytokines and vasoactive molecules that can destabilize lesions, which inhibit the formation of stable fibrous caps, attack collagen in the cap, and initiate thrombus (blood clot) formation47, 48. Thereafter, the disrupted plaque serves as a scaffold to allow platelet aggregation and coagulation. The thrombus size depends on the extent of plaque rupture as well as activity of the endogenous fibrinolytic pathway. When sufficiently large, the thrombus can either partially or completely occlude the coronary vessel lumen and precipitate an acute coronary event (e.g. unstable angina, myocardial infarction (MI), and sudden death). Coronary artery disease (CAD) is almost always due to atheromatous narrowing and subsequent occlusion of the vessel49.
1.9 The strongest predictor of Coronary Artery Disease: CAC
The prevalence and extent of atherosclerosis development increase with age50. Age is used as a surrogate for coronary plaque burden, but plaque burden is the true risk factor for coronary heart disease related morbidity and mortality51. Because plaque burden can vary among individuals at any given age, accurate measurement of subclinical
atherosclerosis may provide a better method for predicting risk for acute cardiovascular events.
A variety of invasive and non-invasive techniques are available to measure atherosclerosis and subclinical atherosclerosis. These techniques can ascertain parameters such as luminal diameter or stenosis, vessel wall thickness, plaque volume, and the specific distribution and localization of atherosclerotic disease. Accordingly, Computed Tomography (CT) Scan is the only noninvasive test to evaluate the lumen and wall of the coronary artery with high sensitivity and specificity for calcium detection, and capable of quantifying coronary artery calcification (CAC) 52. This measures is translated into an Agatston score, calculated by multiplying the lesion area by a density factor derived from the maximal Hounsfield units in this area. Coronary calcium reflects plaque burden, because calcium deposits are related to the lipid and apoptotic remnants of the plaque. This calcification of the atherosclerotic plaque (deposition of calcium phosphate in the vessel wall) is limited to the sub-intimal space and can appear as early as the second decade of life, soon after the formation of fatty streaks53. First seen in the lipid core of the atheroma it occurs via an active process that resembles bone formation and is controlled by complex enzymatic and cellular pathways, including osteoblast-like cells, cytokines, transcription factors and bone morphogenetic proteins, which are typically involved in bone calcification, are also involved in the process of vascular calcification. Subsequently, the presence of calcium in coronary arteries is pathognomonic of atherosclerosis54. CAC is an independent cardiovascular risk factor that adds prognostic information when considered in conjunction with other risk factors.
However, although CT scan can localize coronary plaques within the coronary tree and provide a quantitative measure of relative disease severity, it can be used to ascertain highly vulnerable patient rather than the susceptibility of individual plaques to rupture.
1.10 Genome-Wide Association Studies of CAD
In late 2007, three independent GWAS for CAD identified a significant association signal on chromosome 9p2155-57. No prior genetic studies had implicated this
region of the genome. Moreover, the SNPs in the locus that were associated with coronary disease were not associated with any traditional cardiovascular risk factors. Thus, it appears that the genetic mechanism underlying the association signal is operating through a novel pathway. Subsequent studies established an association between the 9p21 locus with MI and other vascular phenotypes such as abdominal aortic aneurysm, intracranial aneurysm, and peripheral arterial disease, suggesting that the sequence variations may interfere with vascular tissue development58-60. The 9p21 locus illustrates the difficulty of linking some of the genetic associations identified by GWAS with pathological mechanism. No annotated genes are present in the minimal region of association as defined by linkage disequilibrium, the closest genes to the locus, CDKN2A, CDKN2B, and ARF, are more than 100 kb away from the index SNPs (SNPs with the highest level of association), making it unclear how the causal DNA variant(s) might influence coronary disease.
One possibility is that the loci harbor non-gene transcripts that regulate other genes or lies in a regulatory element (e.g., a transcriptional enhancer) that affects the transcription of a gene or genes that are ultimately responsible for the phenotype61.
Lately, a large consortium of investigators focused on coronary disease (the Coronary Artery DIsease Genome-Wide Replication and Meta-analysis plus The Coronary Artery Disease (C4D) Genetics, or CARDIoGRAMplusC4D Consortium) has assembled 63,746 cases of coronary disease and 130,681 control samples and discovered 15 additional associated loci62, reaching genome-wide significance, taking the number of susceptibility loci for CAD to 4655, 63-70, and a further 104 independent variants (r2 < 0.2) strongly associated with CAD at a 5% false discovery rate (FDR).
GWAS results represent a rich source of information for treatment research that forms bridges between genome science and clinical and public health practice71, 72. Given the large number of genome-wide studies, sufficient data exist to support such translational research for a number of common chronic health conditions, including CAD73, 74. Infrastructure is now in place at the start of the translational pipeline, with
GWAS data extracted and curated in continuously updated catalog75, 76. Likewise, at the other end of the pipeline, evidence from translational research is estimated to establish the clinical benefit of genomic information and issue guidelines for clinical practice77. However, significant gaps remain in the middle of the translational pipeline, and approaches are needed to support research at this intersection, so that population-based samples with rich environmental and phenotypic measurements can be used to follow up disease markers identified in GWAS. In accordance, systematic approaches are needed to scrutinize the results of various association studies and distill the most promising set of markers for further investigation.
1.11 Clinical and Genetic Risk Assessment of Cardiovascular Disease
CAD is a public health problem, which is highly prevalent; it is a significant source of morbidity and mortality under strong genetic influence and lately GWAS started to elucidate its molecular genetic roots. Consequently, risk assessment plays a critical clinical role in prevention strategies and in therapy for CAD at the individual level, and is key to future efforts in personalized medicine in this area. Current risk prediction models are established on traditional risk factors (TRFs) such as age, sex, smoking, lipid levels, and blood pressure, and although extensively validated, these models have limitations78. Lately, multiple studies have evaluated the ability of “emerging risk factors,” including biomarkers, and genetic variants, to improve CHD risk assessment beyond the use of TRFs79. Of the biomarkers that could be objectively and systematically measured, genetic variants have some unique features in that they do not change over time. Subsequently, multi-locus profiles of genetic risk, so-called “genetic risk scores” (GRS) can be used to translate discoveries from GWAS into tools for population health research80, 81. GRS summarize risk-associated variation across the genome by aggregating information from multiple-risk SNPs (summing up the number of disease-associated alleles). Since GRS pool information from numerous SNPs, each individual SNP is less important to the summary measurement, and thereby counteract the lack of linkage for any one SNP. For the same reason, GRS is less sensitive to minor allele frequencies for individual SNPs. As the number of SNPs included in a GRS increases, the distribution of values approaches normality, even when individual risk
alleles are relatively uncommon82. Therefore, the GRS can be an efficient and effective means of constructing genome-wide risk measurements from GWAS findings.
To address these challenges, data from the population-based Atherosclerosis Risk in the Communities (ARIC) Study were used to estimate the genomic contributions to blood pressure heritability. Then, we proposed a method to facilitate the standardized incorporation of a GRS in risk assessment for complex traits with CAD as example. Finally, I examined the association between a GRS of high-risk alleles associated with clinically significant complications of CAD and the presence of subclinical atherosclerosis.
CHAPTER 2: THE HERITABILITY OF BLOOD PRESSURE
Preface to the Manuscript
This manuscript presents the first part of a study investigating the genetic basis of cardiovascular disease by examining the heritability of the leading cardiovascular risk factor.
This study focuses on determining whether common variant capture a large proportion of blood pressure traits variability. We felt that it was important to answer this question first because such estimate could establish the total contribution of genotyped markers on current SNP arrays for blood pressure.
We utilized data on genotyped common SNPs and imputed SNPs respectively, in European ancestry and African ancestry from ARIC population, separately, and a mixed linear model for analyses.
Subjects under anti-hypertensive treatments were adjusted for potential medication effects by adding 10 and 5 mm Hg to observed systolic (SBP) and diastolic (DBP) blood pressure measurements, respectively.
The variance explained by common variant in this study was a function of chromosome size, minor allele frequency (MAF), functional annotation (coding, intronic and intergenic; cardiovascular/renal or other genes), and markers enriched for functional candidates (GWAS blood pressure loci; Cardio-Metabochip SNPs) respectively. These genomic partitions reflect actual genetic architecture of blood pressure variance from several angles.
In this context, the general objective of this first study is to estimate the proportion of variance tagged by common SNPs for blood pressure traits.
The specific objective of this first study is:
1. To identify the extent to which common variants can explain the amounts and distribution of SBP and DBP variation within the genome and with respect to allele frequency, coding versus non-coding DNA and sites of gene expression.
2. To compare the variance explained by directly genotyped SNPs to the variance explained by genotyped and imputed SNPs.
3. To compare the genetic variance captured by common SNPs for European ancestry to the genetic variance attributed by common SNPs for African ancestry.
4. To compare whether more stringent definition of unrelated individuals affect the estimate of blood pressure heritability.
Direct estimates of the genomic contributions to blood
pressure heritability within a population cohort (ARIC)
Elias Salfati1,2, Alanna Morrison3, Eric Boerwinkle3 and Aravinda Chakravarti1, 4
1
Center for Complex Disease Genomics, McKusick - Nathans Institute of Genetic Medicine, Johns Hopkins University School of Medicine, Baltimore, MD 21205
2
Ecole Doctorale B2T, IUH; Université Paris 7, 75010 Paris , France 3
Human Genetics Center, University of Texas Health Science Center, Houston, TX 77030.
2.1 Abstract:
Blood pressure (BP) is a heritable trait with multiple environmental and genetic contributions with current heritability estimates from twin and family studies being ~ 40%. Here, we use genome-wide polymorphism data from the Atherosclerosis Risk in Communities (ARIC) study to estimate BP heritability from genomic relatedness among cohort members. We utilized data on 656,362 and 772,638 genotyped common single nucleotide polymorphisms (SNPs), and up to 7,558,733 and 9,578,528 imputed SNPs, in 8,901 European ancestry (EA) and 2,860 African Ancestry (AA) ARIC participants, respectively, and a mixed linear model for analyses. We show that, for first visit measurements, the heritability is ~25%/~45% and ~30%/~37% for systolic (SBP) and diastolic blood pressure (DBP) in European and African ancestry individuals, respectively, in accord with prior studies. A new finding is that common variation largely recapitulates the known heritability of BP traits. The vast majority of this heritability varies by chromosome, depending on its length, and is largely concentrated in intronic and intergenic regions of the genome but widely distributed across the common allele frequency spectrum. Interestingly, the majority of this heritability arises from loci harboring currently known cardiovascular and renal genes. Recent meta-analyses of large-scale genome-wide association studies (GWASs) and admixture mapping have identified ~50 loci associated with BP and hypertension (HTN) and yet they account for only a small fraction (~2%) of the heritability. Consequently, elucidation of BP genes will require focused analysis of cis-regulatory elements controlling cardiovascular and renal gene expression.
2.2 Introduction:
Blood pressure (BP) is an established risk factor for multiple cardiovascular diseases (CVD) and, worldwide, about one-tenth of adult global death is attributable to high blood pressure or essential hypertension83. It’s a truism that BP, studied through systolic (SBP) or diastolic (DBP) measures or clinically defined hypertension (HTN), is a complex, polygenic trait that is influenced by both genetic and environmental factors84. BP heritability is moderate, and ~40% across studies (18), and has classically been estimated from twin and family studies. Molecular genetic analyses of BP genetics have been challenging with the exception of Mendelian hypo- and hypertension syndromes that show large BP variation in individuals harboring loss- and gain-of-function mutations in numerous renal genes85. These latter studies convincingly demonstrate that renal salt-water homeostasis is key to maintaining blood pressure control and is rate limiting. Nevertheless, it is unknown whether loss of renal salt-water homeostasis is primary or secondary to elevated BP arising from other mechanisms. Several environmental factors that influence BP levels, such as alcohol consumption, dietary salt-intake, physical activity and stress, are also known but the biochemical paths of their action remain incompletely described. Identification of the genes that influence inter-individual variation in BP thus remains a key and important challenge since this can lead to discovery of new etiological pathways.
In recent years, genetic advancements have made it feasible to conduct a comprehensive search for genes underlying a trait. To date, large-scale genome-wide association studies (GWAS), and other genome-wide analyses, have identified ~50 single nucleotide polymorphisms (SNPs) associated (P < 5 × 10⁻⁸) with genetic risk factors contributing to inter-individual variation in BP18-20, 22, 23, 25-28, 86. By design, the vast majority of these genetic variants is common (>10%) in the general population and have small (<0.05σ, where σ2 is the residual phenotype variance) allelic effects, and collectively these loci explain only a small (<5%) fraction of the phenotypic variance (i.e. heritability) 87. This substantial gap between the overall and identified heritability has led to a great deal of speculation as to the causes for this “missing” heritability, including our failure to assess effects at rare variants and copy number polymorphisms88, 89.
Nevertheless, before we entertain new genetic hypotheses for complex trait architecture it is first necessary to answer what is the total contribution of all common genetic variation to BP heritability? The typical approach to providing this answer has been through summing the contributions of individual SNPs showing genome-wide significant associations: this approach leads to a severe underestimate since GWASs suffer from a high false negative rate in its attempt to control the false positive rate. This false negative rate arises from the majority of genetic effects being too small to reach statistical significance and incomplete linkage disequilibrium between genotyped markers and causal variants.
Newer statistical methods allow a robust answer to this question by estimating the trait residual variance explained by all common SNPs taken together and by considering them as random effects in a mixed linear model35, 37. Indeed, these analyses can be conducted on all genomic polymorphisms or those restricted to specific subgroups, such as individual chromosomes, allele frequency class or functional annotation, to assess relative contributions from these subgroups. Visscher and colleagues have demonstrated that some complex traits arise largely from allelic effects of common variants35, 90-93. We use their approach to ask: is inter-individual BP variation mostly due to polymorphic additive genetic factors? We also investigate the proportion of inter-individual BP variation captured by common SNPs as a function of chromosome size, minor allele frequency (MAF) of genotyped variants, by functional annotation (coding, intronic and intergenic; cardiovascular, renal or other genes), and by markers enriched for functional candidates (GWAS BP Loci; Cardio-Metabochip SNPs). Finally, we also used longitudinal phenotype data, and assessing the effect of long-term average (LTA) BP, to detect additional genetic variance through reducing measurement error94. These analyses demonstrate that the majority (>50%) of both SBP and DBP heritability is from common (MAF>10%) genetic variation almost exclusively in non-coding (intronic and intergenic) DNA and at loci enriched for cardiovascular and renal genes. Consequently, genetic etiologies of BP and HTN are addressable through independent identification of cardiovascular and renal genes and focused identification of the underlying variants and
genes. We propose specific approaches for identifying the causal factors for BP, approaches that do not depend merely on larger GWAS studies but require specific understanding of the cis-regulatory architecture of the human genome.
2.3 Results:
The majority of our analyses are on the full set of 8,901 EA and 2,860 AA unrelated individuals within ARIC (Table 1; Table 2). The pairwise genomic relationship matrix (GRM) was estimated for these individuals using the high quality (call rate > 95%; MAF ≥ 1%; HWE P > 10-6) autosomal genotypes at 656,362 and 772,638 directly genotyped SNPs and also including all 7,558,733 and 9,578,528 imputed markers with MAF ≥ 1% (imputation R2 ≥ 0.3) in EA and AA participants, respectively. To avoid phenotypic resemblance due to non-additive genetic effects and common environmental influences, we excluded one of each pair of individuals with an estimated genetic relationship > 0.025 (equivalent to 2nd cousins). Consequently, we created a second dataset that included only 6,914 and 1,763 genetically “unrelated” EA and AA participants, correspondingly, to assess whether they impacted our conclusions. The BP distributions of the 8,901 EA and 2,860 AA individuals are not statistically different from the 6,914 EA and 1,763 AA, respectively, suggesting that the use of either set would be representative of the population’s BP features (Table 1, Table 2). Relatedness between participants using genotyped and genotyped and imputed SNPs followed normal distributions with mean -0.00015 (s.d.= 0.0044) and -0.00014 (s.d.=0.0043), respectively, and showed trivial differences. Consequently, for the remaining analyses we used the set of 8,901 EA and 2,860 AA individuals to maximize the available sample sizes.
The GRMs were fitted to a mixed linear model (MLM) to SBP and DBP and restricted maximum likelihood (REML) methods were used to estimate the proportion of variance explained by genetic markers. Two types of analyses were performed that estimated the proportion of variance explained by the sum of that on individual chromosomes and by the whole-genome: for the first analysis, we fit 22 pairwise relationship matrices simultaneously (joint analysis) while in the second we merged these relationship matrices into one GRM (combined analysis). Estimates from both analyses
were very similar. The phenotypic variance explained by only genotyped SNPs (~600k SNPs in EA, ~700k SNPs in AA) was 0.25 in EA (SE = 0.05, P = 2x10⁻⁸) and 0.45 in AA (SE = 0.12, P = 1.1x10⁻⁵) for systolic and was 0.31 in EA (SE = 0.05, P = 2 x10-15) and 0.29 in AA for diastolic (SE = 0.11, P = 7 x10⁻⁵) blood pressure, and were highly significant (Table 3; Table 4). These estimates were nearly identical to the variance explained by considering all imputed and genotyped SNPs (~7m SNPs in EA, ~9m in AA), and were 0.23 in EA (SE = 0.05, P = 7 x10⁻⁷) and 0.40 in AA (SE = 0.23, P = 4x10 -3
) for SBP and 0.32 in EA (SE = 0.05, P = 3x10-14) and 0.37 in AA (SE = 1.2, P = 1x10⁻³) for DBP and, once again, were highly significant (Supplementary Table 1; Supplementary Table 2). Therefore, the estimated variances are stable, largely from the effects of polymorphisms (MAF ≥ 1%) and do not appear to be dependent on the number of SNPs used. This result is not surprising since imputation increased the numbers of markers but included those that were highly correlated to the primary genotyped set of common alleles.
The apportioning of variance explained by individual chromosomes clearly demonstrated that although there is a general yet significant correlation between chromosome length and variance explained (SBP r cor = 0.26 (EA) / 0.56 (AA); DBP r cor = 0.31 (EA) / 0.42 (AA)), individual chromosomes differed considerably in their contributions to BP variation (Figure 1, Figure 2). Moreover, there is a high but not absolute concordance between the variances explained for both SBP and DBP by each chromosome. In EA the highest proportion of genetic variance captured by chromosome for SBP is from three chromosomes: chromosomes 2 (h2~3%; SE ~0.011), 4 (h2~2.5%; SE ~0.011) and 12 (h2~2.2%; SE ~0.012). Likewise, in AA the three chromosomes that account for the largest fraction of genetic variance for SBP were chromosomes 2 (h2~11%; SE ~0.04), 5 (h2~5.9%; SE ~0.04) and 11 (h2~5.1%; SE ~0.03), capturing nearly half of the genetic variance. With respect to DBP, the most prominent contributions of genetic variation were from four chromosomes in EA: chromosomes 2 (h2~3.1%; SE ~0.015), 4 (h2~2.5%; SE ~0.014), 11 (h2~3%; SE ~0.013) and 16 (h2~2.3%; SE ~0.013); whereas for AA, five chromosomes accounted for the highest variances, namely, chromosomes 2 (h2~4%; SE ~0.04), 3 (h2~3.6%; SE ~0.032), 5
(h2~6.2%; SE ~0.038), 11 (h2~3.5%; SE ~0.03) and 13 (h2~5.4%; SE ~0.033), tagging over 65% of the genetic variance.
Blood pressure is a naturally varying phenotype. Thus, we assessed whether using the BP measurements from multiple (2-4) visits across time, as a Long Term Average (LTA), would lead to different conclusions by reducing measurement error95, 96. We used the same set of directly genotyped SNPs and LTA for SBP and DBP for similar analyses in EA and AA subjects (Supplementary Table 3). The proportion of genetic variance captured by chromosome for SBP showed a high correlation with first visit measurements BP (EA: rcor ~ 0.73, P = 8.84 x10⁻⁵; AA: rcor ~ 0.78, P = 1.28 x10⁻⁵) with greater variation explained by chromosomes 4 (~40% increase in both EA and AA), 10 (~40% increase in EA), 16 (~100% increase in AA) and 17 (~60% increase in EA). For DBP, the LTA measurements are smaller than those from first visit values in EA (rcor ~ 0.54, P = 9.4 x10⁻³) with the majority of the variation explained by chromosomes 2, 6, 10 and 11 (~ 50% to 75% decrease). In contrast, in AA, the variance explained by DBP-LTA is 50% more than first visit (rcor ~ 0.65, P = 9.4 x10⁻⁴), with the majority of the variation explained by chromosomes 1, 3 and 13 (~ 30% to 75% increase). Consequently, the pattern of the variance explained by each chromosome through the whole-genome differs significantly between BP-LTA measurements versus first visit measurements for DBP more than SBP.
A second feature of the chromosome-specific and whole-genome estimates of the BP heritability is that the latter is expected to be the sum of the chromosome-specific estimates unless there are very strong interaction effects. In these data, the chromosome sum and whole genome estimates are both 25% (EA)/45% (AA) for SBP and 31%(EA)/29%(AA) for DBP for directly genotyped SNPs (Table 3; Table 4); for the genotyped and imputed SNPs these comparisons are somewhat more discrepant at 23%(EA)/49%(AA) and 32%(EA)/37%(AA) for SBP and DBP, respectively. These observations suggest that BP variation is essentially additive in nature and largely arise from the contribution of polymorphisms (MAF ≥ 1%).
If genetic effects are approximately equal for all contributory alleles then the variation in contribution by these loci is highly dependent on their frequency (proportional to heterozygosity). Therefore, we analyzed the variance contributions by minor allele frequency (MAF) by binning each allele into five equal 10% frequency classes between 0 and 50%. These analyses (Table 5, Table 6) once again demonstrate that the heritability estimates do not significantly differ irrespective of whether we consider genotyped or genotyped and imputed SNPs or whether chromosome-sum or whole-genome estimates are considered. Moreover, the values are nearly identical to those latter obtained (Table 3,4; Figure 1, 2). Given the standard errors of the estimates, the general conclusions is that the variance explained, for both SBP and DBP, is roughly equivalent for all MAF classes with minor differences. For SBP, the estimated genetic variance for the five MAF categories ranged from 0.0 to 0.08 (SE 0.02–0.03) the highest proportion being from SNPs with MAFs 0.1-0.2; for DBP, the estimated genetic variance for the five MAF categories ranged from 0.03 to 0.073 (SE 0.02–0.03) in EA and from 0.0 to 0.28 (SE 0.14–0.13), the highest proportion being from SNPs with MAFs 0.1-0.2 in EA and with MAFs 0.2-0.3 in AA; for DBP, the estimated genetic variance for the five MAF categories ranged from 0.03 to 0.073 (SE 0.02–0.03) in EA and from 0.0 to 0.11 (SE 0.1–0.13) in AA, the highest proportion being from SNPs with MAFs 0.2-0.3 in EA and AA. The only noticeable feature is the low heritability for SBP for uncommon alleles (MAF <10%) but the substantial heritability for DBP for this same class. The more remarkable feature is the rough equivalency of heritability by MAF class despite there being a greater number of polymorphisms as MAF decreases and the consequent expectation that there are larger numbers of causal alleles at lower MAFs, alleles that are also considered to be of larger effect35. These results suggest that either an equivalent number of causal alleles exist irrespective of allele frequency or that causal alleles of higher frequencies explain more of the phenotypic variation.
We also investigated the likely locations of these common alleles modulating BP variation: were they preferentially located within genes in exons, introns and UTRs or were largely in the non-coding intergenic regions (Figure 3, Figure 4). Overall, irrespective of whether only genotyped SNPs or both genotyped and imputed SNPs were
analyzed, or SBP or DBP were considered, the contribution of SNPs within exons and UTRs were small, and less than 10% of the total, while intronic and intergenic regions contributed equally. Intriguingly, addition of the imputed variants increased the variation explained by exons and UTRs probably reflecting the increase in lower frequency alleles associated with functional genic regions97 Accordingly, the fraction of alleles under 5% and 1% MAF in the genotyped and imputed data were 48% and 30%, respectively, in contrast to values of 9% and 0.2% for the genotyped-only SNPs. A second functional annotation that can be used to identify specific genomic locations associated with BP variation is the expression site of the gene (Figure 5). Do known cardiovascular and renal genes explain a significant fraction of BP heritability? Our analyses show that ~5,000 annotated cardiovascular and renal genes harboring 237,173 genotyped SNPs explained ~7-10% of SBP/DBP variance in EA. Thus, these candidate genes explain a third of the SBP/DBP variance and is greater than that expected either from their proportional gene number (25%) or the number of SNPs within these genes (~35%).
We also estimated the genetic variance captured by known genome-wide significant BP Loci (identified in EA), including markers in strong LD, and discovered that GWAS loci account for a small proportion of BP variance in EA (~1% for SBP/DBP), as expected. Finally, we used the Cardio-Metabochip SNPs, or genetic variants selected based on GWAS meta-analyses of 23 cardiovascular and metabolic traits98. This analysis shows that over 50% of the BP variance in EA was explained by these set of SNPs despite them accounting for only 5% of the genotyped SNPs; in AA, these markers explained 20% and 45% of the variance for SBP and DBP, respectively (Supplementary Table 4). Similarly there is a high concordance between the variance explained by each chromosome for all genotyped SNPs and those genotyped markers from the Cardio-Metabochip array (EA: r cor ~0.65, p= 6.91 x 10⁻⁴; AA: r cor ~0.58, p= 1.41 x 10⁻³). The highest proportion of genetic variance captured by chromosome for SBP in the Cardio-Metabochip is from four chromosomes in EA: chromosomes 1 (h2~1.6%; SE ~0.006), 2 (h2~1.6%; SE ~0.006), 3 (h2~1.6%; SE ~0.005) and 4 (h2~1.9%; SE ~0.006). In comparison, for AA, four different chromosomes accounted for the majority of the variance: chromosomes 2(h2~3.7%; SE ~0.02), 12 (h2~2.3%; SE ~0.014),
13 (h2~1.7%; SE ~0.013) and 18 (h2~1.7%; SE ~0.01) With respect to DBP, the most prominent contributions of genetic variation were from four chromosomes in EA: chromosomes 1 (h2~2.2%; SE ~0.006), 2 (h2~1.5%; SE ~0.006), 3 (h2~2.4%; SE ~0.006) and 4 (h2~1.7%; SE ~0.006). Where in AA, the most prominent proportion of genetic variation was from four other chromosomes: chromosomes 2 (h2~2.5%; SE ~0.017), 5 (h2~3%; SE ~0.017), 12 (h2~1.4%; SE ~0.012) and 18 (h2~2.6%; SE ~0.012)
2.4 Discussion:
There is still considerable debate as to the relative importance of common versus rare variants in the inter-individual variation of complex traits88. Contemporary statistical methods now allow a direct estimate of the heritability from genome-wide marker data from unrelated phenotyped individuals35, 37. These estimates can be compared to the classical estimates obtained from family and twin data, and these methods also allow heritability estimates from any subset of the genome to test genetic and etiological hypotheses. In this study, we explored this question for systolic (SBP) and diastolic blood pressure (DBP) by identifying the extent to which common variants can explain the amounts and distribution of SBP and DBP variation within the genome and with respect to allele frequency, coding versus non-coding DNA and sites of gene expression. We used single nucleotide polymorphism (SNP) data from the population cohort ARIC (Atherosclerosis Risk in Communities) to demonstrate that the heritability for SBP and DBP is 25% (EA)/45% (AA) and 30% (EA and AA), respectively (Table 3, Table 4). These estimates were robust and did not depend on whether we used directly genotyped SNPs or included a larger number of imputed SNPs (Table 3, Table 4) or whether we used a more stringent definition of unrelated individuals in the estimation (Supplementary Tables 1 and 2). These estimates compare favorably to estimates obtained from family99 and twin studies100 of adults, that vary between 42% and 39-40% for SBP and DBP, respectively. One aspect to consider is that these genome-wide heritability estimates are quite accurate and have coefficients of variation of <15%. Clearly, these estimates can be made more accurate with increasing numbers of samples. However, increasing numbers of SNPs, beyond the basic set of 600k polymorphic genotyped markers, apparently do not matter much since imputation did not affect the
estimates greatly (Table 3, Table 4). Thus, the heritability estimates are not greatly affected by numbers of SNPs.
The BP heritability estimates provided here strongly assert that the majority of inter-individual variation in BP can be attributed to polymorphisms since the directly genotyped SNPs used had 1% or greater allele frequency. Genome-wide association studies, to date, have identified ~50 BP loci with a combined effect of ~2% of the phenotypic variance2-14. It is well known that current GWAS are underpowered and that many BP loci remain undetected after stringent control for statistical significance. Our results suggest that the vast majority of these causal factors are indeed common (polymorphic) and remain undetected: there may indeed be up to 1000 or more BP loci leading to inter-individual phenotypic variation. The typical SBP/DBP allelic effect is ~0.05σ (where σ2 is the phenotypic variance) so that the variance explained per SNP is 2pq(0.05σ)2 or 0.0008 or 0.08% of the variance for detected alleles (average allele frequency ~20%). If this value were typical, then 300 such loci would explain 25% of the phenotypic variance; one would infer a larger number of genes since most loci would explain a smaller variance and there is likely a statistical distribution of allelic effects.
Our analyses also shed light on some of the properties of these putative causal BP alleles. First, the additive chromosomal-level and the joint genome-level analyses provide near identical estimates suggesting that BP alleles are additive in genetic action (Figure 1,2), which is not surprising given their small effects since interaction effects will be notoriously difficult to identify at such effect sizes. The numbers of such factors are generally proportional to chromosome size although some individual chromosomes do harbor a surfeit of BP loci. The reasons for such spacial clustering are unknown and will be important to unravel. Second, the vast majority of these causal alleles reside in non-coding DNA, within introns and inter-genic DNA (Figure 3,4). These common BP alleles are under-represented within coding regions and there is a tendency for rarer alleles to be within genes. Third, causal alleles are widely distributed throughout the allele frequency spectrum with a tendency of a deficiency of rarer allele contributors to SBP and a greater presence for DBP. Fourth, mapping of susceptibility loci, associated with one or more
metabolic and cardiovascular traits, explained over half of the proportion of BP variance tagged by common SNPs. Fifth, LTA measurement, expected to describe a more accurate estimate of an individual’s long-term BP value, captured additional variance as compared to single visit BP. These conclusions are quantitatively an underestimate of the additive genomic influence because it is limited to SNPs with a minor allele frequency beyond 1% and other SNPs reliably (R2 > 0.3) imputed from them; rarer variants and not well-imputed SNPs are, therefore, excluded. Also, causal SNPs that were not highly correlated with the SNPs on the genotyping array or after imputation were also missed.
The above conclusions would need to be replicated in independent sets of individuals. Nevertheless, the main challenge in complex trait genetics remains the specific identification of the causal non-coding alleles and the genes they affect underlying SBP and DBP variability. Although GWAS are increasing in sample size and identifying a greater number of loci it is unlikely that they can achieve saturation identification. Our analyses suggest that the vast majority of these alleles are common, distributed across the genome, non-coding and not associated with known cardiovascular or renal genes. We propose that alternate methods be considered. One such method might be the partitioning of the genome and its variation into three segments: coding, regulatory and unknown functions. Searches for genetic variation, either by the analyses methods here or by direct GWAS, affecting phenotypes within these segments may lead to the identification of a larger number of causal factors.
In conclusion, we estimated additive genetic variation that is captured by genotyped and imputed SNPs for BP, and partitioned this variation according to chromosome, MAF, gene annotation. We provide compelling evidence that a substantial proportion of variance for blood pressure trait is explained by common SNPs, and thereby, give insights into the genetic architecture of BP trait. However, it is likely that variants other than the ones considered here and those with small effect need to be considered in addition to common SNPs.
2.5 Materials and Methods:
In the present study, phenotype data were available for 15,792 participants from the ARIC (Atherosclerosis Risk in Communities) study. ARIC is a population-based, prospective epidemiologic study of cardiovascular disease in European ancestry (EA) and African ancestry (AA) volunteers aged 45-64 years at baseline (1987-89), conducted in four US communities101. This analysis is focused on both European ancestry (EA) and African ancestry (AA) study participants. Cohort members completed up to four clinic examinations between 1987 and 1998, that were conducted approximately three years apart. Clinical examinations for ARIC participants assessed cardiovascular risk factors and diet, undertook various clinical and laboratory measurements, and measured numerous social variables (education, income, etc.). Genome-wide SNP genotypes in 9,747 self-identified EA and 3,207 self-identified AA subjects were obtained using the Affymetrix Gene Chip Human Mapping Array Set 6.0. The genotype data were used to exclude some samples from analyses for the following reasons: 1) discordance with previous genotype data (n=171 in EA; n=11 in AA), 2) mismatch between genotype- and phenotype-based gender (n=12 in EA), 3) previously unrecognized but suspected first or second degree relative of another participant (n=355 in EA), 4) genetic outlier as assessed by average Identity by State (IBS) statistics ( >8 standard deviations along any of first 10 principal components in EIGENSTRAT with 5 iterations using PLINK) (n=308 in EA; n=336 in AA). This led to an exclusion of 846 EA and 347 AA participants, resulting in a retained dataset of 8,901 and 2,860 unrelated EA and AA subjects, respectively. In parallel, to check if shared environmental effects and/or causal variants not captured could further bias our variance estimates, we also tested a more stringent cut-off, after estimation of the pairwise genetic relationship using all autosomal markers, by excluding one of each pair of individuals with an estimated genetic relatedness of >0.025 (kinship less than 2nd cousins). This led to an exclusion of 2,833 unrelated EA and 1,123 unrelated AA subjects, respectively, resulting in a retained dataset of correspondingly 6,914 and 1,763 genetically “unrelated” EA and AA participants 90.
Blood pressures were measured by a random zero mercury sphygmomanometer following a standard protocol described elsewhere102. The phenotypes used for this
analysis were SBP, DBP and HTN at the first examination (visit). Subjects under antihypertensive treatments were adjusted for potential medication effects by adding 10 and 5 mm Hg to observed SBP and DBP measurements, respectively. Hypertensive participants were defined as either having SBP ≥ 140 mm Hg or DBP ≥ 90 mmHg or using an antihypertensive drug at the time of examination. We fit regression models for SBP, DBP and HTN, separately, after adjusting for the following covariates: sex, age, age squared and body mass index (BMI). The blood pressure traits analyzed here were the residuals from this regression.
To obtain the long-term averaged (LTA) BP traits, we averaged repeated BP measurements for study participants; individuals with four repeated BP measures at least 1 year apart were included in our analyses. At each study visit, we fit a linear regression model by using covariate adjustment in a manner identical to what has been done in first visit to generate visit-specific BP residuals. These residual values were subsequently averaged over all available visits, and the final averaged residual was the LTA trait analyzed (formulated LTA SBP, LTA DBP).
Quality control on genotypes has been described elsewhere101. Nevertheless, after pruning 308 EA and 334 AA individual participants from the raw data as genetic outliers, we performed imputation in EA and AA subjects to the 1000 Genomes reference panel. Imputation in EA participants was performed using a hidden Markov model as implemented in the software packages MaCH (v1.0.16) and Minimac (v4.6) 103. Each chromosome was first phased to estimate haplotypes using MaCH and then the phased haplotypes were used, along with the 1000G Interim Phase I Haplotype reference panel, resulting in >37 million SNPs for imputation using Minimac. Imputation in AA participants was completed with IMPUTE version 2 (v2.1.2) and involved a two-step procedure for each chromosome: phasing to generate haplotype followed by imputation using similar reference panels. Measured SNPs used for imputation were restricted to those with the following features: MAF >0.5%, missing data per SNP < 5%, and Hardy-Weinberg equilibrium (HWE) P >10-5. Of the 839,048 genotyped markers, 656,362 and 772,638 genotyped autosomal SNPs in EA and AA, respectively, passed the initial
quality filters and were used for imputation. In this study, sex chromosomes were excluded from the analysis of blood pressure.
Descriptive statistics and regression of the phenotype on age, age-squared, sex, BMI and PCs, were carried out using R version 2.6.0 (The R Foundation for Statistical Computing). The statistical method utilized here is detailed in Yang et al37. Briefly, a genetic relationship matrix (GRM) for each pair of individuals was calculated as the sum of the products of SNP coefficients between two individuals scaled by the SNP heterozygosity for all genotyped and imputed SNPs across the genome. Subsequently, the GRM was used in a linear mixed model to estimate the variance captured by all the autosomal SNPs via restricted maximum likelihood analysis. This was expressed as a linear function of the total amount of the additive effects due to SNPs associated with causal markers and residual effects: ! = !!! + !
!!
!
!!! + !!!where ! is an ! × 1 vector
of systolic or diastolic blood pressure measurements with ! being the sample size, ! a vector for fixed effects such as sex, age, age squared and BMI, ! the genotype incidence matrix relating to individuals, !! a vector of random additive genetic effects partitioned on aggregate of all autosomal SNPs estimated from whole-genome markers (! = 1;
! = !!! + !
!!
!
!!! + !! ). The proportion of variance explained by whole-genome
markers is the narrow-sense heritability, i.e., ℎ! = ! !
!!/!!!! where !!! is the total
phenotypic variance.
The variance estimate from the entire genome can also be partitioned into non-overlapping subsets of SNPs defined by any specific criteria: if p such classes are considered then !"# !! = ! !!!
!
!!! + ! !!! where !!!is the GRM estimated from the
whole-genome genotyped or imputed markers, !!! is the variance explained by all SNPs,
and ! is a vector of random error effects. The specific partitions we considered were chromosomal number (! = 22; autosomes), minor allele frequency (MAF) class (! = 5; 0-50% in 10% intervals), functional annotation based on location (! = 4; UTRs, coding, intronic, intergenic), and functional annotation based on gene expression related to known cardiovascular or renal associated-genes104and genes annotated by traits and Cardiovascular and Renal Genes related from EMBL-EBI105, 106. Finally, the variance