HAL Id: hal-01868133
https://hal.archives-ouvertes.fr/hal-01868133
Submitted on 5 Sep 2018HAL is a multi-disciplinary open access archive for the deposit and dissemination of sci-entific research documents, whether they are pub-lished or not. The documents may come from teaching and research institutions in France or abroad, or from public or private research centers.
L’archive ouverte pluridisciplinaire HAL, est destinée au dépôt et à la diffusion de documents scientifiques de niveau recherche, publiés ou non, émanant des établissements d’enseignement et de recherche français ou étrangers, des laboratoires publics ou privés.
Ternary diagram: alpha-(3-benzoylphenyl)-propionic
acid (ketoprofen) in acetone-water mixtures at different
temperatures. Experimental data and predicted results
Fabienne Espitalier, Béatrice Biscans, P. Sere Peyrigain, C Laguérie
To cite this version:
Fabienne Espitalier, Béatrice Biscans, P. Sere Peyrigain, C Laguérie. Ternary diagram: alpha-(3-benzoylphenyl)-propionic acid (ketoprofen) in acetone-water mixtures at different temperatures. Ex-perimental data and predicted results. Fluid Phase Equilibria, Elsevier, 1995, 113 (1-2), pp.151-171. �10.1016/0378-3812(95)02806-8�. �hal-01868133�
EQUIUBRIA
ELSEVIER Fluid Phase Equilibria 113 (1995) 151-171
Ternary diagram: alpha-(3-benzoylphenyl)-propionic acid
(ketoprofen) in acetone-water mixtures at different temperatures.
Experimental data and predicted results
F. Espitalier a, B. Biscans a, p. Sere Peyrigain b, C. Lagu6rie aa Laboratoire de G~nie chimique, URA CNRS 192, ENSIGC, 18 chemin de la Loge, 31078 Toulouse Cedex, France b ProSim S.A., 18 chemin de la Loge, 31078 Toulouse Cedex, France
Received 16 September 1994; accepted 16 June 1995
Abstract
Experimental data are determined for a ternary system, ketoprofen-acetone-water, at various temperatures and atmospheric pressure. Specific procedures are applied. The diagram exhibits five regions: one homoge- neous, three two-phase (two liquid-solid and one liquid-liquid equilibria) and one three-phase zones.
The variation of the solubility of ketoprofen in acetone-water mixtures is interpreted by analysing the molecular forces induced in the solution according to the acetone mass ratio in the mixture.
The validity of semi-empirical models is tested for liquid-solid and liquid-liquid equilibria by comparing the calculated values with the experimental ones. The agreement depends on the precision of the estimated parameters used for calculations.
Keywords: Multicomponent; Phase equilibria; Experimental data; Polar interactions; UNIQUAC model
1. Introduction
Liquid-solid equilibria (LSE) and liquid-liquid equilibria (LLE) data are needed in design of crystallization processes. For specific industrial problems, these data are rarely found in literature and must be most of time determined experimentally.
This study deals with a crystallization process in which a pharmaceutical drug, ketoprofen called "Ke" in this work, dissolved in acetone is precipitated out by adding water, acting as an anti solvent, to the solution. The aims of this article are to present experimental equilibria data for the system acetone-water-drug and to examine the validity of the semi-empirical models UNIQUAC for predictions of LLE and LSE, at several temperatures.
0378-3812/95/$09.50 © 1995 Elsevier Science B.V. All rights reserved
152 F. Espitalier et al./ Fluid Phase Equilibria 113 (1995) 151-171
2. Experimental
2.1. MaterialsThe pharmaceutical drug is a well-known antiinflammatory agent under generic name of ketopro- fen. It is racemic a-(3-benzoylphenyl)-propionic acid ( + ) . It is made up of three groups: a phenyl group (-C6H5), a benzoyl group
(-C6H4-CO)
and an acetic chain (-CH-COOH). It is provided by Rhrne-Poulenc Rorer Company.Bidistilled water is used and synthesis grade acetone, with a minimum purity of 99.7%, is purchased from Soci&6 de Distribution de Service et de Recherche.
2.2. Procedure and techniques
Preliminary experiments were carried out, with binary systems (ketoprofen-acetone on the one hand and ketoprofen-water on the other hand), and with the ternary system (ketoprofen-acetone- water), in order to roughly position the different zones of the ternary diagram. These preliminary experiments allowed to set up the experimental techniques. Then, more precise measurements were achieved.
The solubility of ketoprofen in acetone was determined according to an usual procedure (Mullin, 1972) consisting in dissolving periodically small amounts of ketoprofen in acetone contained in a 25 ml stirred vessel maintained at a constant temperature ( T + 0.1 °C). When ketoprofen does not seem to dissolve any more, the suspension is still stirred for a few days more, during which the evolution of the concentration of ketoprofen in acetone is measured. The equilibrium is considered reached when the concentration remains constant. As the experiments proceed, loss of acetone due to evaporation is avoided by condensing the vapor. Sampling of the solution for the measurement of the concentration of ketoprofen in acetone requires stopping the stirring of the suspension for one hour and taking 1-3 ml from the solution with a syringe. The sample is then filtered through a 0.45 /xm porosity membrane and weighed at room temperature. The concentration of ketoprofen is obtained by weighing the dry solid after complete evaporation of the solvent.
The solubility of ketoprofen in water is determined according to the same experimental procedure as that described above. The concentrations of ketoprofen in water are measured by using a high performance liquid chromatograph (HPLC). The maximum relative deviation between all the data has been evaluated to 12% at 30 °C. This maximum can be explained by the difference between the solution temperature (30 °C) and the room temperature (about 20-25 °C) which can induce crystallization of the drug during sampling. However it can be noted that absolute deviations are only a few hundreds of ppm concentrations.
According to the number of the existing phases of the ternary system ketoprofen-acetone-water, three experimental procedures have been used. The first one is the dissolution procedure previously described for liquid-solid equilibria. The second one is a settling procedure for liquid-liquid equilibria. An acetone-water-ketoprofen mixture of about 100 ml, is stirred continuously for one hour in a reactor at a constant temperature controlled by less than + 0.1 °C. After one hour agitation, this mixture is poured into a thermostated settling flask. After twenty four hours settling, the liquid aqueous and organic phases are separated and stored. The concentrations of ketoprofen and water are determined respectively by weighing the dry extract and by measuring out with a Karl Fisher titrator.
-3-
. °
l
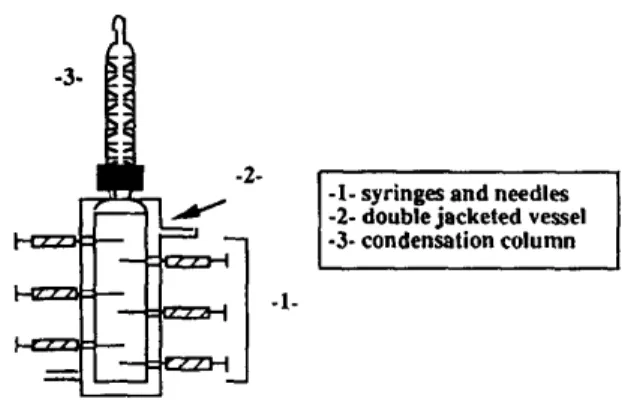
-l- syringes and needles -2- double jacketed vessel -3- condensation column -1-Fig. i. Schematical representation of the reactor used to establish liquid-liquid-solid equilibrium.
The third procedure used is a specific procedure for liquid-liquid-solid equilibria. An acetone- water-ketoprofen mixture, of about 100 ml is also continuously stirred for one hour in a particular reactor at constant temperature. The system is allowed to separate and settle in this reactor whose a schematic representation is shown in Fig. 1. The reactor is a small double jacketed glass vessel with facilities for sampling a few ml of the solution with syringes at various levels. So, syringes permit to take simultaneously samples of the two liquid phases without disturbing the equilibrium.
3. Results
The nature of the observed phases depends on the mass ratio of acetone in acetone-water mixtures ( R a ) .
For weight fractions of acetone in the acetone-water mixtures, R a, ranging approximately between 0 and 0.35, and between 0.70 and 1, a liquid-solid equilibrium is found. A liquid-liquid equilibrium is reached for values of R a between 0.35 and 0.70 and a liquid-liquid-solid equilibria are obtained in the same range of R a (0.35 < R a < 0.70).
3.1. Binary systems
Solubilities of ketoprofen in acetone and in pure water, at atmospheric pressure, are presented in Table 1. The range of temperatures corresponds to that used in the crystallization process studied. The upper limit is fixed by the boiling point of acetone (56 °C). Deviations on the concentration of the
Table 1
Solubility of ketoprofen in pure acetone and in pure water solutions
Temperature (°C) Solvent: acetone WK" e Solvent: water W~-106 (kg ketoprofen/kg solution) (kg ketoprofen/kg solution)
9.8 0.360 _+ 0.003 86 +_ 3 19.8 0.431 + 0.007 20.1 124_+ 1 29.9 0.513 +0.005 30.0 225 _+. 27 41.1 0.613 + 0.005 49.3 0.677 -I-0.006
154 F. Espitalier et aL / Fluid Phase Equilibria 113 (1995) 151-171
Table 2
Solubility of ketoprofen in acetone-water mixture at 20.2 °C (a)
Experimental liquid-solid equilibrium at 20.15 + O. 15 °C
W~e R a (kg ketoprofen/ (kg acetone/ kg solution) kg acetone- water mixture) 151.5 X 10 -6 + 1.5 X 10 -6 0.016 177X 10 -6 + 8 X 10 -6 0.024 337X l0 -6 :t: 12X 10 -6 0.072 1 410.5x 10⁻⁶ +72X 10 -6 0.163 0.498 0.755 0.517 0.786 0.529 0.868 0.502 0.910 0.510 0.941 0.487 0.961 (b)
Experimental liquid-liquid-solid equilibrium at 20.0 + 0.1 °C
wL'q R~q w L °rg R °'~
(kg ketoprofen/ (kg acetone/ (kg ketoprofen/ (kg acetone/
kg solution) kg acetone- kg solution) kg acetone-
water mixture) water mixture)
0.021 0.243 0.482 0.672
(c)
Binodal compositions of the experimental liquid-liquid equilibrium at 20.6 + 0.3 0(2
r (°c) w L aq R~q w L °~g R°'~
(kg ketoprofen/ (kg acetone/ (kg ketoprofen/ (kg acetone/ kg solution) kg acetone- kg solution) kg acetone-
water mixture) water mixture) 20.0 0.058 + 0.0004 0.399 0.358 + 0.002 0.649
20.9 0.087 + 0.001 0.438 0.305 + 0.004 0.626 20.7 0.098 + 0.001 0.458 0.287 + 0.004 0.600 20.6 0.118+0.0003 0.475 0.276+0.0008 0.610
solid in solution are also given in Table 1. The results show a high solubility o f ketoprofen in acetone, and a very low solubility (a few hundreds o f ppm) o f ketoprofen in pure water. In both cases, the solubilities obtained increase with increasing temperature.
3.2. T e r n a r y s y s t e m
Tables 2 - 5 report all the experimental data with their absolute deviation, in ternary mixtures at several temperatures (10.1 + 0.1 °C, 20.2 + 0.2 °C, 30.2 + 0.2 °C and 48.9 + 0.1 °C).
Table 3
Solubility of ketoprofen in acetone-water mixture at 10.1 °C
(a)
Experimental liquid-solid equilibrium at 10.15 4- 0.15 °C
W ~ R a (kg ketoprofen/ (kg acetone/ kg solution) kg acetone- water mixture) 105 X 10 - 6 -t-3 X 10 -6 0.023 199 × 10 -6 4-6 × 10 -6 0.072 623X 10 -6 +31×10 -6 0.151 2 182X l0 -6 0.219 0.410 0.727 0.427 0.773 0.444 0.811 0.447 0.888 0.423 0.906 0.447 0.960 0.416 0,967 (b)
Experimcntal liquid-liquid-solid equilibrium at I O. I + O. l ° C
w~:~ r p W~o °r~ R °r~
(kg ketoprofen/ (kg acetone/ (kg ketoprofen/ (kg acetone/
kg solution) kg acetone- kg solution) kg acetone-
water mixture) water mixture)
0.073 0.462 0.269 0.606
(c)
Binodal compositions of the experimental liquid-liquid equilibrium at 10.0 + 0.1 °C
w ~ q Rp w~o °~ R °rg
(kg ketoprofen/ (kg acetone/ (kg ketoprofen/ (kg acetone/
kg solution) kg acetone- kg solution) kg acetone-
water mixture) water mixture)
0.089 + 0.00001 0.474 0.304:1:0.00006 0.657
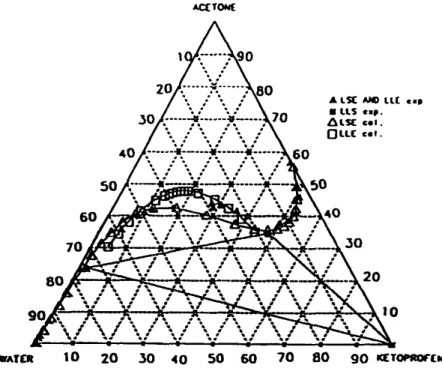
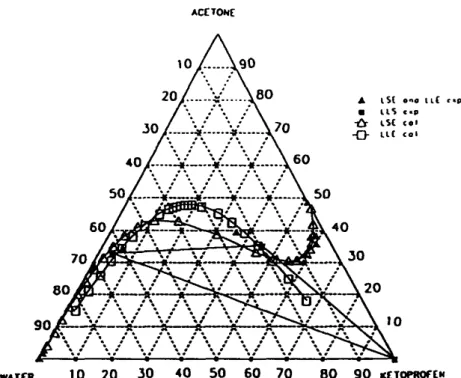
Table 2 shows that the solubility of the drug at 20.2 °C slightly increases with the weight fraction of acetone for R a < 0.24. The increase becomes more abrupt as Ra increases, up to a liquid-liquid phase splitting ( R a = 0.24). The solubility reaches a maximum for a value of R a in the interval contained between 0.90 and 0.95 kg acetone k g - 1 acetone-water mixture. All these results are plotted in the ternary diagram illustrated in Fig. 2 at 20.2 °C. So, in acetone-water mixtures, depending on the acetone mass ratio, two phases (liquid-liquid or liquid-solid phases) are in equilibrium. These liquid-liquid and liquid-solid zones surround a three-phase area (liquid-liquid-solid). The different one-phase, two-phase and three-phase regions are indicated in Fig. 2 by the regions I, II, III.
The same trends have been observed for the other temperatures (Tables 3-5). The curves corresponding to 10.1, 20.2, 30.2 and 48.9 °C have been gathered on the same ternary diagram in Fig. 3.
! 56 F. Espitalier et a L / Fluid Phase Equilibria 113 (1995) 151-171
Table 4
Solubility of ketoprofen in acetone-water mixture at 30.2 °C
(a)
Experimental liquid-solid equilibrium at 30.15 5:0.15 °C
Wi~e Ra (kg ketoprofen/ (kg acetone/ kg solution) kg acetone- water mixture) 261X 10 -6 5:27X 10 -6 0.017 261X 10 -6 5:17.10 -6 0.026 0.550 0.669 0.577 0.730 0.596 0.747 0.589 0.796 0.576 0.896 0.602 0.902 0.589 0.934 (b)
Experimental liquid-liquid-solid equilibrium at 30.0 + 0.1 °C
Wi~eaq Raaq w,, Ke°rg -'aR°rg
(kg ketoprofen/ (kg acetone/ (kg ketoprofen/ (kg acetone/ kg solution) kg acetone- kg solution) kg acetone-
water mixture) water mixture)
0.038 0.342 0.452 0.646
(c)
Binodal compositions of the experimental liquid-liquid equilibrium at 30.4 5: 0.1 °(2
WK~Ie ga aq Wl~e °rg -'aR°rg
(kg ketoprofen/ (kg acetone/ (kg ketoprofen/ (kg acetone/ kg solution) kg acetone- kg solution) kg acetone-
water mixture) water mixture)
0.058 + 0.0007 0.367 0.359 + 0.004 0.624
Table 5
Solubility of ketoprofen in acetone-water mixture at 48.9 °(2: experimental liquid-solid equilibrium
WZ
(kg ketoprofen/kg solution) R a (kg acetone/ kg acetone-water mixture) 0.703 0.852 0.710 0.924 0.701 0.950 0.695 0.967ACIE TON(
WAT(R 10 20 .30 40 .50 60 70 80 90 V.ETemU~'I:N
Fig. 2. Five different zones in the ternary diagram studied: one L area, two LSE area, one LLE area and one LLSE area. Experimental data at 20.2 °C. AC[TON( WATIER • T = 10.I° C • T = 20.2° C A T = 30.2° C ta T = 4 8 . 9 ° C 10 20 50 40 50 GO 70 BO g o t(T~aOftN
158 F. Espitalier et al. / Fluid Phase Equilibria 113 (1995) 151-171
In the liquid-solid regions, the solubility of ketoprofen increases with temperature. However the influence of the temperature in these solid-liquid regions is much more important for high values of R a on the right side of the phase diagram than for small ones on the left side.
A comparison between the liquid-liquid regions obtained respectively at 10.1 °C and 20.1 °C shows that this region is reduced as the temperature decreases. But this tendency is reversed when comparing the experimental points at 20.2 0(2 and 30.2 0(2. This last observation is probably due to the increase of experimental errors at 30.2 °C.
4. Discussion
Several observations can be drawn from the experimental data with binary and ternary systems. First, let us deal with the difference of the solubility of ketoprofen according to the nature of the pure solvent used in the case of binary solutions.
The structure of the crystals has been modeled by using a molecular simulation software (Cavalier-Frontin et al., 1992). It has enabled us to build an elementary lattice of a crystal and a combination of elementary lattices. The atomic coordinates of ketoprofen crystal used have been given by Briard and Rossi (1990), from a crystallographic study. This representation shows that the crystal exhibits more numerous hydrophobic faces
(-C6H 5)
than hydrophilic ones (-COOH). So water keeps its maximally hydrogen-bonded and voluminous structure in front of the hydrophobic faces and the drug is weakly soluble in water. On the contrary, acetone exhibits charges all along itsH
I
Ell.- C- C - H
a tO I
N .
Fig. 4. Schematic representation of molecular interactions between the two components: ketoprofen-acetone.
100 0 -100 -200 -300 AHmix C3 (cal/mol) c2 w • CI • • R a
(kg acetone/kg acetone-water mixture)
,o
0,0 0,2 0,4 0,6 0,8 1
structure so that hydrogen bonds are created with the ketoprofen molecules. Fig. 4 gives a schematic representation of the interactions occuring.
We have calculated the solubility of ketoprofen in acetone versus temperature, in the case of an ideal solution. The experimental solubility is 40% higher than the calculated one. This difference may be explained by the strong polar solvent-drug interactions which cannot be neglected when calculating activities of the components of the system (Bustamante and Selles, 1983).
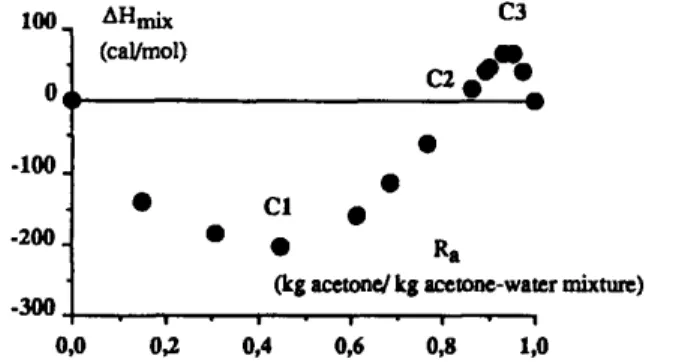
In the case of the ternary system, it can also be referred to interactions between acetone and water. Mixtures of both species exhibit changes of structure with acetone mass ratio, R a. For example, these changes of structure affect the enthalpy of mixtures. Indeed, the study of the enthalpy of acetone-water mixture, AHmi x, presents a particular behaviour versus acetone mass ratio as given in Fig. 5 (Timmermans, 1960). It shows that AHmi x is negative for R a < 0.85 and becomes positive for R a >__ 0.85. It can be assumed that the enthalpy of mixing, AH,~ x, is the result of two additional thermal effects (Franks and Ives, 1966): the endothermic destruction of water-water hydrogen bonds and the exothermic formation of rather strong and well-organized acetone-water hydrogen bonds. It may be inferred that intercomponent attractions are dominant factors in the formation of acetone-water mixtures and in the formation of ketoprofen-acetone water mixtures.
Fig. 5 brings to the fore three particular points marked C1, C2, C3. Point C2 corresponds to R c2 = 0.85 for which the enthalpy is equal to zero. Points C 1 and C3 are respectively the minimum for R cl = 0.45 and the maximum f o r Ra c3 = 0.92 of the enthalpy curve. These particular ratios, Ra c~,
C2 C3
R a , R a , can be compared to particular ratios, Ra Tl, R ~ , R T3, appearing in the ternary diagram of Fig. 2.
c~
In the acetone-water mixture, for an acetone mass ratio less than R a , the enthalpy of the mixture is negative and its absolute value increases as the acetone mass ratio increases: the number of hydrogen bonds between water molecules and acetone molecules increases. In the presence of ketoprofen, whose molecule has a ketone functional group in the acetic chain, the number of hydrogen bonds between water molecules, acetone molecules and ketoprofen molecules also in- creases. Thus, the solubility of ketoprofen in the mixture increases. In fact, the ternary diagram shows that the maximum solubility of ketoprofen is observed with an acetone mass ratio, R~ t, equal to approximately 0.24.
For R a between Rct and Ra c2, i.e. between C1 and C2, the number of hydrogen bonds between water molecules and acetone molecules is important but decreases as the absolute value of
Anraix
decreases. In fact, in the ternary system, two liquid phases are in equilibrium for R a between 0.24 and 0.67. Moreover liquid-liquid phase splitting occurs for Ra T1 = 0.24, at 20.0 °C.For an acetone mass ratio equal to R c2 (point C2 in the Fig. 5), AHmi x is equal to zero. In the ternary mixture, the ratio corresponding to the change of two liquid phases in one liquid phase is 0.67. It can be compared with the point where AHm~ x is equal to zero.
As the acetone mass ratio increases between Ra c2 and R C3, the positive enthalpy of binary mixture increases: the number of hydrogen-bonded water molecules decreases; thus in the ternary mixture, the solubility of ketoprofen increases. On the ternary diagram the maximum solubility is obtained for R T3 equal to 0.90-0.95.
For an acetone mass ratio above 0.92, the number of hydrogen-bonded water molecules increases, and this increase explains the observed decrease of the solubility of ketoprofen in the ternary mixture. The previous comparisons between the particular ratios appearing in the enthalpy diagram and those obtained in phase diagram, have shown the influence of ketoprofen. Indeed, the presence of
160 F. Espitalier et al./ Fluid Phase Equilibria 113 (1995) 151-171
ketoprofen in the mixture moves back the positions of the particular ratios obtained in the enthalpy diagram.
All this development has been made for a temperature of 20 °C. The behaviour of the ternary system at 10.1 or at 30.2 °C is similar to the one at 20.2 °C as shown in Fig. 3. But the particular ratios, RaT l, R ~ , R T3 a r e function of temperature.
5. Representation model for LSE
In the case of solute solid, the condition of equality of partial fugacities at equilibrium leads to the reduced relation (Walas, 1985):
, L=exp( m(1 1))
Xsgs ~ T m T (1)
with xL: mol fraction of the solute, S, in the solution TsL: activity coefficient of the solute, S, in the solution
AHm:
melting enthalpy of the pure solid (J mol -l)Tm:
melting temperature of the solid (K)The required input data on ketoprofen are the melting enthalpy, A H m, the melting temperature, Tin, and the activity coefficient, ca~ ')tKe.
A H m and T m have been obtained for pure solid component by differential scanning calorimetry (DSC). They are respectively equal to 28,226 + 254 J mol -I and 94.21 + 0.5 °C.
The LSE is calculated to find the optimal value of parameters by minimizing the difference between computed and experimental activity coefficients, T~ ale - T~ xp.
Using the same model for liquid phase activity coefficients, calculated either from measurements of vapor-liquid equilibria (VLE) or liquid-liquid equilibria (LLE), or liquid-solid equilibria (Walas, 1985), we have considered reasonable to choose the UNIQUAC model (Abrams and Prausnitz, 1975) to estimate 3t~ ~ac in the liquid phase.
The UNIQUAC model has a combinatorial contribution to the activity coefficients, essentially due to the differences in size and shape of the molecules, and a residual contribution essentially due to energetic interactions:
In ~/i = In Ti c + In T 3 (2)
The combinatorial term can be written as follows:
Z 0i (~i
In TiC = In q~i + - * qi * i n - - + l i - - - * ~ x j l j (3)
X i 2 $ i Xi j
where z is the coordination number, equal to 10;
Z
0 i and thi are the molecular surface area and molecular volume of each component i with r i X i 4'i = (5)
Exjq
J qi xi 0 i = ~ ( 6 ) E xj qj Jx~ is the mol fraction of the component i.
Pure components parameters r i and qi are, respectively, determined from measurements of molecular van der Waals volumes and molecular surface areas. They are calculated as the sum of the group-volume and group-area parameters, R k and Qk:
r i = Eu(ki)Rk and qi = EU(ki)Qk (7)
where u °), always an integer, is the number of groups of type k in the molecule i. Group parameters R k and Qk are obtained from van der Waals group volumes V k and surface areas A k (Bondi, 1964). The expression of R k and Qk can be given as follows:
Vk
e k = 15.17 (8)
Ak
Qk = 2.5 * 109 (9)
The normalization factors appearing in Eqs. (8) and (9), 15.17 and 2.5* 10 9 are those derived by Abrams and Prausnitz (1975).
However, since data for the benzoyl group are not available, this group has been decomposed into two independent groups, C6H 4 and C = O, The van der Waals group volumes, Vk, and surface areas, A k of > C = O group are given by Bondi (1964). The other volume and surface factors of others groups have been found in Walas (1985).
The expression of the residual term, in UNIQUAC equation, is:
with
~'ij = exp(
uiJ'e'-T ) - - nil(10)
(11)
Table 6
Volume and surface factors, r i and qi, calculated from data given by Walas, 1985
System Volume factor Surface factor
Ketoprofen 9.2979 6.900
Acetone 2.5735 2.336
162 F. Espitalier et al. / Fluid Phase Equilibria 113 (1995) 151-171
Table 7
Parameters of the UNIQUAC model for the system studied, LSE
System i-i Uij (J mol-t)
Ketoprofen(1 ) - 1 - 2 - 746.25 Acetone(2) 2-1 747.13 Ketoprofen(1)- 1-3 2 931.03 Water(3) 3-1 - 103.68 Acetone(2)-water(3) 2-3 3 744.90 3-2 - 866.76
The uij are the interaction parameters between the two components i and j. They can be found in tables.
These factors, r i and qi, are reported in Table 6. The calculated values of ketoprofen volume and surface factors are high compared with the values obtained for the other components.
6. Representation of the ternary system
The validity of the semi-empirical models which represent L L E and LSE have been tested.
The parameters, uij and uji of the tested semi-empirical UNIQUAC model are not available in tables and have been evaluated for each particular binary system. The parameters of the system a c e t o n e - w a t e r are deduced from VLE data using the P R O R E G regression tool designed by PROSIM
,Ju~ rod~[ 2 0
I -..j-...i- -..../\
o , . - , .
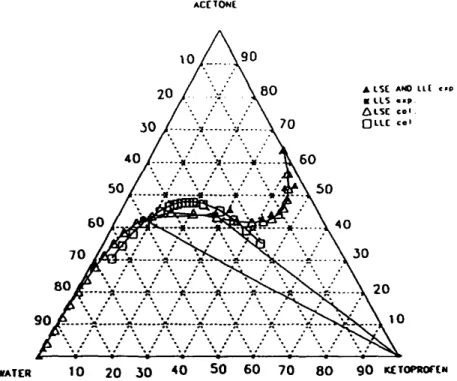
• o • • .'% :% ~%-- / • • • 9 0 ~ : A o"~ .'N P'. A . . - ~ P-. "~-'~'~ W A l ' l ~ 10 20 30 40 50 60 70 80 9 0 mETOe,~of(NFig. 6. Predicted LLE and LSE data (after adjustment of the interaction parameters between ketoprofen and water) and experimental data at 20.2 °C.
Table 8
Relative deviations between the calculated and the experimental concentrations of ketoprofen function of R a at 10.1 °C
(l,I/cal _ IMexp~ ) k"Ke "Ke ]
w'exp as a - Ke
Ra (kg acetone/ Absolute deviations Relative deviations
kg acetone-water) (kg ketoprofen/kg solution) on concentration (%)
0 2X10 -6 2 0.023 1 × 10 -6 1 0.072 37 X 10 -6 19 0.151 291 X 10 -6 47 0.219 1 563× 10 -6 72 0.727 0.327 80 0.775 0.292 68 0.811 0.257 58 0.888 0.147 33 0.906 0.102 24 0.960 0.088 20 0.967 0.055 13 1 0.001 0.2
Company (ProSim S.A., 1993). For the systems, ketoprofen-acetone and ketoprofen-water, these
parameters were computed from the experimental mutual solubility data, by minimization of the
( ~ / ~ C -- ~/~(xeP ) ( 'ysCo~lvCent -- '~seo~Pen t )
differences
,~expand
,~expKe tsolvent
The parameters, aij and aji, obtained are given in Table 7.
Table 9
Relative deviations between the calculated and the experimental concentrations of ketoprofen function of R a at 20.2 °C
w~
-woxp~ )
"Ke ] I,U exp as a "Ke
R a (kg acetone/ Absolute deviations Relative deviations
kg acetone-water) (kg ketoprofen/kg solution) on concentration (%)
0 13×10 -6 11 0.016 7 × 1 0 -6 5 0.024 6 × 10 -6 3 0.072 73 × 10 -6 22 0.163 804X 10 -6 57 0.755 0.303 61 0.786 0.261 50 0.868 0.136 26 0.910 0.072 14 0.941 0.064 13 0.961 0.036 7 I 0.015 4
164 F. Espitalier et al. / Fluid Phase Equilibria 113 (1995) 151-171
Table 10
Relative deviations between the calculated and the experimental concentrations of ketoprofen function of R a at 30.2 °C
[ i M c a l _ 1Mexp~ )
~, "Ke "Ke ]
v v ~ as a
R a (kg acetone/ Absolute deviations Relative deviations
kg acetone-water) (kg ketoprofen/kg solution) on concentration (%)
0 8 × 1 0 -6 3 0.017 8 × 10 -6 3 0.026 14× 10 -6 5 0.669 0.408 74 0.730 0.295 51 0.747 0.268 45 0.796 O. 156 27 0.896 0.046 8 0.902 0.070 12 0.934 0.048 8 1 0.019 4
The calculated and experimental solubilities in the binary liquid-solid zones are shown at 20.2 °C in Fig. 6. It is important to note that the form of the calculated curve is very similar to the experimental one. Moreover this curve seems able to describe all regions, even the liquid-liquid region. This continuity can be explained by that of the thermodynamic equations used.
However, when comparing with experimental data, the UNIQUAC model gives underestimated concentrations of ketoprofen when the mass ratio of acetone is higher than 0.75. The relative deviations between the calculated and the experimental concentrations of solute
vvKe ~ rvK¢
~v~x~" * 100 as a function of R a are reported in Tables 8-11, for the different tempera-
" K e
tures. For acetone-water mixtures with a high mass ratio of acetone, the deviation increases as R a decreases. So the concentrations of ketoprofen are underestimated (until 80% at 10.1 °C). For acetone-water mixtures with R~ less than 0.075, there is a good agreement between experimental and
Table 11
Relative deviations between the calculated and the experimental concentrations of ketoprofen function of R a at 48.9 °C
(c.
(w~ - ~ ' ~ "'Ke ])
U/exp "Ke
as a
R a (kg acetone/ Absolute deviations Relative deviations
kg acetone water) (kg ketoprofen/kg solution) on concentration (%)
0.852 0.007 1.0
0.924 0.002 0.2
0.950 0.003 0.4
0.967 0.005 1
Table 12
Relative deviations between the calculated and the experimental concentrations of ketoprofen as a function of R a at 10.1 °C (after adjustment of the interaction parameters between ketoprofen and water)
Ra(kg acetone/ Absolute deviations Relative deviations
kg acetone-water) (kg ketoprofen/kg solution) on concentration (%)
AAD = 2 650× 10 -6 ARD -- 820 0 1 001 × 10 -6 1 164 0.023 1 228× 10 -6 1 170 0.072 1 865 × 10 -6 937 0.151 3 566 × 10 -6 572 0.219 5 589× 10 -6 256 AAD = 0.013 ARD = 2.9 0.727 0.011 3 0.775 0.015 3 0.811 0.005 1 0.888 0.002 0.3 0.906 0.017 4 0.960 0.037 8 0.967 0.013 3 1 0.001 0.2 c a l c u l a t e d d a t a ( r e l a t i v e e r r o r is l o w e r t h a n 10.%). H o w e v e r f o r R a h i g h e r t h a n 0.075, t h e k e t o p r o f e n c o n c e n t r a t i o n s a r e u n d e r e s t i m a t e d too. A c c o r d i n g to t h e p r i n c i p l e o f t h e m e t h o d , t h e c a l c u l a t e d c o n c e n t r a t i o n s d i r e c t l y d e p e n d o n the e s t i m a t e d U N I Q U A C p a r a m e t e r s . A n a n a l y s i s o f the v a l u e s o f t h e s e p a r a m e t e r s c a n e x p l a i n t h e r e p o r t e d e r r o r o n t h e p r e d i c t e d v a l u e s . In b i n a r y m i x t u r e s k e t o p r o f e n - w a t e r , w i t h a l o w k e t o p r o f e n Table 13
Relative deviations between the calculated and the experimental concentrations of ketoprofen as a function of R a at 20.2 °C (after adjustment of the interaction parameters between ketoprofen and water)
R a (kg acetone/ Absolute deviations Relative deviations
kg acetone water) (kg ketoprofen/kg solution) on concentration (%)
0 AAD = 2 197× 10 -6 ARD = 481 0.016 916× 10 -6 738.5 0.024 1048 × 10 -6 691.8 0.072 1111 × 10 -6 628.0 0.163 1644× 10 -6 487.9 3099× 10 -6 219.8 AAD = 0.009 ARD = 1.7 0.755 0.007 1.5 0.786 0.003 0.5 0.868 0.011 2.1 0.910 0.007 1.5 0.941 0.014 2.6 0.961 0.003 0.6 1 0.015 3.5
166 F. Espitalier et al. / Fluid Phase Equilibria 113 (1995) 151-171
Table 14
Relative deviations between the calculated and the experimental concentrations of ketoprofen as a function of R a at 30.2 °C
(after adjustment of the interaction parameters between ketoprofen and water)
R a (kg acetone/ Absolute deviations Relative deviations
kg acetone water) (kg ketoprofen/kg solution) on concentration (%) AAD = 904.3 × 10 -6 ARD = 376 0 813 X 10 -6 361 0.017 949 × 10 - 6 363 0.026 1 051 × 10 -6 403 AAD -- 0.010 ARD -- 1.8 0.669 0.005 1 0.730 0.001 0.2 0.747 0.012 2 0.796 0.004 1 0.896 0.011 2 0.902 0.017 3 0.934 0.014 2 1.0 0.019 4
content (hundreds o f ppm), the activity coefficients o f ketoprofen are very high (about 10000). It is well k n o w n that these semi-empirical models do not give good predictions for high activity coefficients.
So, in order to take into account the overestimation o f the interaction parameters, these ketopro- f e n - w a t e r parameters have been re-calculated from experimental data obtained in the ternary system, at each temperature, and in the range o f high R a value ( R a > 0.70). Indeed, the highest absolute deviations are obtained in this range.
Tables 1 2 - 1 5 report the absolute and relative deviations between calculated and experimental data, as a function o f R a, after adjustment o f the interactions parameters k e t o p r o f e n - w a t e r and w a t e r - k e t o - profen respectively at 10.1, 20.2, 30.2 and 48.9 °C. The absolute deviations are considerably reduced for high values o f R a and the agreement is quite good. The same adjusted parameters have been used to calculate the concentrations in the smallest range o f R a. The results remain reasonably good, for the range o f considered concentrations. For 48.9 °C, only few experimental points are available
Table 15
Relative deviations between the calculated and the experimental concentrations of ketoprofen as a function of R a at 48.9 °C (after adjustment of the interaction parameters between ketoprofen and water)
R a (kg acetone/ Absolute deviations Relative deviations kg acetone water) (kg ketoprofen/kg solution) on concentration (%)
AAD -- 0.004 ARD -- 0.7 0.852 0.002 0.2 0.924 0.006 1 0.950 0.000 0 0.967 0.003 0.5 1 0.011 2
Table 16
Parameters of the UNIQUAC model for the system studied, LLE
System i - j ~ (J mol-L) Ketoprofen(1)- 1-2 - 1059.12 Acetone(2) 2-1 1 404.23 Ketoprofen(l)- 1-3 673.18 Water(3) 3-1 - 125.79 Acetone(2)-water(3) 2-3 3 744.80 3 - 2 - 866.76
because this temperature is very close to the upper limit of stability of the system. So, in that case, the predicted values must to be regarded with less confidence.
6.1. LLE evaluation method
As LLE data on the binary mixtures of ketoprofen-acetone and ketoprofen-water mixtures, is not available, the parameters of the UNIQUAC model were evaluated from smoothing experimental LLE data at 20.2°C. These parameters are presented in Table 16. They have also been used to calculate the LLE at the other temperatures (10.1 and 30.2 °C) by using PROPHY software (ProSim S.A., 1993).
6.2. LLSE evaluation method
Figs. 6-9 present predicted and experimental curves for both LLE and LSE respectively at 20.2, 10.1, 30.2 and 48.9 °C. They show that liquid-liquid equilibria slightly depend on the temperature.
AC[ TON[
/ -....~...: \ , ~ c ....
o
8 0 2 0
wATER 10 20 30 40 50 60 70 8 0 9 0 r~roe,t~-cN
Fig. 7. Predicted LEE and LSE data (after adjustment of the interaction parameters between ketoprofen and water) and experimental data at 10.1 °C.
168 F. Espitalier et a l . / Fluid Phase Equilibria 113 (1995) 151-171 ACE TONE
,o o
2o/...:?:: ...
.~8/',
.. ,. :"\o
: ~ :::
,...,, .~0/ ' ~ / ~ - - - \ / \ / ":'.'"'_'X" \ Z n -(3- o Lst,0, tic ,,, i , ; . _ _ , , _ ; \ • o WAT(R 10 20 30 40 50 60 70 8 0 go ~OETOPROftNFig. 8. Predicted LLE and LSE data (after adjustment of the interaction parameters between ketoprofen and water) and experimental data at 30.2 °C.
~ : ~ 0 70 ~ ts( , . ,
w^T(~ 10 20 ~0 40 50 60 70 80 90 J~:TO~(N
Fig. 9. Predicted and experimental data in LSE at 48.9 °C (after adjustment of the interaction parameters between ketoprofen and water).
The superposition of LLE and LSE predicted curves should allow us to obtain the complete ternary diagram. In the range of high
Ra,
the intersection point, T2, between the LLE and the LSE predicted curves, is in good agreement with the experimental point. But for small Ra, the intersection between LLE and LSE curves creates a point T1 that does not correspond to the experimental point. The level of agreement between the calculated and experimental intersection points (T1 and T2) depends on the results of prediction of LSE previously discussed. Since T2 corresponds to the experimental point, TI can be deduced by the following procedure: by creating the first intersection point T2 (in the Fig. 6, for example at 20.2 °C), LLE allows to join the corresponding point T1, by the tie-line. To avoid the discontinuity between LLE and LSE at small R a values, the tie-line has been extended up to the calculated LSE curve.7. Conclusion
Experimental and calculated equilibrium data have been determined for the organic system ketoprofen-acetone-water at four temperatures (10.1, 20.2, 30.2 and 48.9 °C).
The experimental diagram exhibits five regions: one homogeneous, three two-phase (two liquid- solid and one liquid-liquid equilibria) and one three-phase zones. Specific experimental procedures have been applied to determine the liquid-liquid and the liquid-liquid-solid equilibria.
The behaviour of the mixtures has been explained by ketoprofen-water, ketoprofen-acetone and acetone-water interactions (hydrogen bonding).
We applied the UNIQUAC model to calculate the LSE and LLE for this system. For LSE, since the interaction parameters, ketoprofen-water and ketoprofen-acetone did not exist, they have been evaluated for each binary system from experimental data. To obtain a better agreement between experimental and calculated data, the interaction parameters ketoprofen-water have been recalculated from experimental data in the ternary system, at each temperature. After adjustment of these last parameters, the results of the semi-empirical model UNIQUAC are in agreement with experimental LSE data. For LLE, we have evaluated the missing parameters from smoothing experimental data at 20.2 °C (PROSIM). The obtained parameters have been used to calculate the LLE at the other temperatures. Finally prediction of the temary diagram can be carried out by the presented methods.
8. List of symbols A k AAD ARD li N~xp qi
Van der Waals surface area of group or component k (cm2/mol) ElWieXp- WiC~ I
average absolute deviation: AAD =
Nexp
average relative deviation AAD = wiexp (%)
N~xp pure-component constant defined in Eq. (4) (-) number of experimental data (-)
170 F. Espitalier et al. / Fluid Phase Equilibria 113 (1995) 151-171 O k R Rk Ra r i T
rm
uijVk
Ws*
X i Zgroup area parameter for group k (-) ideal gas constant (J mol-i
K)
group volume parameter for group k (-)
acetone mass ratio (kg of acetone kg-1 of acetone-water mixture) UNIQUAC group volume parameter of pure component i (-) temperature (°C)
melting temperature of the solid (K)
UNIQUAC binary interaction parameter (J mol - l )
Van der Waals volume of group or component k (cm 3 mol- 1 × 10 9)
solubility of solid, S (kg of S kg- l of solution) mol fraction of component i (-)
coordination number, z = 10, (-) 8.1.1. Greek letters
zan=x
aHm
4'i
"Yi ri 0i ~'ijenthalpy of mixture (cal mol-I) enthalpy of melting (J mol-I)
molecular volume of component i (-) activity coefficient of component i (-)
combinatorial contribution of activity coefficient of component i (-) residual contribution activity coefficient of component i (-)
integer number of groups of type k in the molecule i (-) molecular surface area of component i (-)
UNIQUAC parameter see Eq. (11) (-)
8.1.2. Subscripts
aq aqueous liquid phase i,j components i and j org organic liquid phase
8.1.3. Superscripts cal calculated exp experimental Ke ketoprofen L liquid phase S solid solute
Acknowledgements
The authors wish to acknowledge Rhrne-Poulenc-Rorer Company and the French Ministry of University Education and Research (MESR) for their financial supports to this project.
References
Abrams, D.S. and Prausnitz, J.M., 1975. Statistical thermodynamics of liquid mixtures: A new expression for the excess Gibbs energy of partly or completely miscible systems. AIChE J., 21:116-128.
Briard, P. and Rossi, J C., 1990. Ketoprofene. Acta Cryst. C46: 1036-1038.
Bondi, A., 1964. Van der Waals Volumes and Radii. J. Phys. Chem., 68(3): 441-451.
Bustamante, P. and Selles, E., 1983. Prediccion de la solubilidad seghn Martin: Aplicacibn al ketoprofeno en mezclas polares. C.I.F. 2 (2. a 6p.): 403-407.
Cavalier-Frontin, F.; P~pe, G.; Verducci, J., Siri, D. and Jacquier, R.; 1992. Prediction of the best linear precursor in the synthesis of cyclotetrapeptides by molecular mechanic calculations. J. Am. Chem. Soc., 114: 8885-8890.
Franks, F. and Ives, D.J.G., 1966. The structural properties of alcohol-water mixtures. Quat. Rev., 20(1): 1-44. Mullin, J.W., 1972, Crystallization. Butterworth, London, pp. 41-42.
ProSim S.A., 1993, Manuel technique.
Timmermans, J., 1960. The physico-chemical constants of binary systems in concentrated solutions, Interscience, New York, Vol. 4, pp. 32-47.