Fatigue models for life prediction of structures under multiaxial loading with variation in time and space.
Texte intégral
Figure
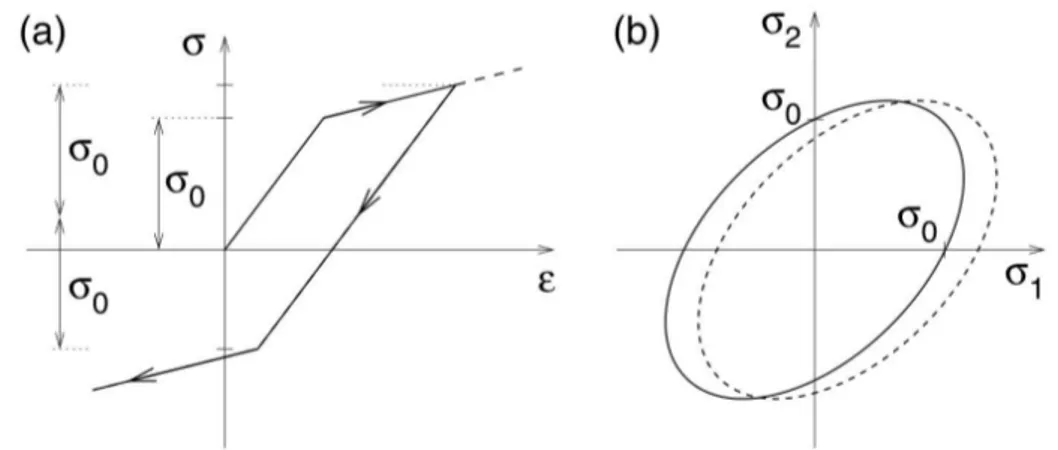
![Figure 2.5 – Finding the appropriate state for an affine load path A-B( Koutiri [ 2011 ]).](https://thumb-eu.123doks.com/thumbv2/123doknet/2625345.58729/45.892.143.732.437.614/figure-finding-appropriate-state-affine-load-path-koutiri.webp)


Documents relatifs
Besides the still not completely solved problems of lower ductility and frac- ture toughness values of Li-containing alloys in comparison to con- ventiona1
Using our new reduction, we prove that if there is any i-normal execution of a lazy distributed firing squad protocol in which the correct processors fire
Pourtant il affirme qu’elle « n’a qu’un certain degré de validité » et prend l’exemple de la chambre d’hôtel : elle « est un territoire situationnel qui, pourtant, dans
We think that there is a high likelihood that commons grabbing occurs when LSLAs involve land that is subject to multiple access and/or property rights, when this occurs with
2 ةنراقملا لودلل ةيلخادلا ةحايسلا ريوطت يف ةيرامثتسلاا جماربلا ريثأت ىدم ةساردلا هذه تلوانت ، سنوت ( ةرتفلا للاخ ) رئازجلا 1994 - 2017 يف كلذو ،
En passant de la production à la commercialisation, et de la vente au détail à la vente grossiste, les Boliviens (plus que d’autres migrants limitrophes) sont présents et
(2009) ont proposé l’algorithme du score de propension en grande dimension (high-dimensional Propensity Score, hdPS) pour sélectionner de manière automatique les variables à
Indeed, thorough econometric modelling of the province’s main economic indicators has shown no significant causal relation between political instability and GDP, employment
