DIAL • 4, rue d’Enghien • 75010 Paris • Téléphone (33) 01 53 24 14 50 • Fax (33) 01 53 24 14 51 E-mail : [email protected] • Site : www.dial.prd.fr
D
OCUMENT DE
T
RAVAIL
DT/2006-01
The determinants of subjective
poverty: A comparative analysis
between Madagascar and Peru
Javier HERRERA
Mireille RAZAFINDRAKOTO
François ROUBAUD
THE DETERMINANTS OF SUBJECTIVE POVERTY: A COMPARATIVE
ANALYSIS BETWEEN MADAGASCAR AND PERU
Javier Herrera IRD-Paris, DIAL [email protected] Mireille Razafindrakoto IRD-Paris, DIAL [email protected] François Roubaud IRD-Paris, DIAL [email protected] Document de travail DIAL
Janvier 2006
ABSTRACT
The multidimensionality of poverty is now fully acknowledged. A number of studies show a weak correlation between the monetary approach to poverty and household's subjective perception of well-being. Recent studies in developed countries demonstrate that well-being is not only based on monetary income or consumption, but also on other factors such as employment and health. This paper examines the factors that determine households’ subjective evaluation of their living standards, through a comparative analysis in two developing countries, Peru and Madagascar. Our study is based on a first-hand database grouping objective individual variables (the households’ socio-economic characteristics, environment and individual trajectories, provided by the two surveys’ panel studies), and identical questions on subjective well-being for both countries. How much do income levels influence households' welfare perceptions? Do these depend on the level of income and/or the relative position with respect to a given reference group? Apart from income, does the type of labour market inclusion or job quality have a significant impact on subjective well-being? To what extent do individual trajectories and local environment affect well-being (social origin, spatial inequalities in the district)? Finally, how important are the new dimensions of poverty such as vulnerability and social and political exclusion?
Key Words : Subjective wellbeing, poverty, peer group effects, capacity to aspire, relative income,
panel data, Madagascar, Peru.
RESUME
Le caractère multidimensionnel de la pauvreté est aujourd'hui universellement reconnu. Un certain nombre d'études montrent une faible corrélation entre l'approche monétaire de la pauvreté et la perception des ménages de leur bien-être. Des travaux récents ont pu montrer que, dans les pays développés, cette dernière ne dépend pas seulement du niveau de revenu ou de consommation, mais aussi d'autres facteurs (emploi, santé, etc.). Cette contribution se propose d'explorer les facteurs qui déterminent l'évaluation subjective des ménages de leur niveau de vie à partir d'une analyse comparative portant sur deux pays en développement, le Pérou et Madagascar. Pour ce faire, l'étude mobilise une base de données originale, comptant à la fois des variables individuelles objectives (caractéristiques socio-économiques des ménages, environnement et trajectoires individuelles obtenues grâce à la dimension panel des deux enquêtes), ainsi que des mesures subjectives du bien-être identiques pour les deux pays. Quelle est la contribution du revenu à la perception du bien-bien-être ? Celle-ci dépend-elle du niveau de revenu et/ou de la position relative par rapport à un groupe de référence qu'il convient d'identifier ? Au-delà des revenus, le type d'insertion sur le marché du travail et la qualité de l’emploi ont-ils une influence significative sur le bien-être subjectif ? Dans quelle mesure la trajectoire d’un individu et son environnement immédiat jouent sur son bien-être (origine sociale, inégalités spatiales au niveau du quartier) ? Enfin, quel est le poids des nouvelles dimensions de la pauvreté telles que la vulnérabilité et l’exclusion sociale et politique ?
Mots clés : Bien-être subjectif, pauvreté, groupes de comparaison, aspirations, revenu relatif, données
de panel, Madagascar, Pérou.
Table des matières
1. INTRODUCTION ... 4
2. ANALYSIS OF SUBJECTIVE WELL-BEING: REVIEW OF EXISTING LITERATURE... 5
3. MADAGASCAR-PERU: PRESENTATION OF ECONOMIC CONTEXT AND DESCRIPTION OF DATA... 8
3.1. Socio-economic context ... 8
3.2.The data ... 9
4. DESCRIPTIVE ANALYSES : HOUSEHOLDS’ SUBJECTIVE EVALUATION OF THEIR LIVING STANDARDS ... 10
4.1.Subjective perception and the reference group ... 12
4.2.Multidimensionality of poverty ... 14
5. MULTIVARIATE ANALYSES: THE DETERMINANTS OF SUBJECTIVE WELL-BEING ... 15
5.1.The hypotheses tested... 16
5.2.The results ... 17
6. CONCLUSIONS ET PROSPECTS ... 23
BIBLIOGRAPHY ... 25
Liste des tableaux
Table 1: Madagascar and Peru in figures (1999) ... 9Table 2: Samples used for cross-sectional and panel studies, 2000-2001... 10
Table 3: Evolution of subjective assessments and of average income level... 12
Table 4: Households’ subjective assessment of the evolution of living standards... 13
Table 5: Cross-check of different approaches to poverty ... 14
Table 6: Perceptions of well-being and satisfaction of basic needs ... 15
Table 7: Households’ subjective well-being and income... 18
Table 8: Perceived of household's minimum necessary income and observed income... 18
Table 9: Estimate of ordered probit model of subjective well-being according to income... 19
1.
INTRODUCTIONThe multidimensionality of poverty is now fully acknowledged, but in the countries where this problem is more acute, poverty reduction policies fail to take its different dimensions into account. In developing countries, poverty is usually only studied in monetary terms by comparing the level of income or consumption with a given threshold. Very few studies have been carried out on households’ subjective perception of well-being in these countries (Frey and Stutzer, 2002a). This can partly be explained by the lack of household surveys covering the different facets of poverty, in particular its subjective dimension. But probably the most important explanation is the underlying hypothesis that poverty is first and foremost a monetary question for the poorest people or in the poorest countries (Argyle, 1999, Ferrer-i-Carbonnell, 2002)1. There is also a certain degree of scepticism as to the
reliability of the responses and to whether it is possible to compare people’s subjective perceptions of well-being (Easterlin, 2001).
The aim of this study is to assess the relevance of this hypothesis by looking at two very different developing countries, Peru and Madagascar: the first, an emerging country in Latin America and the second, located in Africa and rated amongst the world’s poorest countries. By mobilising a particularly comprehensive database grouping objective individual variables (socio-demographic and economic characteristics), together with identical subjective questions for both countries, we examine the extent to which the traditional approach to poverty matches the households’ perceptions of their living standards. The same type of data obtained by adding subject-specific modules to traditional statistical surveys has already provided information on the opinions of the poor, especially in terms of their needs, in a view to drawing up poverty reduction policies (Razafindrakoto and Roubaud, 2002 and 2005a). However, we should point out that surveys combining qualitative and quantitative variables, which offer many advantages for measuring poverty, are still seldom used in developing countries (Ravallion, 2002).
Our study examines households’ subjective assessment of their living conditions. Without entering into the vast debate about the concept of poverty, the latter is defined here as opposed to well-being, in the economic sense of the term.2 It covers a wide set of themes, opened up in particular by Sen (1984)
with the notion of lack of capabilities, and later explored and focused on in developing countries as part of the “Voices of the Poor” initiative (Narayan et al., 2000a and 200b; World Bank, 2001). Factors such as vulnerability, social capital and autonomy were added to lack of resources or difficulties in accessing basic social services (education, health) as means of understanding the phenomenon of poverty. These “new” additions to the concept of poverty, which are only just beginning to be taken into account by development economists in the poor countries, have been studied in depth for a long time in developed countries, by both economists and sociologists.
The aim of this study is two-fold: first, to provide a better understanding of the phenomenon and to hone the criteria used to measure poverty; and second, to identify the domains that influence individuals’ economic well-being and where action is required to improve their living standards. We also examine whether the results generally obtained in developed or transition countries are confirmed in the cases of the two developing countries studied here.
To be more precise, the main focus is on four questions. First, to what extent does the level of income determine the way households assess their well-being? Is the idea that the relationship between income and the assessment of subjective well-being is stronger for the poor confirmed when we compare Madagascar and Peru? Second, what is the impact of relative income on well-being? This raises the problem of identifying the reference group in relation to which the individuals judge their own
1 In a simple explanatory model of subjective well-being, if the log of income is examined instead of the absolute levels of income, this
lessening of the impact of income for the richest households disappears (Easterlin, 2001).
2 Offer (2003) concludes that the link between the economic situation and well-being in general varies depending on the periods studied,
the latter being harder to define than unhappiness, which can be associated with the notion of poverty. On the contrary, Frey and Stutzer (2002a) establish a relationship between economics and psychology by suggesting that subjective well-being is equivalent to being happy. This is still a recent approach and has not been studied in any depth by economists in the past, except for the movement initiated by Easterlin (1974) and Van Praag and Kaypten (1973).
situation. Third, apart from income, which socio-economic factors have an impact on well-being? In particular, what is the role of the situation in the labour market and job quality, of origin and social mobility, of the geographical environment and the impact of the neighbourhood? Fourth and finally, we take advantage of our comprehensive databases to introduce new dimensions that are now considered an integral part of the concept of poverty: vulnerability (impact of shocks on income, job loss, corruption, insecurity) and social and political exclusion. The impact of these variables on well-being has rarely been tested empirically (Frey and Stutzer, 2002a).
In section 2, we give a brief summary of the literature on the determinants of well-being, focussing on developing countries. Section 3 compares the economic situation in the two countries and presents the data used, touching on the problems raised by international comparisons. An initial series of descriptive results is given in Section 4, notably comparing the subjective perceptions and objective indicators of well-being in Madagascar and Peru. In Section 5, we attempt to model the determinants of subjective well-being and discuss the results obtained, underlining the similarities and differences in the two countries. Section 6 presents the conclusion and outlines perspectives for further research.
2.
ANALYSIS OF SUBJECTIVE WELL-BEING: REVIEW OF EXISTING LITERATUREAlthough empirical literature on the perception of subjective well-being (hereinafter referred to as SWB) is growing rapidly, studies on developing countries are still scarce and focus on just half a dozen countries: Nepal, Jamaica, South Africa, Madagascar, Mexico and Peru3. Whereas a certain
number of stylised facts emerge from studies on developed countries, it is not yet possible to make generalizations for developing countries, due to the small number of studies carried out and also to the great diversity of methodologies and approaches employed. Some of the results concerning developing countries even seem to go in the opposite direction from those found systematically in developed countries. Is this due to a specific feature of developing countries, or to specific cases? In this section we review the main, most recent work on SWB and its determinants, in developed and developing countries. This is not intended to be an exhaustive review of the studies, but a comparison of the stylised facts found for developed countries with the fragmented results obtained for developing countries where fewer empirical studies have been carried out on the question of subjective well-being.
In this field of research, there is very wide consensus on three salient facts:
1) First, there is unanimous agreement in all the studies on the fact that there is a positive correlation between SWB and level of income (the monetary indicator most often used; Easterlin, 2001). It is also recognized that this correlation is not perfect (Easterlin, 2001; Frey and Stutzer 2002a). These observations, which are made for developed and developing countries alike, are doubtless the most robust results to be found in all the empirical literature on this subject.
In addition to these results, Easterlin puts forward two other stylised facts applying to developed countries only:
2) The positive correlation found in the cross-sectional studies weakens or even disappears when inter-temporal comparisons are made (whether by examining cohorts or panel data). Over the life cycle, the average level of SWB remains constant overall, despite a substantial increase in income (Easterlin, 2001);
3) Despite the fact that a cohort’s SWB remains constant throughout the life cycle, the individuals think that their situation was worse in the past and that it will improve in the future (Ibid).
3 See in particular studies by Fafchamps and Shilpi (2003), Pradhan and Ravallion (2000), Razafindrakoto and Roubaud (2000, 2005b),
Herrera (2001), Rojas (2003), Graham and Pettinato (2000 and 2001), Kingdon and Knight (2004), and Lokshin, Umapathi and Paternostro (2004).
Although these three stylised facts appear to be firmly established, the authors do not agree on how to interpret them. Several hypotheses have been put forward concerning the partial correlation in cross-sectional studies between SWB and level of income. The first, where there is the widest consensus, is that the subjective perception of well-being is not only determined by the level of current income, but also by a series of variables relating to the income trajectory and other factors such as health, education, employment, etc., irrespective of their impact on income (Ravallion and Lokshin, 2002a). This list is not exhaustive: other studies also include the family status (divorce or widowhood, etc.), governance, democracy and social capital (Frey and Stutzer, 2002b).
The second stylised fact, i.e. the weakening or even disappearance of the correlation between income and SWB if a temporal approach is used instead of a cross-sectional approach, can be explained on the one hand by changes in aspirations and on the other by the growing importance, as the life cycle advances, of other areas of well-being (such as health, family life, etc.) in assessing overall SWB. For example, individuals have little ability to adapt to widowhood, retirement, unemployment or deterioration in health. Given that these events have a much higher probability of occurring towards the end of the life cycle, SWB will tend to fall over time, partially or totally offsetting the positive effect of growth in income resulting from increased professional experience.
In an attempt to explain why individuals tend to look at the past with bitterness and the future with optimism (the third stylised fact), Easterlin (2001) suggested that a distinction can be made between decision utility and experience utility, and put forward the hypothesis that individuals judge the future with their current aspirations, which have been formed from past experience. Hence, if we take the most common case where the people’s incomes grow gradually during the life cycle, as the aspirations are adapted and increase with income, the past standard of living is naturally considered insufficient in the light of current aspirations. On the contrary, the prospect of increasing income in the future are seen as positive for well-being given that it is not possible to take into account immediately the resulting rise in aspirations.
The different determinants of SWB can vary in importance depending on the social groups and the stage in the life cycle. According to Easterlin, individuals share the same set of aspirations at the beginning of their life cycle. Then, depending on the level of education reached, they will follow two distinct trajectories, associated with two different levels of objective and subjective well-being. Subsequently, the principle of adaptability of aspirations plays an important role throughout the trajectories, as the individuals on each “track” adapt to the way their own income progresses (Easterlin, 2001; Frey and Stutzer 2002c). According to Easterlin, the principle conditioning the aspirations also changes during the life cycle. The weight of past experience declines in favour of social comparisons (Easterlin, 2001). In the case of developing countries, it has been suggested that material circumstances count more in SWB than other aspects of well-being, such as freedom and political involvement, respect for human rights, etc., put forward by cultural transition and post-modernist theorists (Inglehart, 1997; Inglehart and Welzel, 2005).
The asymmetrical movement of SWB depending on whether the income trajectory is upward or downward can also account for part of the variance in SWB that is not explained by the current level of income. Hence, using a ten-wave British panel, Buchardt (2003) noted that the SWB of people who have suffered a negative shock is lower than the SWB of people who have permanently low income. On the contrary, the same author observed that people adapt more easily to an upward income trajectory: in this case, the SWB is not higher than for individuals who enjoy high incomes on a permanent basis. According to Easterlin, there is a positive correlation between the level of SWB and the level of income and a negative correlation with aspirations (Easterlin, 2001). As people progress in the income scale, aspirations grow in similar proportions, so that SWB remains constant. More generally speaking, Michalos (1985), taken up by Selnik (2003), considered that SWB depends on the gap between individuals’ situations and their points of reference, which in turn consist of their past situations, aspirations, needs and objectives.
The asymmetrical nature of SWB movements depending on whether individual mobility trajectories are upward or downward is even more pronounced for non-monetary aspects of well-being than for the case of income. For instance, job loss leads to a reduction in well-being which cannot be made up
for with a simple monetary gain equivalent to the amount lost due to unemployment (Ravallion and Lokshin, 2002a). As Clark and Oswald (1994) point out, this means that apart from the financial loss, job loss has a lasting effect on well-being, through its effect on social exclusion, the feeling of not being useful, loss of self-esteem, etc.
Aspirations do not just depend on past experiences and individual trajectories: other people’s experiences are also crucial (“social comparison theory”, Easterlin, 2001)”. According to Selnik (2003), it is important to distinguish between two cases, although both concern social interactions. First, the subjective perception of well-being is subject to the interdependency of preferences. Second, the situation relative to the other individuals in the reference group, particularly in a dynamic perspective, has a cognitive value. Whereas the income comparison theory suggests that other people’s income has a direct impact on an individual’s SWB (relative well-being), the cognitive interpretation of the income of a reference group implies that the link between their income and the individual SWB is indirect and depends on information (in terms of opportunities and possible trajectory). Thus, for Russian households, Selnik found that the individual SWB increases when the income of the reference group increases even more quickly. It is anticipation and the prospect of having the same increase in income (tunnel effect) that makes the difference compared with the reference group acceptable and impact positively on SWB. The two effects demonstrate the importance of social interactions, but the perceptions are interdependent in one case and not in the other (Selnik, 2003).
Although, generally speaking, the positive impact of individual income prevails over the negative impact of relative income, this is not always true. For example, Fafchamps and Shilpi (2003) showed that in the case of rural Nepalese households, the negative impact of the average income of the reference group is such that it cancels out the positive impact of individual incomes. In their view, this specificity stems from the particular situation of rural communities in Nepal, characterised by an isolated and stagnant economy with a high level of poverty.
As Fafchamps and Shilpi (2003) recognize, very little is known about the way reference groups are built. The authors highlight the role of isolation in Nepalese rural communities. In these isolated villages, the reference group is their own local community, whereas for individuals living in towns the reference group is more complex and diffuse. For Clark and Oswald (1994), the reference group is formed by a peer group in the labour market. Ravallion and Lokshin (2002a) look at the area of residence but also at the family group. They tested the impact of individuals’ positions with respect to the other household members on their perception of well-being. However, in the specific case of Russia, no significant impact was found.
In the case of Russia studied by Ravallion and Lokshin (2002a) and in that of Nepal analysed by Fafchamps and Shilpi (2003), the average income of the area where households live has a negative impact on SWB, after controlling for the households’ income and other socio-demographic characteristics. All things being equal, individuals living in wealthier areas will therefore have a more negative perception of their SWB. According to Ravallion and Lokshin, this explains why differences are found between objective and subjective well-being indicators in the richest regions (ibid). The scale of the negative impact of the relative income of the household/individual compared with the average income of the area increases with the area’s isolation and distance from markets, to such an extent that it even counters the positive effect of the households’ income on SWB, as shown by Fafchamps and Shilpi in the case of Nepal. The effect disappears in the case of households living nearer to markets, which, in these authors’ view, means that these households compare themselves with other reference groups. In the case of Russia, the negative impact of the income in the area is not strong enough to counter the positive impact of the individuals’ and the households’ income on SWB4.
Both studies provide empirical confirmation of the hypothesis of relative well-being to the detriment of the “tunnel effect”.
4
The cumulative effect of a rise of 1% in current and past income for the individuals and the household is 0.335, whereas the impact of the place of residence is -0.200 (Ravallion and Lokshin, 2002a).
3.
MADAGASCAR-PERU: PRESENTATION OF ECONOMIC CONTEXT AND DESCRIPTION OF DATA3.1.
Socio-economic contextMadagascar and Peru are, in many respects, two very different developing countries, one in Africa, one in Latin America. Their traditions have very different cultural origins, despite their common Christian background. From an economic standpoint, the first, predominantly agricultural, is one of the poorest countries in the world, whereas the second is an emerging, semi-industrialised country. The per capita GDP in Peru is 2,400 dollars, ten times higher than in Madagascar where it amounts to scarcely 250 dollars. This enormous gap in the development levels explains that there is no possible comparison between their poverty rates. In 1999, 76% of the population of Madagascar lived under the poverty line compared with 42% in Peru.
At the time of the surveys, between 2000 and 2002, the two countries were engaged on two contrary economic paths, despite having a common matrix for public policies, widely inspired by the Washington Consensus and structural adjustment programmes: macro-economic stabilisation, internal and external liberalisation, and privatisation. In Madagascar, after a long period of recession, the trends reversed in the mid-1990s. The economic reform programme launched at the beginning of the 1980s finally began to be felt in 1997 when, for the first time in many years, the per capita GDP improved slightly (+1%). Since then, the process has accelerated and growth reached nearly 5% in 2000. This improvement is quite exceptional when seen in the light of the country’s economic history: Madagascar has not known such a favourable situation since the end of the 1960s. Our study is based on the capital, Antananarivo, for which we have detailed data from household surveys, and where real wages and households’ per capita income increased respectively by 43% and 35% from 1995 to 1999 (Razafindrakoto and Roubaud, 1999). This movement contrasts sharply with previous trends. Over the long term, the population’s standard of living has fallen almost constantly since the country’s independence, decreasing by 45% between 1961 and 1995 (Ravelosoa and Roubaud, 1998).
In Peru, following a period of strong expansion from 1993 to 1997, when per capita GDP grew by over 6% per year, the trend suddenly reversed in the second half of 1997. Economic growth in Peru slowed and then became negative following the Asian crisis, as in most other Latin-American countries. In addition to the drying up of short-term capital inflows and the drop in prices for the main exports, El Niño had devastating effects. In 1998 and 1999, the country recorded a fall in per capita GDP of -2.1% and -0.3%. Growth returned during the period 1999-2002 (with average annual growth in GDP and private consumption of 1% and 1.5% respectively), although this was not enough to recover the levels of GDP and per capita consumption recorded in 1997. The modest growth levels in households’ private consumption recorded in the National Accounts are confirmed in the results of the household surveys. Per capita expenditure for urban households grew by 6% and 3% in 2001 and in 2002, but this was scarcely enough to recover the 1999 level. In 2001 and 2002, given the increase in inequality (the Gini index rose from 0.37 in 2000 to 0.42 in 2002) total poverty and extreme poverty in urban areas did not fall, or even rose slightly (but not significantly in statistical terms) reaching 36.9% and 6% respectively. From a long-term perspective, in 2002 Peruvians’ per capita GDP was still around 30% higher than at the beginning of the 1960s.
Among the differences between the two countries, a certain number of characteristics strongly distinguish the two capitals, Antananarivo and Lima, on which this study is based. With over 7 million inhabitants, the population of Lima is nearly 7 times that of Antananarivo. It is important to appreciate this difference in absolute but also in relative terms. Due to the economic and demographic weight of Lima, where nearly a quarter of the population lives, Peru is monocephalous, whereas Madagascar seems more balanced in this respect. The two metropolises also differ by their levels of ethnic heterogeneity: in the Peruvian capital, over half the population is of migrant origin, mainly from the rural Andean zones, whereas in the Madagascan capital, non-natives are a small minority, mostly coming from the country’s secondary towns.
However, these differences must be put into perspective. According to Frey and Stutzer (2002a), the scale of cultural differences is often exaggerated. There are universal factors that determine happiness, which is the ultimate goal in life for all human beings, whatever their culture (Frey and Stutzer, 2002b). We examine three questions: to what extent are the characteristics and determinants of subjective poverty similar in the two countries, despite their differences? Do monetary factors count more in the poorer country? Can we see the phenomenon of aspirations adaptation, observed in nearly all studies on developed countries?
Table 1: Madagascar and Peru in figures (1999)
Madagascar Peru Madagascar Peru
Surface area (1,000 km2) 587 1,285 GDP (billions $US) 3.7 51.9
Population (millions) 14.6 25.2 Per capita GDP ($US) 250 2,130
Population growth rate (%) 2.8 1.7 Rate of investment (%GDP) 12 22
Urban population (%) 29 72 Tax burden (%GDP) 11 18
Life expectancy (years) 58 69 Foreign debt (%GDP) 123 61
3.2.
The dataIn both countries, the database was collated by the National Institute of Statistics (INSTAT in Madagascar, INEI in Peru) following an original joint protocol, in the framework of the research programme coordinated by the authors of this study. Based on the observation that subjective measurements of well-being were still practically unheard of in developing countries, despite universal recognition of their analytical interest, specific ad hoc modules on Multiple dimensions of poverty were added to the main household survey carried out in each of the countries.
In Madagascar, the Multiple dimensions of poverty module was included in the 1-2-3 household surveys system in the Antananarivo agglomeration5, introduced by INSTAT, with support from the MADIO project, as of 1995 and repeated each year (Rakotomanana, Ramilison and Roubaud, 2000; Rakotomanana, Ravelosoa and Roubaud, 2000). The module was first experimented in 1998. Due to the technical success of the operation, the original results obtained (Razafindrakoto and Roubaud, 2000 and 2002b) and the increasing importance of the subject of poverty in developing countries in general and Madagascar in particular (PRSP and HIPC initiatives, MDG), the Multiple dimensions of poverty module was included in the standard survey system as of 2000.
Since then, the module has been added to the employment survey which concerns a sample of around 3,000 households and 15,000 individuals, representative of the Madagascan capital, with an area-based, stratified plan with two stages (census zone, household). As the sample is rotating, with random renewal of a third of the households each year, the survey comprises a panel component, which is used in this study. A total of 3,020 households were surveyed in 2000 and 3,019 in 2001, whereas the panel comprised 2,178 households which were surveyed both years. Concerning the Multiple dimensions of poverty module dealing with the general situation of the household, a qualified person had to be selected within each household to answer the questions. In two-thirds of cases (65% in 2000 and 68% in 2001), the head of household answered the survey in person. For 30% of cases, the spouse was questioned. Non availability of one or other of these respondents meant that other members of the household took part, although in a residual number of cases. We must stress that a system of this sort is quite exceptional in sub-Saharan Africa. Due to the strict control procedures at each stage (collection, checking, processing), the Madagascan data is also of much higher quality than those found in most household surveys in Africa.
The same strategy of interlinked modular surveys was implemented in the case of Peru. The subjective perception module can thus be analysed at the same time as the modules concerning the households’ socio-economic characteristics, employment, income and expenditure, education, health, etc. The
5
1-2-3 surveys are household survey systems developed by DIAL researchers. They are carried out in three interlinked phases: the first, an employment survey which serves as a base for phases 2 (informal sector) and 3 (consumption, poverty; Razafindrakoto and Roubaud, 2002b). In Madagascar, phase 1 is implemented annually, whereas phases 2 and 3 are carried out every 3 years (1995, 1998, 2001 and 2004).
multiple dimensions of poverty (objective and subjective measurements) can therefore be examined simultaneously for the same households. This also enables us to study the extent to which these multiple dimensions are correlated one to the other and whether the profiles and determinants of each dimension of poverty are similar or not.
Our results are based on the ENAHO surveys carried out on a national level by the National Institute of Statistics in the last quarter of 2001 and 2002. In order to ensure the comparability with the case of Madagascar, the sample analysed is restricted to urban households only. Our results thus concern an urban sub-sample of 10,013 and 11,112 households respectively in 2001 and 2002 (including 2,486 in the capital in 2001 and 2,134 in 2002)6. We also have a panel of 2,927 households interviewed in 2001 and in 2002, which we use to examine a certain number of shocks suffered by the households and to explain the role of the trajectories. We should point out that in the rare studies that exist for developing countries, the sample sizes are far smaller than in the case of Peru7. We therefore obtain far more robust results and a more sharply focused disaggregation of the individuals’ and households’ socio-economic characteristics. Contrary to the 1-2-3 survey in Madagascar, in Peru only the heads of households were interviewed in this module. The result is a larger masculine population, on average older than in the Madagascan case. However, on the basis that the subjective perception dimension refers to the well-being of the household as a whole, we decided that the head was capable of providing an informed assessment on this question, in the same way, in fact, as the usual practice for questions concerning households’ spending. Whatever the case may be, the respondents’ individual characteristics are included in the econometric models in order to account for any possible biases introduced by this survey strategy.
Table 2: Samples used for cross-sectional and panel studies, 2000-2001
Madagascar (capital) Peru (urban)
Number of households 2000 2001 2001 2002
Total sample 3 020 3 019 9 813 10 946
Panel 2000-2001 2 178 2 178 2 882 2 882
Sources : 1-2-3 Surveys, phase 1 (Employment), 2000-2001, INSTAT/MADIO, Madagascar; ENAHO Surveys 2001-2002, INEI, Peru; our own calculations.
The work done beforehand to harmonise the basic surveys (statistical protocols, questionnaires, wording of modalities) and processing procedures afterwards (building common dependent and independent variables, rigorously identical definitions and methods of calculation) guarantees the strict comparability of the results obtained in the two countries, which is one of the main strong points of our study. This special attention is all the more necessary given that experience accumulated on an international scale concerning the analysis of perceptions shows that the results obtained are particularly sensitive to the precise wording of the questions. Similarly, with the time dimension, the two panels were controlled systematically and abnormal data eliminated. By studying attrition bias, we were able to ensure the quality of the panels and the fact that they were indeed representative of the environment under review in each of the two countries.
4.
DESCRIPTIVE ANALYSES : HOUSEHOLDS’ SUBJECTIVE EVALUATION OFTHEIR LIVING STANDARDS
Economists often have reservations concerning households’ subjective evaluation of their own well-being, although some of them do believe that individuals are in the best position to judge their own situation (Ravallion and Lokshin, 1999). Various objections have been put forward: some doubt people’s ability to assess their own situation and to express this on a single scale (Easterlin 2001; Ferrer-i-Carbonnell, 2002). Practical difficulties and biases stemming from the survey methods
6 Once the missing values have been excluded, the subjective perception module contained a final sample of 9,813 urban households in
2001 and 10,946 in 2002. In the capital, our final sample amounted to 2,394 households in 2001 and 2,069 in 2002.
7 In the study by Pradhan and Ravallion (2000) on Jamaica and Nepal, the national samples were 1,954 and 3,373 respectively. Kingdon
and Knight (2004) worked on a sample of 8,300 South African households, whereas Lokshin et al. (2004) studied 5,080 households in Madagascar. This small sample size is even more marked in the panel component (for example, 500 households for the Peruvian panel studied by Graham and Pettinato (2001).
(wording of questions, interaction with interviewers, etc.) also raise additional problems (Selnik, 2003). It has also been suggested that comparisons between countries have little meaning due to cultural differences8. In fact, as several authors point out, none of these objections are sufficient to
invalidate the subjective approach to well-being. Indeed, economists and statisticians have included analyses of perceptions and anticipations in their tool boxes in both developed and developing countries for a long time, on the theoretical front and for empirical measurements, as shown by the generalisation of studies on the overall economic climate. Without wishing to minimize the importance of measurement difficulties, we do not cover this question, which has been the subject of an intense scientific debate9. However, the coherence and robustness of our results can be put to the
credit of those who believe that the approach is relevant, even in developing countries.
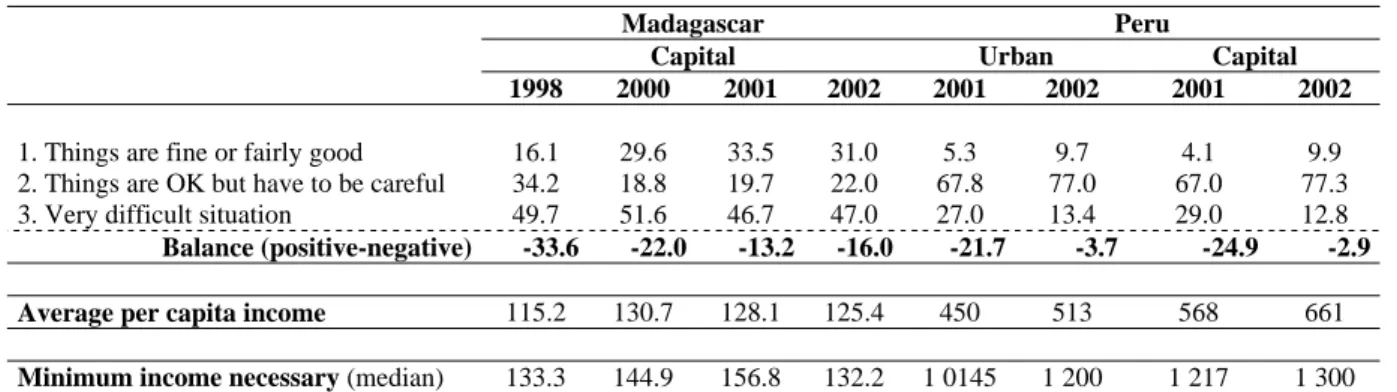
A comparison of the evolution of subjective perception and the evolution of average household income shows that the two indicators converge, to a certain extent, in both Madagascar and Peru. Similarly to observations in developed countries, we can see that when monetary income increases (or decreases), the households’ perceptions change in the same direction. Also in conformity with another stylised fact observed in the industrialised countries, the average income that the households consider necessary to make ends meet grows (falls) in periods of expansion (recession).
In Madagascar, households recorded growth of over 13% in per capita income from 1998 to 2000. During the same period, the percentage of those who declared that “things are fine or fairly good” rose by 14 points, from 16% to 30%. The balance of opinion (% of positive opinions - % of negative opinions) improved by nearly 12 percentage points. On the contrary, between 2001 and 2002, real income fell by around 2% following the political and economic crisis caused by the contested presidential election in December 2001 (Roubaud, 2002). During the same period, the balance of opinion deteriorated (- 3 points). The relation between the two variables is however far from perfect, highlighting the probable impact of factors other than income on well-being. For example, although income fell slightly (-2% from 2000 to 2001, i.e. an equivalent decrease to that observed between 2001 and 2002), the perceptions continued on an upward trend (+9 points);
In the same way, we observe a positive correlation between aspirations (measured by the question on the minimum income considered necessary to make ends meet, or the Minimum Income Question, MIQ) and monetary income. However, the correlation is not perfect in this case either and is asymmetrical. The elasticity of MIQ to income seems to be lower in periods of growth than in periods of recession. Hence, the 13% increase in real income from 1998 to 2000 was accompanied by an increase of 9% for the MIQ. On the contrary, the small decrease in income from 2001 to 2002 (-2%) contrasted with a drastic drop for the MIQ (-16%). This result is perfectly in line with that obtained by Milanovic and Jovanovic (1999) in the case of Russia. Although the Russian households experienced a sharp fall in their real income between 1993 and 1996, the income that they considered was a minimum (MIQ) fell even more rapidly. Ultimately, objective poverty had increased whereas the proportion of people who considered themselves poor (subjective poverty) was falling. In the case of Madagascar, the strong increase in inflation with the 2002 crisis probably upset the households’ economic references, which partly explains the over-reaction for the MIQ.
In Peru, the income, SWB and MIQ dynamics are observed over a shorter period (2001 and 2002). Nonetheless, we found similar results to those observed in Madagascar. In both the capital and other urban areas, growth in per capita income was accompanied with an improvement in the perception of well-being and an increase in aspirations. But the relation is not linear in this case either. For example, aspirations rose more quickly than income for urban dwellers overall (+18% versus 14%), whereas the reverse was found in Lima (+16% versus +7%). Ultimately, in both countries, the evolution of income has a positive correlation with SWB and MIQ.
8
See Frey and Stutzer (2002b) for a discussion on this subject.
Table 3: Evolution of subjective assessments and of average income level
Madagascar Peru
Capital Urban Capital
1998 2000 2001 2002 2001 2002 2001 2002
1. Things are fine or fairly good 16.1 29.6 33.5 31.0 5.3 9.7 4.1 9.9
2. Things are OK but have to be careful 34.2 18.8 19.7 22.0 67.8 77.0 67.0 77.3
3. Very difficult situation 49.7 51.6 46.7 47.0 27.0 13.4 29.0 12.8
Balance (positive-negative) -33.6 -22.0 -13.2 -16.0 -21.7 -3.7 -24.9 -2.9
Average per capita income 115.2 130.7 128.1 125.4 450 513 568 661
Minimum income necessary (median) 133.3 144.9 156.8 132.2 1 0145 1 200 1 217 1 300
Sources : 1-2-3 Surveys, phase 1 (Employment), 1998-2002, MADIO/INSTAT, Madagascar; ENAHO Surveys, 2001-2002, INEI, Peru; our own calculations.
* : For Madagascar, income is in thousands of constant Madagascan francs of 1998. For Peru, constant sols of 2002.
4.1.
Subjective perception and the reference groupTwo reasons are often given to explain the partial correlation between perception of living standards and monetary income. The first is the fact that households’ aspirations are subject to adaptive behaviour. The second explanation is that households’ subjective assessments take into account not only income, but also a series of individual and collective material conditions (unemployment, family structures, discriminations, access to public services, governance, etc.). We will come back to this second explanation in section 5, with econometric estimates of the determinants of subjective well-being, and an attempt to quantify their specific contributions. In this section, we look at households’ adaptive behaviour, which may be based on an individual trajectory in terms of economic status, or on the situation or trajectory of a reference group. The identification of the latter requires clarification: it may be a social group, defined for example according to factors such as education received, age, type of job; it can also be a local, regional or even national or international community, linked with the place of residence.
We can also mention again briefly the impact of social interactions on individuals’ perception of the level and evolution of their own well-being that we touched on in section 2. Individuals’ SWB depends on interactions with a social group to which they feel they belong and which serves as a point of comparison. Two sorts of interactions were identified in the applied literature: first, the interdependency of preferences and aspirations, and second the tunnel effect, which attributes a cognitive value to the reference group. Depending on which type of interaction prevails, the theory predicts two opposite effects. In the first case, the individuals’ SWB increases if the group’s well-being is lower or evolves less quickly than their own. This hypothesis is difficult to test due to the fact that, in principle, we do not know who comprises the reference group (neighbours in the area or village, in the town or the country; individuals with the same level of education or belonging to the same professional group, etc.). In addition, this group can vary during the life cycle or depending on how isolated the area of residence is10. The second hypothesis predicts a relatively positive impact of
the average level of income of the group and its evolution on an individual’s SWB. It is the perception of economic mobility – indicating equal opportunities – that will turn the impact of the gap between individuals’ income and that of the community they belong to into a positive impact (all individuals are capable of attaining the same situation as that of their reference group).
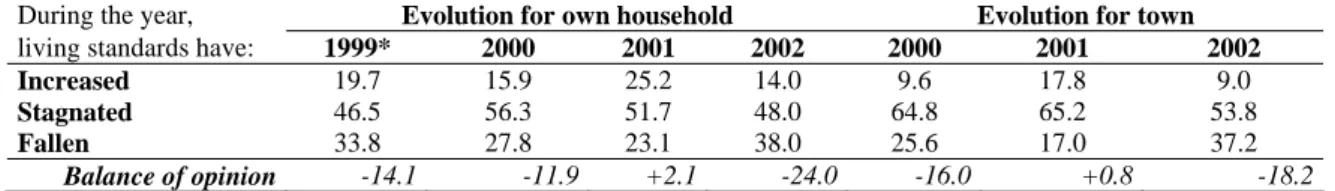
The joint study of people’s perceptions of the evolution of the living standards in their own household and that of the place of residence (here, the town where the respondents live) provides some useful food for thought on social interactions in Madagascar and Peru. In Madagascar, the balance of opinion on individual situations evolves in a similar way to that concerning the town. Given that the average income stagnated in 2001 then fell in 2002 and that during the same period the perceptions on the household and on the town went from a very negative balance to a slightly positive balance, then again to a very negative balance, we can assume that it is not very likely that there was a “rivalry” effect in
determining the SWB. The perception of the town’s living standards seems to have played an important role in SWB when income stagnated, otherwise how can we explain the large increase in households’ SWB? The reference group of “households in the same town” apparently has a positive impact when the economic situation improves but no specific impact when it deteriorates.
In Peru, the balance of opinion on the town is less negative than on the household, both in 2001 and in 2002. At the same time, the balance of opinion on the assessment of living standards deteriorated significantly in a context where, paradoxically, real income increased. It seems that the population perceived deterioration in overall living standards, but to a lesser extent in the town than for their households. Instead of resulting in a more negative balance for the perception of the households’ level of well-being, this seems to have improved it. This confirms, in a way, the results obtained by Graham and Pettinato for Peru. On the basis of a small sample of households (n=500), they found that the perception of past mobility and the prospect of upward mobility have a positive impact on SWB. However, there is a fraction of “frustrated achievers” who, in spite of upward mobility, report a negative perception of their mobility and low satisfaction concerning their living conditions (Graham and Pettinato, 2001).
The national scope of the Peruvian survey helps highlight the fact that urban households have a more pessimistic view than rural households concerning the evolution of living standards, both in their own households and for the town. In addition, urban dwellers show a greater gap between their perception of the evolution of living standards for their household and that of their town. This fact is not surprising given the prevalence of covariant shocks in rural areas and the greater inequalities in towns. The perception of an improvement in living standards for the other households in the town when their own household stagnates or declines can be expressed by a negative assessment of their individual situation (Duesemberry’s demonstration effect) or, on the contrary, by a positive feeling due to the prospect of future mobility (Hirschman’s tunnel effect) for which this observation may be the signal. Finally, it should be noted that in both Madagascar and Peru, irrespective of the real evolution in income (rise, stagnation or fall), around half the respondents stated that their living standards had stagnated. The same applies to the assessment concerning the town: in Peru and in Madagascar, it was not very optimistic given that around 60% considered that living standards were constant. We can explain this discrepancy between the observed evolution of income and people’s perceptions, by returning to the hypothesis that other dimensions of well-being intervene in the perceptions, which are not accounted for by a purely economic and monetary approach.
Table 4: Households’ subjective assessment of the evolution of living standards
Madagascar
During the year, Evolution for own household Evolution for town
living standards have: 1999* 2000 2001 2002 2000 2001 2002
Increased 19.7 15.9 25.2 14.0 9.6 17.8 9.0
Stagnated 46.5 56.3 51.7 48.0 64.8 65.2 53.8
Fallen 33.8 27.8 23.1 38.0 25.6 17.0 37.2
Balance of opinion -14.1 -11.9 +2.1 -24.0 -16.0 +0.8 -18.2
Source : 1-2-3 Surveys, phase 1 (Employment), 1999-2002, MADIO/INSTAT, Madagascar; our own calculations.
Note : The responses for 2000 and 2001 are drawn from the panel of individuals. * The question posed in 1999 was slightly different as the households were asked to assess the evolution of their income and not their living standards.
Peru
During the year, Evolution for own household Evolution for town
living standards Urban Lima Urban Lima
have : 2001 2002 2001 2002 2001 2002 2001 2002
Increased 8.3 10.6 7.7 10.6 5.6 8.8 6.4 9.7
Stagnated 60.0 49.8 61.1 49.8 67.0 56.8 67.6 55.7
Fallen 31.7 39.6 31.2 39.6 27.4 34.4 26.0 34.6
Balance of opinion -23.4 -29.0 -23.5 -29.0 -21.8 -25.6 -19.6 -24.9
4.2.
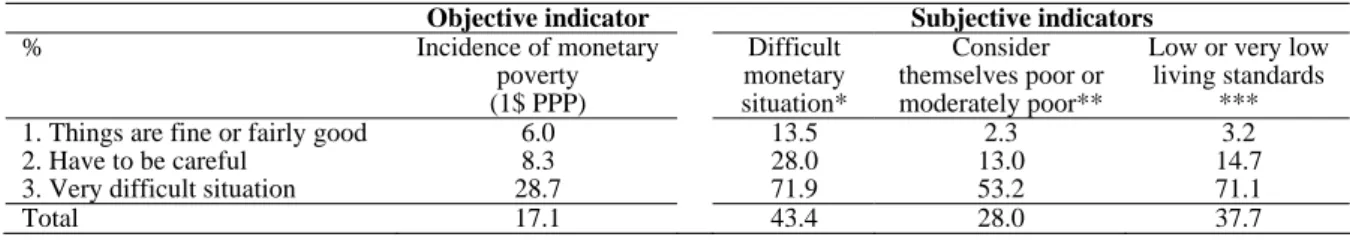
Multidimensionality of povertyIt is clear that the perception of well-being in general involves different aspects that are not limited to the purely monetary dimension of income. In addition, following Sen’s approach, we can assume that quite apart from the ability to acquire a basket of goods measured by the monetary poverty line, individuals’ well-being is more closely related to the real or perceived satisfaction of the household’s needs in different domains. This ability can be assessed overall or broken down into the different domains in question. For instance, good food, comfortable housing, being able to dress in a socially acceptable way, having good health and access to quality education are quite obviously among the factors that count in assessing standards of living. Van Praag, Frijters and Ferrer-i-Carbonnell (2004) used data on Germany and the United Kingdon to illustrate that the assessment of SWB is a combination of financial satisfaction, satisfaction in terms of employment, health, housing, leisure and environment, and also that people’s levels of satisfaction are comparable given that satisfactions are for the most part explained by objective variables. Seen from this angle, the subjective poverty approach is not a component that is complementary to objective poverty (taken globally and in each of its aspects), but more an approach that encompasses it as a specific case. Other non economic dimensions (violence, political freedom, pollution, governance) could also be added to subjective perception of living standards. The composite indicators of human development developed by the UNDP go in this direction. However, these multidimensional indicators are confronted with the difficulty of setting weightings that are anything other than arbitrary weights. The econometric approach to the determinants of the subjective satisfaction of living standards provides a promising solution to this problem (Kingdon and Knight 2003; Van Praag, Frijters and Ferrer-i-Carbonnell, 2002).
In Table 5, we compare the perception of living standards with different indicators of objective and subjective poverty. Firstly, and as could be expected, there is a strong link between the general perception of living standards and all the other measures of poverty. In Madagascar, 29% of those who declare their situation to be “very difficult” are objectively poor (at the 1 dollar PPP), compared with only 6% of those who say that “things are fine or fairly good”. The gradient is even more marked when other subjective indicators are added. For example, barely 3% of those who consider that “things are fine or fairly good” are convinced that their living standards are low or very low, but they are 71% among those who find the situation “very difficult”.
Table 5: Cross-check of different approaches to poverty Madagascar
Objective indicator Subjective indicators
% Incidence of monetary poverty (1$ PPP) Difficult monetary situation* Consider themselves poor or moderately poor**
Low or very low living standards
***
1. Things are fine or fairly good 6.0 13.5 2.3 3.2
2. Have to be careful 8.3 28.0 13.0 14.7
3. Very difficult situation 28.7 71.9 53.2 71.1
Total 17.1 43.4 28.0 37.7
Source :1-2-3 Surveys, phase 1 (Employment), 2001, MADIO/INSTAT, Madagascar; our own calculations.
* : Responses "You are obliged to dip into your savings" and "You are obliged to get into debt", to the question "What is the financial
situation of your household?" **: Responses "the 20% poorest" and "the 20% moderately poor" to the question "In view of your living standards and those of the households in the town, do you think you belong to:” ***: Responses “Very low” and “Low” to
the question “How do you assess your household’s living standards?” The figures in this column come from the 1-2-3 survey, phase 3, carried out in 1998.
Peru
Objective indicators Subjective indicators
Incidence of extreme poverty Total Incidence of poverty Incidence calorie deficiency Lack of at least one basic need Difficult economic situation *
1. Things are fine or fairly good 4.8 17.6 16.0 14.0 10.1
2. Have to be careful 8.9 41.9 28.7 24.4 22.7
3. Very difficult situation 18.7 62.2 42.9 37.4 50.6
Total 9.8 42.2 29.4 25.1 25.2
Source : ENAHO Survey 2002, INEI, Peru, our own calculations. * : See Madagascar.
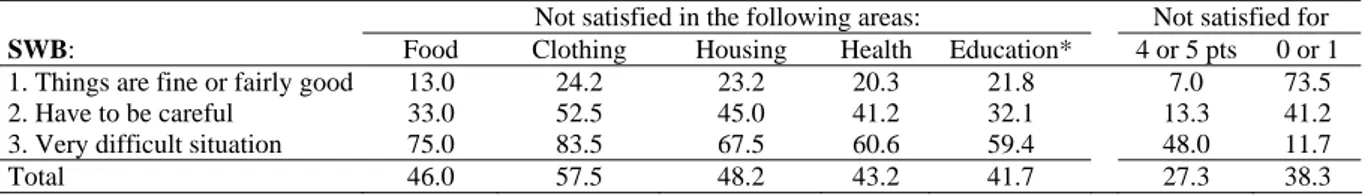
Similarly, in Peru, the incidence of objective poverty defined in terms of monetary poverty, calorie deficiency or unsatisfied basic needs is far higher in the case of households which consider their situation is “very difficult” than for those with a more favourable perception. At the same time, the proportion of households which are obliged to dip into their savings or to get into debt is five times higher among those living in a “very difficult situation” than for those who declare that “things are fine or fairly good.” However, these results show that although there is significant correlation between the different dimensions of poverty, they do not match perfectly, thus confirming the conclusions of previous work on this question (Razafindakoto and Roubaud, 2000, 2004 and 2005b; Herrera, 2001). Apart from overall measurements of poverty, we can try to assess the relationship between households’ perception of well-being and their assessment of whether or not basic needs are satisfied. In both Madagascar and Peru, the less people are satisfied regarding one or other of the basic needs, the worse the overall perception of well-being. However, and once again, the correlation is partial, a non negligible share of households considers that “things are fine or fairly good”, despite the fact that they are not satisfied in certain areas. On the contrary, people can find their situation “very difficult”, although they are satisfied with respect to the five aspects identified in the survey (food, clothing, housing, health and education). This serves to prove that the assessment of well-being is indeed multidimensional and that it goes beyond the mere fulfilment of material needs.
In absolute terms, the share of the population whose needs are not satisfied is far larger in Madagascar than in Peru. The real gaps in living standards between the two countries (to the advantage of the second) are such that they “flatten” to a great extent the phenomenon of attrition of preferences, so that the Madagascans are satisfied with a more limited basket of goods and services and benefits.
Table 6: Perceptions of well-being and satisfaction of basic needs
Madagascar
Not satisfied in the following areas: Not satisfied for
SWB: Food Clothing Housing Health Education* 4 or 5 pts 0 or 1
1. Things are fine or fairly good 13.0 24.2 23.2 20.3 21.8 7.0 73.5
2. Have to be careful 33.0 52.5 45.0 41.2 32.1 13.3 41.2
3. Very difficult situation 75.0 83.5 67.5 60.6 59.4 48.0 11.7
Total 46.0 57.5 48.2 43.2 41.7 27.3 38.3
Sources : 1-2-3 Surveys, phase 1 (Employment), 2001, MADIO/INSTAT, Madagascar; our own calculations. * Only concerns households with children of school age (6 to 14 years).
Peru
Not satisfied in the following areas: Not satisfied for
SWB: Food Clothing Housing Health Education* 4 or 5 pts 0 or 1
1. Things are fine or fairly good 2,4 10,3 8,9 6,1 8,2 0,4 94,8
2. Have to be careful 7,4 25,6 10,9 15,4 9,6 2,0 82,5
3. Very difficult situation 26,0 50,5 26,7 35,5 14,1 8,0 53,1
Total 9,5 27,5 12,9 17,3 10,1 2,6 79,7
Sources: 1-2-3 Surveys, phase 1 (Employment), 2001, MADIO/INSTAT, Madagascar; our own calculations. * Ne concerne que les ménages qui ont des enfants en âge d’être scolarisés (4 à 16 ans).
5.
MULTIVARIATE ANALYSES: THE DETERMINANTS OF SUBJECTIVEWELL-BEING
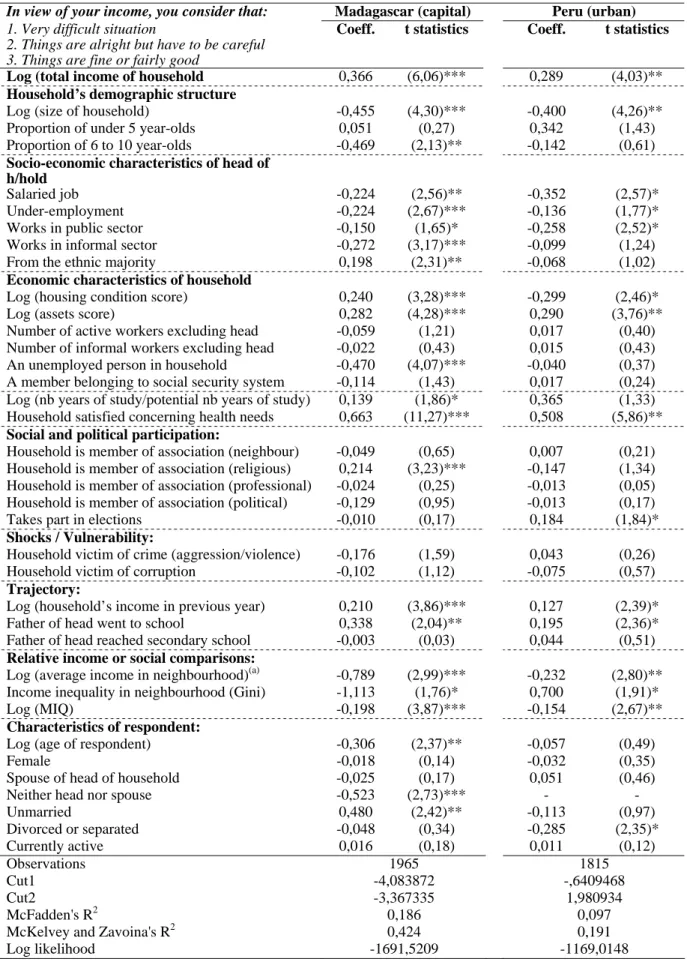
In this section, we try to estimate the factors that count most in determining levels of subjective well-being. In the battery of questions asked during the survey, we selected the most general one, which was also used for the preceding analyses. Its precise wording, both in Madagascar and Peru, was: In view of your household’s income, do you consider that:
1. you live well;
2. things are fairly good;
3. things are alright, but you have to be careful; 4. you live with difficulty
For the purposes of the analysis and given the low number of people in the first response modality, the first two modalities were aggregated.
5.1.
The hypotheses testedWe start by exploring the extent to which the monetary approach (per capita income) is correlated with the assessment of SWB. By stages, we then estimate the impact of the households’ socio-economic and demographic characteristics on the perception of well-being. What role is played by age, gender or status within the household? Does the level of education have an impact on the perception of well-being, once income and the composition of the household have been taken into account? The subjective perception of well-being depends on the gap between aspirations which are considered attainable and actual, or supposed, satisfaction in different areas judged to be consubstantial with living standards. The capacity to aspire appears, in turn, to be closely linked not only to the level of income, but also to the perimeter of the individuals’ cultural environment and to the social interactions in which they are engaged, of which education appears to be a determining factor11. Apart from the
level of education of the individual and the other household members, we also consider whether or not their needs are satisfied in terms of health, their migratory status, ethnic origin, possession of assets and the quality of housing.
It is most likely that the perception of well-being is closely linked to social interactions and in particular to the household’s positioning with respect to the reference group and to the latter’s characteristics. A priori, it is hard to determine the nature of this group; and we cannot rule out the fact that there may be multiple reference groups. For instance, people can compare their living standards with the age group with the same level of qualifications, with the neighbours in the area or in the town, etc. We will test in particular the hypothesis whereby the reference group is comprised of the residential neighbourhood (by looking at the average level of income and inequalities in the local area). These effects must be distinguished from the specific (negative or positive) effects that the different characteristics of neighbourhoods (pollution, crime, proximity of public / private services, etc.) may have, which will be taken into account with neighbourhood indicator variables. Do we find the same results are those obtained by Fafchamps and Shilpi (2003) for Nepal or Lokshin, Umapathi and Paternostro (2004) for Madagascar, just to mention work concerning developing countries? In addition to the reference group, when it comes to the assessment of SWB, individuals probably consider a period of reference based on which they judge their current situation. Making the most of the panel component, our regressions take into account the level of past income12. From a psychological standpoint, according to the discrepancy theory underlined by Michalos (1985), in addition to the situation of the “other” individuals on the one hand, and their own past situation on the other, individuals’ aspirations can be a third comparative norm on which to judge satisfaction. We will try to explore the impact on well being of the households’ income compared with the minimum income considered necessary to make ends meet (MIQ).
Various studies on the impact of unemployment on the subjective assessment of well-being in developed countries have highlighted a negative impact that goes beyond factors relating to the loss of income (Winkelmann and Winkelmann, 1998; Clark and Oswald, 1994). The quality of the job, the institutional sector of labour market attachment and social welfare offered by some jobs can also all be related to the perception of well-being. Vulnerability, the risk of unemployment, hard working conditions, unstable income and the weight of the hierarchy also probably have a specific impact on well-being. Finally, work is a factor of social inclusion and therefore also counts in its own right among the components of well-being.
In the case of Russia, Beuran and Kalugina (2005) found that working in the informal sector had a negative impact on the subjective perception of well-being. The authors pointed out that job insecurity and exclusion from a social benefit system led informal workers to display a lesser degree of subjective well-being than their counterparts in the formal sector. In fact, for this reason these activities can be considered to be among the survival strategies used as relief from the negative shocks
11
On this point, see Appadurai (2004); Ray (2004); Stutzer (2003) and Nathan (2005).
in the transition period. In the case of developing countries, the impact of informal sector employment seems, in principle, more ambiguous. On the one hand, the choice of working in the informal sector appears to be made under duress due to the scarcity of more protected, better paid formal sector jobs. In this case, the informal sector amounts to a refuge for unskilled workers with too few assets to create formal enterprises. Alternatively, employment in the informal sector can be seen as a free decision made on account of the flexible working hours offered, the lack of heavy hierarchy, the wish to be one’s own boss or a preference for a family-based work environment. We take advantage of the detailed investigation of the informal sector and the income it generates, contained in the Madagascan and Peruvian surveys, to test these hypotheses13.
Trajectories and social origins (measured through the father’s education) will be taken into account. Their impact on well-being can come into play in particular through the building of aspirations, the extent of aversion to intergenerational reproduction, in the perspective of equal opportunities. A certain number of idiosyncratic shocks (the household is victim of violence, corruption, etc.) are also taken into account. In addition to the economic loss they cause, the latter can result in an additional loss of well-being. This assumption will be tested. The vulnerability to shocks can be attenuated if the individual can count on support from the family or associative environment. Conversely, the lack of social capital and, more broadly, social exclusion can have a negative impact on the perception of well-being. The non-participation in social and political debate, the lack of “voice” and social involvement and the quality of institutions probably also have an impact on SWB (Frey and Stutzer, 2002).
5.2.
The resultsOne of the most uncontested stylised facts found in the empirical literature on the determinants of SWB is that there is a positive correlation with income. In all the studies where this question has been explored, a positive, significant link has systematically been found (Easterlin, 2001). In addition, income is the dependent variable which always has the strongest explanatory power in econometric analyses (Selnik, 2003). However, all the analyses without exception also show that income does not explain everything. A large percentage of the variance remains unexplained due to the existence of other dimensions of well-being, independent of income. With respect to developing countries, it is generally assumed that the correlation between SWB and income is stronger than in developed countries (Ferrer-i-Carbonnell, 2002).
Table 7 compares SWB levels and income. In order to make the comparison pertinent, the households have been classified in three brackets of per capita income, defined in such a way as to respect the distribution observed for SWB. Cramer’s V coefficient, which measures the strength of association between the subjective dimension and the objective monetary dimension of well-being, indicates that there is significant correspondence between the two dimensions, which holds for both countries. However, the association is higher in Madagascar than in Peru, as Cramer’s V is 0.27 and 0.19 respectively. In both cases, the Cramer’s V coefficients are higher than that obtained by Ravallion and Lokshin (2002a) for Russia (0.14). These results are therefore compatible with the assumption that the monetary dimension of income is greater in the poorest countries.
A second observation can be made when we examine the diagonal of the table. In Madagascar, the two dimensions coincide more for the extreme positions in the distribution, whereas in Peru the correspondence is better for the intermediary position. Among the possible explanations for the propensity of urban Peruvian households to see themselves in the intermediary category, two arguments can be mentioned. For those with the least resources, it can show a refusal to admit to the failure of their social mobility, at the same time avoiding the stigma associated with being poor in urban areas. At the other end of the scale, the dramatic liberalisation of the labour market that has increased the vulnerability of employees in the formal sector, including managers (middle and senior)
13 The module devoted to the informal sector is aimed at reconstructing the accounts of an informal production unit by making a detailed
estimate of intermediary consumption (raw materials, inputs, wages) and the turnover, by product or service offered (see Razafindrakoto and Roubaud, 2002b, for a detailed presentation of 1-2-3 survey methodology).
who are precisely among the higher income brackets, has increased the feeling of professional insecurity, a worry that is reflected in the perception of well-being.
Finally, we can note that the association of SWB and income is far from perfect, given that a strong correlation would result in a Cramer’s V coefficient of 1 or close to 1 (diagonal matrix). This again confirms that the monetary and financial aspects (notwithstanding the question of measurement errors for income) are only one of the dimensions of well-being.
Table 7: Households’ subjective well-being and income
Madagascar Peru
Per capita income Per capita income
SWB: High (37%) Middle (20%) Low (43%) Total (100%) High (10%) Middle (77%) Low (13%) Total (100%)
1. Things are fine or fairly good 54% 34% 21% 36% 30% 8% 3% 10%
2. Have to be careful 25% 22% 17% 21% 66% 78% 70% 76%
3. Very difficult situation 22% 44% 62% 43% 4% 14% 26% 14%
Total 100% 100% 100% 100% 100% 100% 100% 100%
Cramer’s V 0.2670 0.1905
Pearson chi2(4) 310 (significant Pr = 0.000) 4.1e+05 (significant Pr = 0.000)
Sources: 1-2-3 Surveys, phase 1 (Employment), 2001, MADIO/INSTAT, Madagascar; ENAHO Surveys,
household panel 2001-2002, INEI, Peru; our own calculations.
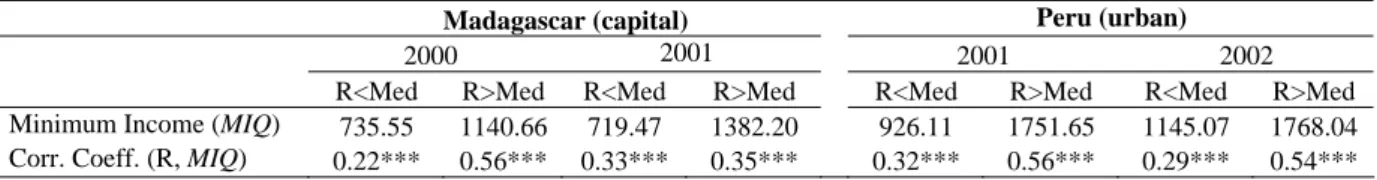
We also find another stylised fact: the increase of aspirations as income rises, or what is known as preference drift. This phenomenon is more marked in Peru than in Madagascar as shown by the correlation coefficients between households’ total monetary income and the Minimum Income Question (MIQ). In the Madagascan capital, this coefficient was 0.46 in 2000 and 0.42 in 2001 (period with slight drop in income), whereas in urban areas of Peru, it was 0.51 in 2001 and 2002. In Lima, the coefficient even reached 0.56 and 0.54 for the two years respectively. The differences observed between the two countries can also be seen between poor and non poor households in each country. In Peru, the correlation coefficient between income and MIQ for the poorest half of the urban population is half that of the households belonging to the wealthiest half of the population (0.29 and 0.54 in 2002). The contrast between poor and rich households is even more striking in the capital of Madagascar, though seems to vary over time. For households in the lower half of the distribution, the correlation between their income and the minimum income required to make ends meet is very low. This implies that they aspire to a basic consumer basket, probably closer to a physiological minimum required for the reproduction of an urban household. On the contrary, the correlation for the wealthiest half is positive and significant, close to that of rich Peruvian households. In 2001, the correlation fell to 0.35 in a context of stagnation in income. In fact, needs expressed in the amount considered necessary to live decently is considered more in relative terms in Peru than in Madagascar. This result probably explains why high income Peruvian households are relatively less satisfied in terms of well-being, as their aspirations have grown more quickly than their real income.
Table 8: Perceived of household's minimum necessary income and observed income
Madagascar (capital) Peru (urban)
2000 2001 2001 2002
R<Med R>Med R<Med R>Med R<Med R>Med R<Med R>Med
Minimum Income (MIQ) 735.55 1140.66 719.47 1382.20 926.11 1751.65 1145.07 1768.04
Corr. Coeff. (R, MIQ) 0.22*** 0.56*** 0.33*** 0.35*** 0.32*** 0.56*** 0.29*** 0.54***
Sources: 1-2-3 Surveys, phase 1 (Employment), 2000-2001, MADIO/INSTAT, Madagascar; ENAHO Surveys, household panel 2001-2002, INEI, Peru; our own calculations.
Note: R<Med: per capita income lower than median. Average Minimum Income (MIQ), FMG (Madagascar) and New Sols (Peru). *** : significant at 1%. Number of observations: 2,178 households in Madagascar and 2,927 in Peru.
In order to assess the extent to which monetary income explains the assessment of living standards, we estimate an ordered probit model with, to start, the total income of the household as the only explanatory variable. We will then add different factors to the model, concerning the household’s