HAL Id: hal-03107317
https://hal.archives-ouvertes.fr/hal-03107317v2
Submitted on 4 Feb 2021
HAL is a multi-disciplinary open access
archive for the deposit and dissemination of
sci-entific research documents, whether they are
pub-lished or not. The documents may come from
teaching and research institutions in France or
abroad, or from public or private research centers.
L’archive ouverte pluridisciplinaire HAL, est
destinée au dépôt et à la diffusion de documents
scientifiques de niveau recherche, publiés ou non,
émanant des établissements d’enseignement et de
recherche français ou étrangers, des laboratoires
publics ou privés.
Distributed under a Creative Commons Attribution| 4.0 International License
Large-scale regulatory and signaling network assembly
through linked open data
Marie Lefebvre, Alban Gaignard, Maxime Folschette, Jérémie Bourdon,
Carito Guziolowski
To cite this version:
Marie Lefebvre, Alban Gaignard, Maxime Folschette, Jérémie Bourdon, Carito Guziolowski.
Large-scale regulatory and signaling network assembly through linked open data.
Database - The
journal of Biological Databases and Curation, Oxford University Press, 2021, 2021, pp.baaa113.
�10.1093/database/baaa113�. �hal-03107317v2�
doi:10.1093/database/baaa113 Original article
Original article
Large-scale regulatory and signaling network
assembly through linked open data
M. Lefebvre
1, A. Gaignard
2, M. Folschette
3, J. Bourdon
4and
C. Guziolowski
4,*1UMR 1332 Biologie du Fruit et Pathologie, INRAE, Univ. Bordeaux, 72 Avenue Edouard Bourlaux,
CS20032, 33882, Villenave d’Ornon cedex, France,2Université de Nantes, CNRS, INSERM, l’Institut du Thorax F-44000, Nantes, France,3Univ. Lille, CNRS, Centrale Lille, UMR 9189 - CRIStAL - Centre de Recherche en Informatique Signal et Automatique de Lille, F-59000 Lille, France and4Université de Nantes, Centrale Nantes, CNRS, UMR 6004 - LS2N - Laboratoire des Sciences du Numérique de Nantes, F-44000 Nantes, France
*Corresponding author: Tel: (+33) 2 51 12 58 85; Email:[email protected]
Citation details: Lefebvre, M., Gaignard, A., Folschette, M., et al. Large-scale regulatory and signaling network assembly through linked open data. Database (2021) Vol. 2021: article ID baaa113; doi:10.1093/database/baaa113
Received 25 June 2020; Revised 30 November 2020; Accepted 11 December 2020
Abstract
Huge efforts are currently underway to address the organization of biological knowl-edge through linked open databases. These databases can be automatically queried to reconstruct regulatory and signaling networks. However, assembling networks implies manual operations due to source-specific identification of biological entities and rela-tionships, multiple life-science databases with redundant information and the difficulty of recovering logical flows in biological pathways. We propose a framework based on Semantic Web technologies to automate the reconstruction of large-scale regulatory and signaling networks in the context of tumor cells modeling and drug screening. The pro-posed tool is pyBRAvo (python Biological netwoRk Assembly), and here we have applied it to a dataset of 910 gene expression measurements issued from liver cancer patients. The tool is publicly available athttps://github.com/pyBRAvo/pyBRAvo.
Introduction
Systems biology is a research area aimed at obtaining a better understanding of biological interactions at several levels. The associated activities require combining multi-ple databases to integrate information, and computational modeling (1) addresses the complexity of this integration process. Graph-based modeling approaches are particu-larly suitable for elucidating biological systems because
they structure information in an organized (possibly causal) way to represent the relation between complex compo-nents such as genes, proteins and protein complexes. For instance, graph structures represent inhibition of activation in gene regulatory networks (GRNs) or protein stimulation in signaling networks (SNs). These networks can be easily transferred to computational models, which can perform complex combinatorial analyses or simulations to extract
© The Author(s) 2021. Published by Oxford University Press. Page 1 of 12
This is an Open Access article distributed under the terms of the Creative Commons Attribution License (http://creativecommons.org/licenses/by/4.0/), which permits unrestricted reuse, distribution, and reproduction in any medium, provided the original work is properly cited.
(page number not for citation purposes)
network properties or predict system states. Several sys-tems biology approaches use computational models built upon biological networks to understand human diseases. For example, researchers have previously undertaken the construction and kinetic modeling of a Parkinson’s disease interaction map (2), while others have combined the cross-talk of multiple T-cell receptor pathways to understand immune response (3).
To assemble such graphs, multiple data or knowledge bases must be integrated. This integration effort is cur-rently facilitated through several initiatives aimed at better organization of biological knowledge and its open avail-ability, such as Reactome (4), Kyoto Encyclopedia of Genes and Genomes (KEGG) (5), PathwayCommons (PC) (6), WikiPathways (7), Pathway Interaction Database-NCI (8), Consensus PathDB (9), OmniPath (10) and hiPathDB (11), among others. These databases can be automatically queried to reconstruct a large variety of biological networks such as GRNs or SNs.
Some of these databases, such as KEGG, WikiPath-ways, PC ChiBE (12) and Reactome, provide an explicit representation and a user-oriented visualization to bet-ter understand biological phenomena. However, they do not include query mechanisms to automate the recon-struction of possibly complete (across multiple pathways) upstream subgraphs from a list of genes of interest. For other databases, specific tools have been devel-oped to automate network reconstruction from a list of input genes. These tools include CyPath2 (13), PCViz (https://www.pathwaycommons.org/pcviz/), PyPath (10) and ReactomeFIViz (14), all of which produce graphs representing biological networks. However, due to their modeling choices, derived computational models often fail in representing causal biological flows. For example, the CyPath2, PCViz, ReactomeFIViz and PyPath tools repre-sent protein complexes as a set of interacting entity mem-bers (cycles) without including the complex itself as a node in the graph. In contrast, KEGG, WikiPathways, ChiBE and Reactome visualization tools keep protein complexes in the visualization as nodes. The first modeling choice may strongly influence computational modeling because cycles can generate oscillations in simulations. These artificial oscillations do not represent a biological reality.
Single-source tools for reconstruction of GRNs and SNs such as ReactomeFIViz and KEGGscape (18) do not enable tackling the challenges arising from the integration of bio-logical data from multiple sources. PC and OmniPath are two large-scale initiatives in that direction: they integrate several existing data sources—PC covers 24 resources and OmniPath covers 34 resources—thus allowing to combine multiple knowledge bases. However, scientists face a mas-sive amount of query results when querying resources, and
they consequently need efficient and scalable algorithms to exploit their richness.
We identified the following issues that need to be addressed to enable better modeling of biological systems: (i) combining multiple data sources, possibly at multiple scales; (ii) automating the exhaustive reconstruction of multi-source multi-pathway networks and (iii) leveraging biological semantic models to represent causal biological flows. In this paper, we propose pyBRAvo as a compu-tational framework based on Semantic Web technologies (BioPAX ontology) and multiple public data source (PC) to automate the reconstruction of human multi-source and multi-pathway GRNs and SNs.
Material and methods
PathwayCommons
PC (6) is a large-scale initiative aimed at integrating bio-logical pathway data collected and curated from multiple data sources and making the information accessible. At the time we evaluated our tool, PC version 11 encompassed 22 data sources, 9500 pathways, 3 million interactions and 1.5 million entities. In the updated version 12, PC integrates 22 data sources and provides information on more than 11,500 pathways, 2.4 million interactions and 1.2 million entities. Some of the data sources focus on pathway information such as SMPdb, Reactome, KEGG or WikiPathways, while other sources focus on biological interactions such as BioGRID or IntAct. PC relies on Linked Data (15) principles to make this massive pathway knowl-edge interpretable from both human and computational points of view. Linked Data provides standards to repre-sent and link resources as public knowledge graphs on the web, and resource description framework (RDF) (16) is the W3C standard used to represent these knowledge graphs. It is particularly suitable for representing biological knowl-edge because it allows the representation of directed labeled graphs. In addition, these resources as well as their relations can be strongly typed with controlled vocabularies or more formal ontologies. In particular, PC leverages the BioPAX ontology (17) to provide a standard and uniform view of these multiple and diverse databases. Finally, thanks to the support of Semantic Web standards and technologies, espe-cially the SPARQL query language, this massive biological pathway knowledge graph can be queried on live up-to-date biological data to mine and retrieve specific graph patterns.
Gene regulatory and SNs reconstruction Network reconstruction algorithm
With pyBRAvo, we propose a method to automati-cally assemble GRNs and SNs based on query rewriting.
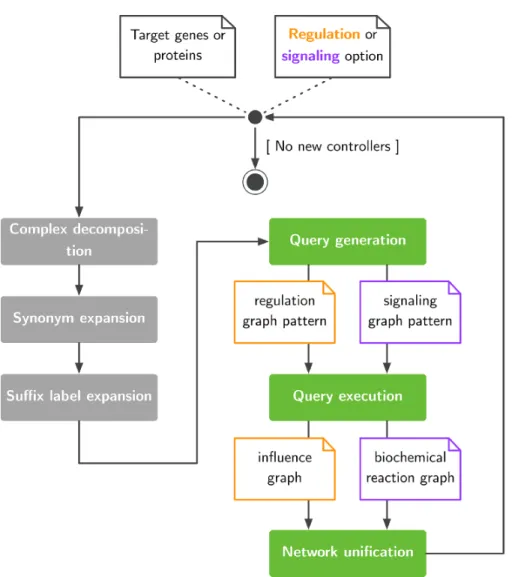
Figure 1. Exploration of large pathway databases to assemble gene regulatory and signaling networks.
pyBRAvo leverages publicly available datasets through the PC initiative. Figure 1 presents the network reconstruc-tion algorithm. pyBRAvo first takes a list of genes or protein names as input. This list is then augmented with three optional text-based processings (gray boxes) aimed at decomposing protein complexes, inserting synonyms and inserting suffixes commonly found in PC. These pro-cessings are described in the ‘Query expansion and net-work unification’ section. Then, the query generation step produces two pattern-matching expressions (see Supple-mentary Methods A.2) according to the specific kind of network to be reconstructed (i.e. GRNs or SNs). The gen-erated query is executed on the remote PC data source, and results are recursively explored until no new controllers can be found or the maximum exploration depth has been reached. Users obtain their results in the form of a for-mal graph, which can be either an influence graph or an hyper-graph (see Supplementary Methods A.3).
Query expansion and network unification
To match the maximum number of entities during the net-work reconstruction process, we propose the following optional pre- and post-processings, as shown inFigure 1.
Complex decomposition. Protein complexes can be
iden-tified in BioPAX knowledge bases either through their semantic type (bp:Complex) or by a label concatenating several names, separated with special characters. For per-formance concerns, we favored a syntactical approach that consists of splitting the label into several names and adding these names to the list of biological entities to be explored in following iterations.
Label expansion. Although BioPAX allows modeling
sev-eral forms of biological entities, some databases express specific forms through a prefix or a suffix in entity labels, such as expression of or mutant form. To maximize entity retrieval, we dynamically expand the regulation and
signaling queries with a set of predefined prefixes and suf-fixes when reconstructing the interaction network. These prefixes and suffixes are removed when entities are added to the regulation or SN.
Synonym expansion. To enhance the matching of genes
or protein names, we account for common synonyms as registered in the NCBI Gene Info database (Homo_sapi ens.gene_info). For each biological entity name retrieved through PC, we extend the regulation or signaling queries with their synonyms for further exploration.
Network unification. Finally, we reuse the NCBI Gene
Info database to merge synonym graph nodes into nodes identified with their common name. This computation (of merging synonyms) is done for each analysis. Thus, two graphs are always proposed: one that is unified and another that is not.
Experimental datasets
Two datasets are used in this work as the basis of use-cases to illustrate the application of pyBRAvo. Both datasets pertain to the study of human hepatocellular carcinoma (HCC).
EMT signature-based dataset of 910 genes
A gene expression profile based on the differential expres-sion (DE) of 16 283 genes in human liver cells was obtained from the LIHC-US project (Liver HCC—TCGA, US, Release 21. https://dcc.icgc.org/releases/release_21/Proj ects/LIHC-US) of the International Cancer Genome Con-sortium (ICGC) database (18). The RNAseq expression of these genes was measured across a population of 294 patients with liver cancer. The DE of genes was obtained by comparing patients with liver cancer at an invasive stage with patients whose cancer was at an early and non-invasive stage. Similar to a previously used approach (19), this comparison was based on the detection of epithelial–mesenchymal transition (EMT), the process by which cells acquire invasive and migratory abilities. The output of this DE analysis is a list of 910 genes that were notably over-expressed (fold-change > 2) or under-expressed (fold-change <−0.5) under the constraint P < 10−5. These 910 genes are used as input for our
software in the ‘Gene regulatory network reconstruction’ and ‘Signaling network reconstruction’ sections.
Metabolic model-based dataset of 39 genes. In (20), pyBRAvo was used to feed a probabilistic model aimed at predicting the impact of drugs on cell growth rate in the context of HCC. More precisely, in this use-case, we used the iLivercancer1715 model proposed by (21). This metabolic model consists of 4663 metabolic reactions and 5735 metabolites, together with an objective function that
describes the biomass growth of the HCC tumor cell. Since the model is reconstructed based on the human metabolic reaction model, deriving the list of 2881 genes with a direct effect on the metabolic reactions of HCC is straightfor-ward. Notice that a single reaction deletion analysis can be used to filter the obtained list to the genes having an effect on the objective function of the metabolic model, sim-ilar to a flux balance analysis. This filtered list, containing
39 genes, serves as the list of target genes in an upstream
gene regulation network reconstruction by pyBRAvo in the ‘Gene regulatory networks for drug screening applications’ section.
Evaluation metric computation: coverage
To illustrate the construction of SNs (see the ‘Signaling network reconstruction’ section), we compared pyBRAvo (see the ‘Query expansion and network unification’ section) with the algorithm proposed using PyPath functionalities (see the ‘Signaling network reconstruction’ section). Both tools retrieve graphs from a list of input genes. The cover-age metric used for this study measures the number of input genes belonging to the output graph. It is computed based on the following formula:
S =|ON| ÷ |IG| × 100
where ON is the set of input genes belonging to the out-put graph and IG is the set of inout-put genes, ON⊆ IG. This
metric represents how well the knowledge of the database, extracted with the specific tool (pyBRAvo or PyPath), cov-ers the initial gene dataset. The coverage was used to interpret our results when reconstructing SNs and GRNs.
Results
We applied pyBRAvo to reconstruct two different types of networks using the same gene expression profile. In the first one (‘Gene regulatory network reconstruction’ sec-tion), we built a regulatory network and modeled it using Iggy, a tool based on Answer Set Programming that per-forms a sign-consistency analysis comparing biological net-works with experimental observations (22). In the second one (‘Signaling network reconstruction’ section), we used pyBRAvo to reconstruct an SN and compared the obtained results using PyPath, a Python package designed to query the OmniPath database (version of October 2019) to work with molecular network interpretations from this database. Finally, we show in the ‘Gene regulatory networks for drug screening applications’ section how pyBRAvo can be used in a drug-screening application to enrich potential target genes and associated candidate drugs.
GNN reconstruction
We used pyBRAvo to query the PC database (version 11), excluding both miRTarBase and MSigDB sub-databases, to generate a regulatory network that explains the upstream events of the 910 genes selected based on the EMT signature (see the ‘Experimental datasets’ section). The miRTarBase database was excluded because it contains negative interac-tions due to miRNA entities, for which we had no experi-mental observations. MSigDB was excluded because of the absence of signs/roles in the effect of all its interactions; MSigDB interactions are obtained via computational pre-dictions on the gene binding sites. The reconstruction was limited to a recursion depth of 10 levels. This graph was obtained using the Python command line script of pyBRAvo (Command: python pyBRAvo.py -reg -md 10 -sy -su -co -f input.csv -excl mirtarbase msigdb); this call used the search of synonyms, complex decomposition and label expansion options explained in the ‘Query expan-sion and network unification’ section. The search took 25 minutes and 11 seconds of computation time (On a stan-dard laptop computer with an Intel Core i7-6600U CPU of 4× 2.60GHz, 16Gb memory and running Ubuntu 18.04.)
when the private SPARQL endpoint was used. Comput-ing the same pyBRAvo call usComput-ing the PC SPARQL endpoint took 98 minutes and 9 seconds.
We obtained a directed and partially signed graph com-posed of 1678 nodes and 4425 edges, among which 3719 are signed (as activation, inhibition) and 599 are labeled by pyBRAvo as PART_OF to denote the oriented rela-tion between a protein and the protein complex it belongs to. Among the 1678 nodes, 330 can be identified as pro-tein complexes, and 27 of them are propro-tein complexes of small molecules; the other 1321 nodes can be identified as proteins or genes. The edges of this graph represent tran-scriptional regulation interactions and complex formation interactions. From the 910 queried genes, pyBRAvo recov-ered the upstream events for 691 (76% of coverage) of them. The reason that not all 910 original genes were found is that not all genes are documented in the queried resources of PC as being regulated by transcription factors. Indepen-dently from this study, we used the same list of 910 genes to query the KEGG database for upstream (transcriptional) regulators and we obtained only 63 genes (6% coverage) that were upstream regulated.
Provenance
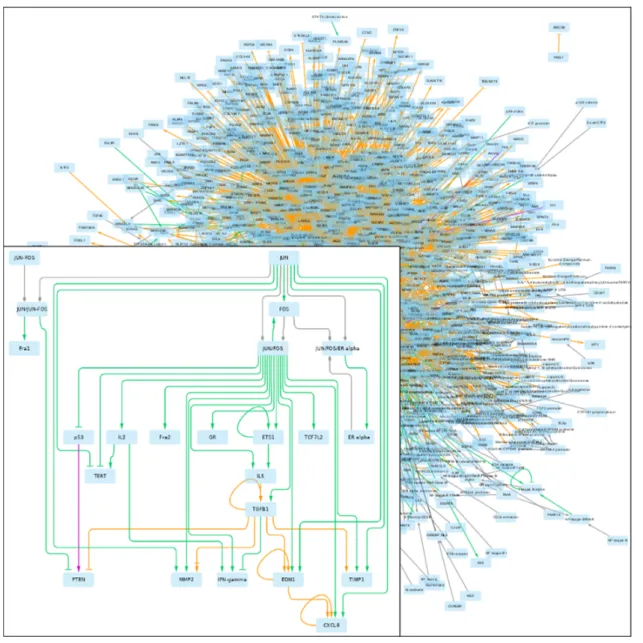
In this case study, we were interested in understanding how different databases provide information that enables the construction of a graph explaining the EMT signature genes. InFigure 2, we show a graph that was retrieved; its edges are colored according to the source database.
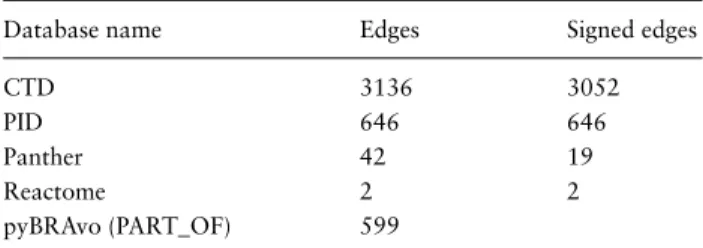
Table 1. Distribution of the provenance of the 4425 transcrip-tional regulation edges returned by pyBRAvo
Database name Edges Signed edges
CTD 3136 3052
PID 646 646
Panther 42 19
Reactome 2 2
pyBRAvo (PART_OF) 599
The first column gives the name of each database that returned edges, where PART_OF stands for pyBRAvo’s specific result: edges representing the association of proteins with the protein complexes they belong to. The second column gives the total number of edges found in the database, which can be of signed type (activation or inhibition) or unsigned type. The third column gives the number of signed edges among them.
The Cytoscape session of this figure is available online (https://github.com/pyBRAvo/pyBRAvo/blob/master/cytosc ape-vis/regulation_paper_sept.cys). In Table 1, we show the number of different edges retrieved per database. Since Pathways Commons information remains highly heteroge-neous, each database uses its own vocabulary to represent the knowledge. Therefore, the options of complex
decom-position, synonym expansion and label expansion provided
by pyBRAvo are useful to obtain a more complete and less disconnected graph. Indeed, without these options, the graph has only 172 nodes and is made of five disconnected cliques.
Feeding computational modeling tools for Systems Biology users
What we understand as a computational model is a mathe-matical framework that uses either a computational sim-ulator or a solver to discover underlying properties of a (biological) graph, such as a computational prediction of unobserved species behavior. In a computational model-ing tool, mathematical equations, logical rules or con-straints are involved. One of the motivations in conceiving pyBRAvo was to ease the automatic transfer from knowl-edge databases toward such computational models.
To illustrate this transfer, we built a discrete mathe-matical model integrating the pyBRAvo regulatory network without the 106 unsigned edges, obtained from Pathways Commons, and the up- and down-regulation DE mea-surements of the 910 genes obtained from ICGC. This mathematical model follows the sign-consistency approach implemented in the Iggy framework (23), which uses clasp, a conflict-driven Answer Set solver used in the study of NP-hard search problems (24). Iggy tests the consistency between the network logic (signs and directionality) and the DE information of the genes (up/down shifts of regu-lation). Interactions labeled as activations and inhibitions were modeled by Iggy using plus and minus signs, respec-tively. Interactions labeled as PART_OF were modeled by
Figure 2. GRN returned by pyBRAvo. The color code of the edges gives their provenance: orange for CTD, purple for Panther, green for PID, red
for Reactome and gray for the expansion of protein complexes. The edge tips depend on the interactions type: triangle for an activation, bar for an inhibition, arrow with bar for an unknown interaction type and diamond for a complex composition. This graphical export was made with Cytoscape 3.7 (13), following the instructions of Supplementary Methods G.
Iggy using a plus sign, and we considered protein com-plex formations as positive influences. The model had to be minimally corrected in 148 interactions before being consistent with the experimental observed up/down shifts. Afterwards, we obtained 82 predictions in unmeasured network components (see Supplementary Table S3). We validated these model predictions by comparing them with the original DE data of the genes that were not used for the graph reconstruction or as experimental observations. Here, we consider that a gene with positively (resp. neg-atively) differentially expression should be predicted posi-tively (resp. negaposi-tively). Among the 82 predicted genes, 63 were found in the 15 373 genes from the experimental DE data. Of these 63 genes, 29 had a prediction matching the
experimental data and 34 had a converse prediction. It is beyond the scope of this paper to analyze these computa-tional prediction results. However, we deemed it important to present a concrete example of how pyBRAvo processing of information can provide a bridge from the PC regulatory knowledge to concrete modeling frameworks such as Iggy. In Supplementary Table S4, we give details for this case study concerning the evolution of the graph retrieved using the same pyBRAvo options for 2 and 10 levels of depth.
SN reconstruction
In this section, we illustrate how SNs, in the forms of
influ-ence graphs, are obtained with pyBRAvo (see the ‘Gene
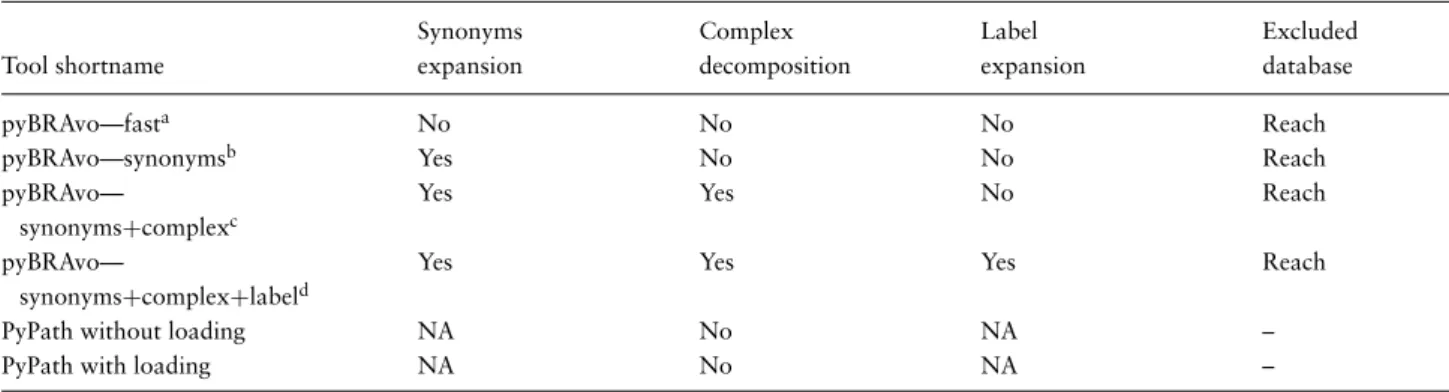
Table 2. pyBRAvo allows multiple configurations for the upstream exploration calls as described in the ‘Gene regulatory and signaling networks reconstruction’ section
Synonyms Complex Label Excluded
Tool shortname expansion decomposition expansion database
pyBRAvo—fasta No No No Reach
pyBRAvo—synonymsb Yes No No Reach
pyBRAvo—
synonyms+complexc
Yes Yes No Reach
pyBRAvo—
synonyms+complex+labeld
Yes Yes Yes Reach
PyPath without loading NA No NA –
PyPath with loading NA No NA –
aOption -fa,bOption -sy,cOption -sy -co,dOption -sy -co -su. The fast option only explores BioPAX display names (bp:displayNames); the synonyms option explores synonyms that have been retrieved from the NCBI Gene database; the complex option splits a protein complex into its protein components, and these proteins are integrated into the following upstream search and finally, the label expansion option allows including several forms (added suffixes, prefixes) of an entity in the upstream search. The PyPath loading option accounts for the time it takes to load the database before the algorithm is executed.
regulatory and signaling networks reconstruction’ section) using the 910 genes selected on the basis of EMT signatures (see the ‘Experimental datasets’ section). The specificity of this SN reconstruction process is demonstrated through a comparison of pyBRAvo with a similar state-of-the-art tool, PyPath (10). We focus on global characteristics of the reconstruction process, such as the size of the retrieved graphs and the computational time. We also deepen this analysis by using classical graph metrics, such as the num-ber of cliques and the nature of the motifs in the retrieved graphs.
Recursive upstream retrieval algorithm using PyPath
PyPath is a Python module conceived to query and manip-ulate the OmniPath database. PyPath provides various functionalities such as the search for protein identifiers and their up- or downstream elements documented in the OmniPath database. PyPath allows searching for direct predecessors from a list of target nodes; however, the com-plete reconstruction of a SN related to the upstream events from a list of target nodes is not available. Therefore, we implemented an algorithm using the PyPath functions as described in Supplementary Figure S6. This algorithm does not require specific ID management (aliases, synonyms) because OmniPath already provides pre-processed IDs. Indeed, in OmniPath, all identifiers from the original databases (Gene Symbol, Entez Gene ID, Ensembl Gene or Protein, HGNC name, etc.) have been converted to SwissProt. Our tests using this tool were conducted during October 2019.
Experimental setup. To give an overview of the
perfor-mance of pyBRAvo and PyPath, we evaluated each tool with various settings as shown inTable 2. The evaluation of both tools was based on the following metrics: (1) the reconstruction execution time, (2) the number of nodes and
edges of the output graph and (3) the coverage of the input gene list (see the ‘Evaluation metric computation: coverage’ section). For both reconstructions, we chose to recover only signed interactions (pyBRAvo option -unk).
Execution time
We compared the execution time (pyBRAvo and PyPath calls where executed from a standard laptop machine equipped with Intel® Xeon®CPU E5-2620 0 @ 2.00GHz x 18 and 32Gb of RAM memory) needed by pyBRAvo and PyPath to separately reconstruct a signed SN from the same dataset, by varying the reconstruction depth from 2 to 10 levels with a step of 2 (see Supplementary Figure S7). This comparison was done using the settings shown in Table 2. We briefly review these results in the following paragraphs, and more details can be found in Supplementary Methods E.
Cost of update. pyBRAvo queries of the private server are
faster, although the data may be outdated in the long term. Depending on the call, the private SPARQL endpoint allows pyBRAvo to obtain a reduction of the computa-tion time in a range of 31–49% of the time obtained when querying the PC endpoint. While pyBRAvo allows recon-structing biological networks on ‘fresh’ publicly available data, we note that client–server communication overheads must be considered with respect to computation time. In the context of large-scale biological network reconstruc-tions, we thus recommend deploying a private SPARQL server. This will enhance computation time, as well as limit overloading public resources. A detailed comparison with PyPath computational time for similar queries is shown in Supplementary Methods E.
Cost of modeling choice. The pyBRAvo option complex decomposition greatly increases computational time for
graph reconstruction (see Supplementary Figure S7). This
increase occurs because pyBRAvo includes the protein complexes as nodes in the graph and links them to their protein members. Although PyPath also includes the mem-bers of protein complexes, it does not represent a node protein complex in the graph (see Supplementary Methods E). A PyPath modeling choice may generate artificial oscilla-tions between members of a protein complex. In particular, for the reconstruction of 10 levels of depth, the PyPath graph had 6814 interactions; 31.5% of them belonged to a cycle of size 2 (i.e. a motif A→ B, B → A). For the
pyBRAvo graph, only 5.6% of 5252 interactions were in a cycle of size 2. Moreover, when computing the number of cliques (see Supplementary Figure S8), we observe that the pyBRAvo graph contains at most two cliques of size 5, while PyPath has 1392 of size 5 and its largest clique is of size 10.
Cost of identifiers homogenization. An explicit
representa-tion of the PC BioPAX informarepresenta-tion, using the entity sym-bols, generates graphs with components that refer to the same entity being artificially disconnected. pyBRAvo pro-poses to homogenize protein identifiers in two ways (see the ‘Query expansion and network unification’ section): (i) by performing a post-treatment that removes suffixes and pre-fixes, also called unification; and (ii) by performing an upstream exploration of their symbol synonyms and/or per-forming a label expansion. Therefore, the respective calls (option synonyms) are more expensive.
Graph
The results with respect to graph content are summarized in
Figure 3. We do not consider outdated vs. updated calls of either PyPath or pyBRAvo because the results were iden-tical. We observe that each additional pyBRAvo option, presented above, improves the quantity of nodes and edges of the retrieved graph. This increase in the number of nodes and edges grows rapidly until reaching a plateau at the fourth level of recursion depth. This stabilization likely occurs because further explorations point to components that have already been found. The large gap that opens when using the pyBRAvo—complex call appears because of the new entities created and explored.
We focus now on the signed SNs obtained for the 10-level upstream exploration query with PyPath and pyBRAvo (call pyBRAvo—synonyms+complex+label in
Table 2). The PyPath graph is composed of 6814 signed edges, labeled as stimulation, inhibition and stimulation
and inhibition (291 edges), while the pyBRAvo graph has
5252 edges labeled as activation, inhibition and part_of. The PyPath graph contains only protein nodes (2049), while the pyBRAvo graph is composed of 2642 nodes of two different kinds, proteins (1571) and complexes (1071).
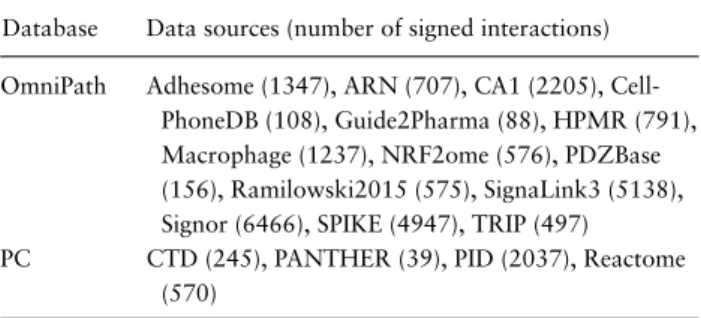
Table 3. Sources used to build the graphs using either PyPath (querying OmniPath) or pyBRAvo (querying PC)
Database Data sources (number of signed interactions)
OmniPath Adhesome (1347), ARN (707), CA1 (2205), Cell-PhoneDB (108), Guide2Pharma (88), HPMR (791), Macrophage (1237), NRF2ome (576), PDZBase (156), Ramilowski2015 (575), SignaLink3 (5138), Signor (6466), SPIKE (4947), TRIP (497) PC CTD (245), PANTHER (39), PID (2037), Reactome
(570)
Most of these complexes are protein complexes (1067), while the rest are small molecule complexes. This different nature of the entities may create the observed difference in node and edge size shown inFigure 3.
We measured a coverage of 16.48% of the 910 input genes for the PyPath graph and of 10.9% for the pyBRAvo graph. These results indicate that in both databases (OmniPath and PC), the tools recovered upstream signal-ing events for only a small fraction of the 910 genes. PyPath information, however, had a better coverage for this dataset. We can see inTable 3 that PyPath and pyBRAvo query different types of resources.
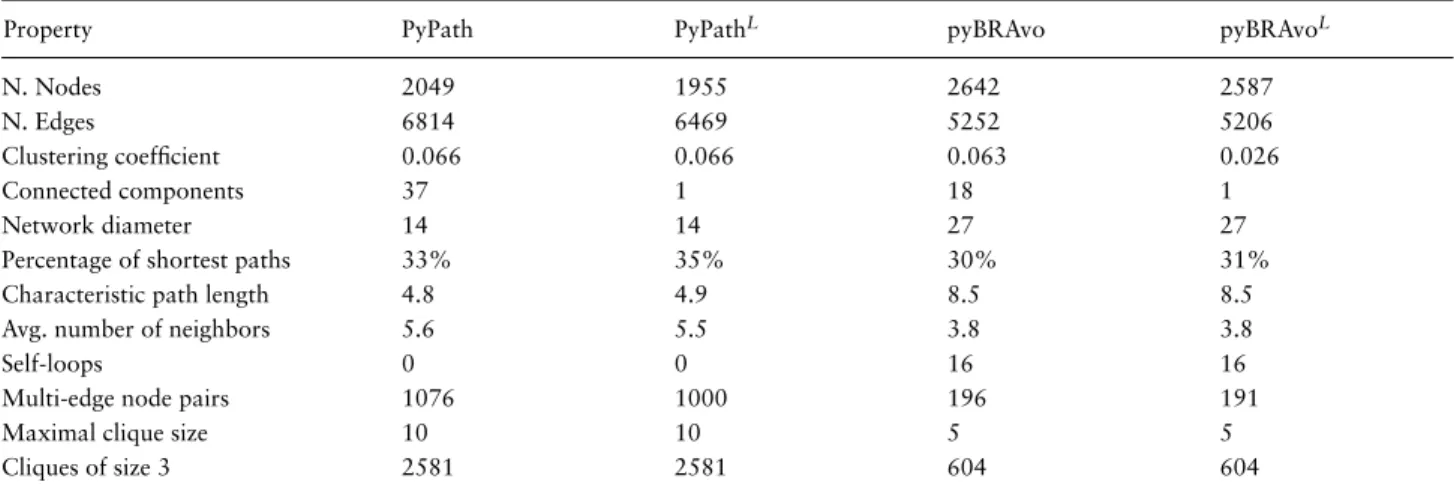
In Table 4, we show the different topological proper-ties of both graphs. We can observe, for example, that the PyPath graph has more connected components than the pyBRAvo graph (37 vs. 18), suggesting that the information in PC, as interpreted by pyBRAvo, appears easier to assem-ble with respect to signed controlled signaling reactions. The pyBRAvo graph presents signed self-loops, which are real biological mechanisms useful in dynamic modeling. The PyPath graph shows 15.7% of multiple edges as related to the same pair of nodes, while the proportion is 3.7% in the pyBRAvo graph. This outcome shows that an inter-action can be retrieved multiple times by different data sources contained in either Omnipath or PC, and repeated retrieval happens more often in Omnipath than in PC. From the number of cliques computed, we observe that the PyPath graph has a larger proportion of cliques than the pyBRAvo graph (see Supplementary Figure S8). In (25), it was observed that cliques in interaction graphs (protein– protein networks) can be associated with protein complex entities. Since the PyPath graph does not contain entities related to protein complexes, this information may need to be retrieved from an enumeration of cliques; whereas, in the pyBRAvo graph, this enumeration of cliques is not necessary because the graph is composed of protein com-plex nodes. SNs are known to present a structure in which chains of cascades are combined. From the diameter and characteristic path length information, we observe that the pyBRAvo graph is composed of longer (27 vs. 14 in
Figure 3. Comparative analyses of the networks obtained with pyBRAvo and PyPath. The horizontal axis represents the level of reconstruction depth
of the SN. Bars plot show measures of the number of nodes; lines show the number of edges, the y-axis (left) is shown in a logarithmic scale.
Table 4. Network analysis of the PyPath and pyBRAvo signed and directed graphs
Property PyPath PyPathL pyBRAvo pyBRAvoL
N. Nodes 2049 1955 2642 2587
N. Edges 6814 6469 5252 5206
Clustering coefficient 0.066 0.066 0.063 0.026
Connected components 37 1 18 1
Network diameter 14 14 27 27
Percentage of shortest paths 33% 35% 30% 31%
Characteristic path length 4.8 4.9 8.5 8.5
Avg. number of neighbors 5.6 5.5 3.8 3.8
Self-loops 0 0 16 16
Multi-edge node pairs 1076 1000 196 191
Maximal clique size 10 10 5 5
Cliques of size 3 2581 2581 604 604
The upper ‘L’ refers to the largest connected component found in each respective graph. Both graphs represent signaling knowledge as stored in Omnipath and PC, respectively, on October 2019.
diameter) chains (directed paths) than PyPath. We inter-pret these longer chains of entities as being a result of the complex formation in pyBRAvo’s representation. In Sup-plementary Figure S9, we observe that this distribution of shortest length paths is more dispersed in the pyBRAvo graph compared with the PyPath graph. These chains are an essential way of representing the signaling knowledge; a computational model that includes them enables a better representation of biological reality.
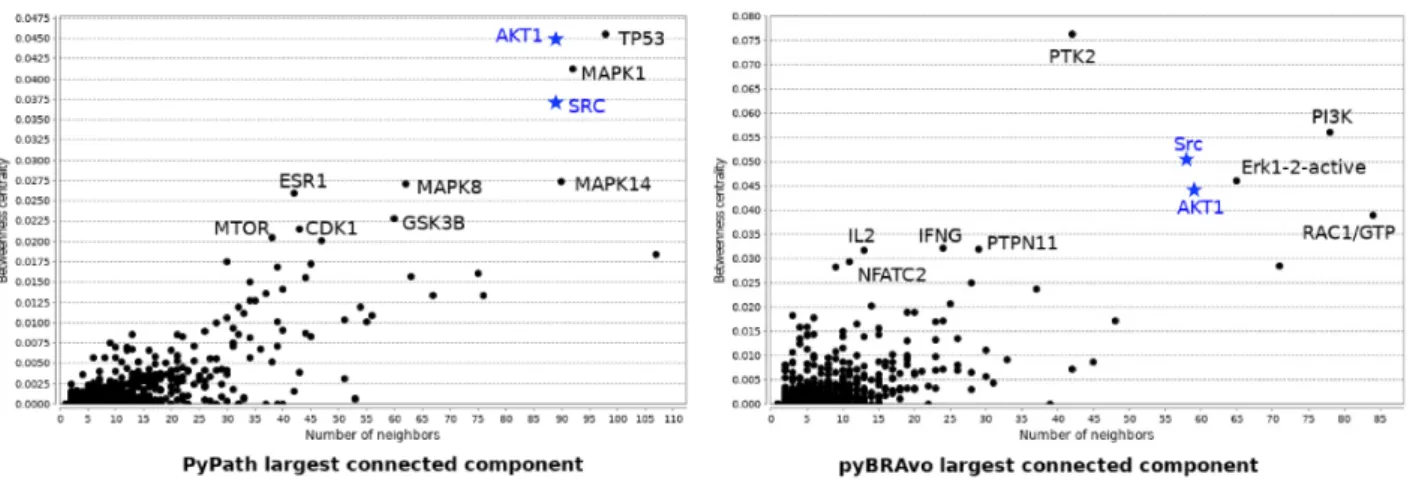
We also compared the largest connected component of both tools in terms of the betweenness centrality score with respect to the number of neighbors, and plotted the names of the 10 top-ranked species having the highest betweenness
centrality score (seeFigure 4). We observe that 2 of the 10 top-ranked species are shared in both graphs; whereas, the other species are specific to each approach. A last analy-sis of these graphs was for detecting the types of motifs within them. To this end, we used the MotifNet web ser-vice (26). We observe that several of the 3-size motifs were shared (four out of five for pyBRAvo, and four out of six for PyPath) between both graphs. However, pyBRAvo has fewer motifs including cycles than PyPath (see Supplemen-tary Figure S10). For the case of 4-size motifs (data not shown), the difference is more marked: the PyPath graph contains 69 significant motifs, while the pyBRAvo graph has only 42. The main difference between the types of
Figure 4. Betweenness centrality vs. number of neighbor nodes for the largest component graph obtained with PyPath and pyBRAvo, respectively,
when querying signaling knowledge in Omnipath and PC. The names of the 10 species having the highest betweenness centrality score are shown, and blue names and blue stars correspond to species top-ranked in both graphs.
motifs is the absence of 4-size motifs containing three to six cycles in pyBRAvo. These motif analysis results point to the strong inter-connectivity within the PyPath graph. All in all, these results illustrate how signaling knowledge is currently represented by the different knowledge sources.
The Cytoscape session containing the 10-level SN extracted using pyBRAvo is available online (https:// github.com/pyBRAvo/pyBRAvo/blob/master/cytoscape-vis /signaling_10levels_withoutUNK.cys). In Supplementary Figure S11, we visualize two small subgraphs of the pre-decessors of matrix metallopeptidase 2 (MMP2) protein as generated by pyBRAvo using the influence graph and
hyper-graph/reaction options (see Supplementary Methods A.4).
This hypergraph/reaction option is specific to pyBRAvo and is not available in PyPath.
GRNs for drug screening applications
In this section, we use the 39 genes selected on the basis of the metabolic model (see the ‘Experimental datasets’ section) and show how pyBRAvo enables increasing the number of candidate drugs based on a list of target genes through inclusion of genes with a putative non-direct effect on metabolism.
Retrieving potential drugs
Based on a list of 40 input genes identified with their gene symbol, we leverage the DrugBank (27) dataset publicly available as linked data through the Bio2RDF (28) SPARQL endpoint (https://bio2rdf.org/sparql). For each of the can-didate gene targets, the principle consists of generating a graph pattern that links drugs to gene names through the DrugBank target and gene-name edges. These patterns are implemented in a SPARQL query that is executed online through the Bio2RDF endpoint. In this query, we filter only
Table 5. In the context of in silico drug screening, pyBRAvo allows augmenting the list of candidate drugs based on reconstructed gene regulation networks
Initial target genes Candidate drugs New target genes New can-didate drugs 39 1 38 46
drugs with an “approved” status. These 39 gene targets lead to one approved drug.
Augmenting drug targets
pyBRAvo is then launched to assemble a GRN with all query expansion features (suffixes, synonyms, complex decomposition) with a single recursion depth and exclud-ing the PC miRTarBase and MSigDB data sources. From the resulting regulation graph, we retrieve all associated activa-tors or inhibiactiva-tors, which leads to 38 additional candidate target genes.
Retrieving potential new drugs
We next launch the DrugBank exploration process again, as described in the previous paragraph, focusing on this new gene list. As the result, we obtain a list of 46 candidate drugs targeting the regulators of the initial gene list.Table 5
summarizes the proposed drug-screening process.
We also ran this experiment on the complete list of 2881 genes involved in the direct regulation of metabolic reac-tions described in the iLivercancer1715 model. This led to 525 approved drugs, a result that is clearly humanly impossible to assess and possibly irrelevant. This result mainly arose from not focusing on the targeted metabolic objective of the network (biomass production). On the other hand, if we restricted the study to the filtered list of
39 genes, we obtained only one drug, which would clearly be unusable in the context of a drug-screening application. In this experiment, we showed that running pyBRAvo provides a list of candidate drugs with an indirect effect on the biomass production. Although an evaluation of the biological or clinical relevance of the retrieved poten-tial drugs was beyond the scope of this work, we pro-vide the indication of each of the candidate drugs in the Jupyter notebook available online (https://github.com /pyBRAvo/pyBRAvo/blob/master/drugbank-usecase/Noteb ook/drugbank-metabolism.ipynb). We believe that GRNs and associated metrics such as centrality could provide interesting perspectives when prioritizing drugs in in silico screening applications. This experiment can be reproduced based on the online Jupyter notebook.
System implementation
pyBRAvo was designed as a Python module to be used through an application programming interface in any Python script or directly in Command Line Inter-faces. The proposed use cases were aimed at facilitating integration and fine-tuning of pyBRAvo in bioinfor-matics tools and workflows. pyBRAvo is also pro-vided with several Jupyter notebooks to reproduce the experiments presented here as well as for training pur-poses. pyBRAvo source code and notebooks are available athttps://github.com/pyBRAvo/pyBRAvo.
Discussion and conclusion
The pyBRAvo framework allows the automatic reconstruc-tion of GRNs and SNs. The reconstrucreconstruc-tion is based on Semantic Web querying techniques of semantically inte-grated data sources. A primary novelty relies on the global nature of the obtained networks, and it is based on the iter-ative reconstruction process that queries knowledge bases combining interactions across all documented pathways.
In pyBRAvo, we choose to use entity names (gene name, protein names, and so forth) to query the data sources for upstream interactions. Another possibility would be to use gene or protein IDs. Our choice was motivated by the multi-scale nature of the regulation and signaling processes. For instance, the transcription of a gene to mRNA and the translation of mRNA to a protein are implicit interactions that are usually not represented in the data sources. It is thus relevant to link a gene with its mRNA and the asso-ciated protein to obtain a complete reconstruction when querying the data sources. Furthermore, the reconstruc-tion benefits from several improvements, namely, complex decomposition, label expansions, synonym expansions and network unification, that allow a deeper exploration of the knowledge base. It proves that the use of entity names
together with these improvements enables going far beyond the simple use of gene or protein identifiers as shown in
Figure 3.
In principle, pyBRAvo shares some characteristics with pyPath, a method that relies on the OmniPath database to reconstruct SNs on a large scale. In a comparison at a coarse-grained scale, the two sets of results appear com-parable with respect to the size and the number of edges. Nevertheless, a deeper inspection of the results shows that several artifacts appear in the pyPath reconstruction, such as the large number of cycles, cliques and 4- and 3-size motifs, possibly resulting from protein complexes man-agement in Omnipath (seeTable 4). It is highly necessary to reduce such artifact edges when the obtained networks are used as input to build predictive models in both logi-cal and probabilistic frameworks. We observe that PyPath extracted graphs tend to increase the graph connectiv-ity. This signaling flow, carefully detailed in the BioPAX content, is kept when using pyBRAvo to extract the graph. In addition, these predictive models have to be con-sidered very carefully. Indeed, most of the knowledge aggregated in the databases results from independent exper-iments. It is crucial to introduce a validation step by testing the model with experimental data, for instance, before using it in predictive approaches. Nevertheless, we strongly believe that adding such an automatic reconstruction step prior to the prediction step will permit more rapid design of large-scale predictive models while limiting errors due to manual data curation tasks.
By leveraging Semantic Web technologies and the BioPAX ontology, pyBRAvo is able to mine any biologi-cal network knowledge expressed with commonly accepted pathway terms, concepts and relations. It could addition-ally be enriched using other external RDF datasets, such as DrugBank or DisGenet (29), with an adapted querying process. This can largely enrich the construction of systems biology models based on disease descriptions for instance. In addition, Semantic Web technologies enable performing complex queries on multiple data sources without the need to locally host possibly massive datasets.
Assembling the vast amount of knowledge that is now publicly available is challenging. pyBRAvo has been designed with a particular focus on data and knowledge reuse. Through this work, we wish to encourage the Sys-tems Biology community to combine their efforts toward developing machine actionable and causality-oriented biological resources, leveraging community standards, and ensuring rich and shared semantics.
Supplementary data
Supplementary dataare available at Database Online.
Acknowledgement
The authors would like to thank Nathalie Théret and Vincent Legag-neux for providing experimental data and their biological expertise for the ‘Results’ section.
Funding
This work has been partly funded by the Region Pays de la Loire through the SyMeTRIC Connect Talent project. It also ben-efited from the support of the French government via the National Research Agency in the context of the investment expenditure pro-gram IDEALG ANR-10-BTBR-02-04-11.
Conflicts of interest. None declared.
References
1. Kitano,H. (2002) Computational systems biology. Nature,
420, 206–210.
2. Fujita,K.A., Ostaszewski,M., Matsuoka,Y. et al. (2014) Inte-grating pathways of Parkinson’s disease in a molecular inter-action map. Mol. Neurobiol., 49, 88–102.
3. Rodriguez-Jorge,O., Kempis-Calanis,L.A., Abou-Jaoude,W.
et al. (2019) Cooperation between T cell receptor and Toll-like
receptor 5 signaling for CD4+ T cell activation. Sci. Signaling,
12, eaar3641.
4. Croft,D., Mundo,A.F., Haw,R. et al. (2014) The Reac-tome pathway knowledgebase. Nucleic Acids Res., 42, D472–D477.
5. Kanehisa,M., Goto,S., Hattori,M. et al. (2006) From genomics to chemical genomics: new developments in KEGG.
Nucleic Acids Res., 34, D354–D357.
6. Cerami,E.G., Gross,B.E., Demir,E. et al. (2011) Pathway-Commons, a web resource for biological pathway data.
Nucleic Acids Res., 39, D685–D690.
7. Slenter,D.N., Kutmon,M., Hanspers,K. et al. (2018) WikiPathways: a multifaceted pathway database bridging metabolomics to other omics research. Nucleic Acids Res.,
46, D661–D667.
8. Schaefer,C.F., Anthony,K., Krupa,S. et al. (2009) PID: the pathway interaction database. Nucleic Acids Res., 37, D674–D679.
9. Kamburov,A., Stelzl,U., Lehrach,H. et al. (2013) The Consen-susPathDB interaction database: 2013 update. Nucleic Acids
Res., 41, 793–800.
10. Turei,D., Korcsmaros,T. and Saez-Rodriguez,J. (2016) Omni-Path: guidelines and gateway for literature-curated signaling pathway resources. Nat. Methods, 13, 966–967.
11. Yu,N., Seo,J., Rho,K. et al. (2012) hiPathDB: a human-integrated pathway database with facile visualization. Nucleic
Acids Res., 40, D797–D802.
12. Babur,O., Dogrusoz,U. and Demir,E. et al. (2010) ChiBE: interactive visualization and manipulation of BioPAX path-way models. Bioinformatics, 26, 429–431.
13. Shannon,P. et al. (2003) Cytoscape: a software environment for integrated models of biomolecular interaction networks.
Genome Res., 13, 2498–2504.
14. Wu,G. and Stein,L. (2012) A network module-based method for identifying cancer prognostic signatures. Genome Biol.,
13, R112.
15. Bizer,C., Heath,T., Idehen,K., et al. (2008) Linked data on the web (ldow2008). In: Proceedings of the 17th International
Conference on World Wide Web. WWW ’08, ACM, New
York, NY, USA, pp. 1265–1266.
16. Hayes,P. (2004) RDF Semantics, http://www.w3.org/TR/20 04/REC-rdf-mt-20040210/.
17. Demir,E., Cary,M.P., Paley,S. et al. (2010) The BioPAX com-munity standard for pathway data sharing. Nat. Biotechnol.,
28, 935.
18. International Cancer Genome Consortium et al. (2010) Inter-national network of cancer genome projects. Nature, 464, 993–998.
19. Folschette,M., Legagneux,V., Poret,A. et al. (2020) A pipeline to create predictive functional networks: application to the tumor progression of hepatocellular carcinoma. BMC
Bioin-formatics, 21, 18.
20. Mhamdi,H., Bourdon,J., Larhlimi,A. et al. (2020) Bayesian integrative modeling of genome-scale metabolic and regu-latory networks. Informatics, 7, 1. https://www.mdpi.com/ 2227-9709/7/1/1.
21. Gatto,F., Nookaew,I. and Nielsen,J. (2014) Chromosome 3p loss of heterozygosity is associated with a unique metabolic network in clear cell renal carcinoma. Proc. Natl. Acad. Sci.,
111, E866–E875.
22. Miannay,B., Minvielle,S. and Magrangeas,F., et al. (2018) Constraints on signaling network logic reveal functional sub-graphs on Multiple Myeloma OMIC data. BMC Syst. Biol.,
12, 32.
23. Thiele,S., Cerone,L., Saez-Rodriguez,J. et al. (2015) Extended notions of sign consistency to relate experimental data to signaling and regulatory network topologies. BMC
Bioinfor-matics, 16, 345.
24. Gebser,M., Kaufmann,B., Neumann,A. et al. (2007) clasp: A conflict-driven answer set solver, Springer Berlin Heidelberg, In Logic Programming and Nonmonotonic Reasoning. Berlin, Heidelberg, pp. 260–265.
25. Palla,G., Derenyi,I., Farkas,I. et al. (2005) Uncovering the overlapping community structure of complex networks in nature and society. Nature, 435, 814–818.
26. Smoly,I.Y., Lerman,E., Ziv-Ukelson,M. et al. (2017) MotifNet: a web-server for network motif analysis.
Bioinformatics, 33, 1907–1909.
27. Wishart,D.S., Feunang,Y.D., Guo,A.C. et al. (2018) Drug-Bank 5.0: a major update to the DrugDrug-Bank database for 2018.
Nucleic Acids Res., 46, D1074–D1082.
28. Dumontier,M., Callahan,A., Cruz-Toledo,J. et al. (2014) Bio2rdf release 3: a larger connected network of linked data for the life sciences. In: Proceedings of the 2014
Interna-tional Conference on Posters & Demonstrations Track – Volume 1272. ISWC-PD’14, Aachen, DEU, pp. 401–404. CEUR-WS.org.
29. Piñero,J., Ramírez-Anguita,J.M., Saüch-Pitarch,J. et al. (2019) The DisGeNET knowledge platform for disease genomics: 2019 update. Nucleic Acids Res., 48, D845–D855.