Evaluation of genetic divergence among
clones of conilon coffee after scheduled
cycle pruning
J.M. Dalcomo1, H.D. Vieira2, A. Ferreira3, W.L. Lima1, R.G. Ferrão4,
A.F.A. Fonseca5, M.A.G. Ferrão5 and F.L. Partelli6
1Instituto Federal do Espírito Santo, Campus Alegre, ES, Brasil 2Centro de Ciências e Tecnologias Agropecuárias,
Universidade Estadual do Norte Fluminense Darcy Ribeiro, Campos dos Goytacazes, RJ, Brasil
3Departamento de Produção Vegetal, Centro de Ciências Agrárias, Universidade Federal do Espírito Santo, Alegre, ES, Brasil
4Instituto Capixaba de Pesquisa, Assistência Técnica e Extensão Rural, Vitória, ES, Brasil
5Empresa Brasileira de Pesquisa Agropecuária / Instituto Capixaba de Pesquisa, Assistência Técnica e Extensão Rural, Vitória, ES, Brasil
6Departamento de Ciências Agrárias e Biológicas,
Centro Universitário Norte do Espírito Santo, Universidade Federal do Espírito Santo, São Mateus, ES, Brasil
Corresponding author: A. Ferreira E-mail: [email protected]
Genet. Mol. Res. 14 (4): 15417-15426 (2015) Received March 20, 2015
Accepted July 10, 2015 Published November 30, 2015
DOI http://dx.doi.org/10.4238/2015.November.30.19
ABSTRACT. Coffea canephora genotypes from the breeding program
of Instituto Capixaba de Pesquisa e Extensão Rural were evaluated, and genetic diversity was estimated with the aim of future improvement strategies. From an initial group of 55 genotypes, 18 from the region of Castelo, ES, were selected, and three clones of the cultivars “Vitória” and “robusta tropical.” Upon completion of the scheduled cycle pruning,
17 morphoagronomic traits were measured in the 22 genotypes selected. The principal components method was used to evaluate the contributions relative to the traits. The genetic dissimilarity matrix was obtained through Mahalanobis generalized distance, and genotypes were grouped using the hierarchical method based on the mean of the distances. The most promising clones of Avaliação Castelo were AC02, AC03, AC12, AC13, AC22, AC24, AC26, AC27, AC28, AC29, AC30, AC35, AC36, AC37, AC39, AC40, AC43, and AC46. These methods detected high genetic variability, grouping, by similarity, the genotypes in five groups. The trait that contributed the least to genetic divergence was the number of leaves in plagiotropic branches; however, this was not eliminated, because discarding it altered the groups. There are superior genotypes with potential for use in the next stages of the breeding program, aimed at both the composition of clonal variety and hybridizations.
Key words: Genetic improvement; Coffea canephora; Multivariate statistics
INTRODUCTION
The coffee agribusiness is important, both socially and economically, since coffee is cultivated in more than 60 countries, most of which are less developed or developing, and because its derivatives are primarily consumed in rich and developed countries (Cecon et al., 2008). In Brazil, coffee production is considered the first noncolonial mercantile activity and is a key component of the national economy, yielding 5.721 billion dollars for the trade balance in 2012 (MDIC/SECEX, 2013).
The state of Espírito Santo is the second largest Brazilian producer of coffee and the largest national producer of “conilon” coffee, with 311,200 cultivated hectares (CONAB, 2014). In this state, the coffee business is the most important agricultural activity, because it creates jobs, wealth, and helps to maintain populations in rural areas (Rodrigues et al., 2012). The production of Conilon coffee in the 2013 harvest was 8211 thousand sacks (CONAB, 2014).
Much of the success of the Brazilian coffee culture is due to genetic improvement (Ivoglo, 2008; Melo and Sousa, 2011), and this, in the case of perennial species such as coffee, is dependent on knowledge of the available germplasm, the biological variation among species in the genus and among populations within species, and of the variation among individuals (Costa et al., 2005), which makes the study of genetic divergence a necessity.
In the search for superior cultivars, the use of genetic variability in crosses of genetically divergent groups is an important strategy for achieving gains resulting from selection. The importance of genetic diversity for improvement lies in the fact that it provides parameters for the identification of superior genotypes, since the choice of genitors to form segregating populations is one of the main decisions that the breeder needs to make (Bertan et al., 2006).
According to Fonseca et al. (2006) and Moreira et al. (2009), multivariate techniques can be used for this purpose, thus enabling multiple combinations of information to occur within the experimental unit. Thus, several multivariate techniques can be used to predict genetic diversity, among which the dissimilarity measures involve Mahalanobis generalized distance, hierarchical grouping methods, such as UPGMA, and graphic dispersion techniques involving principal component analysis (Cecon et al., 2008). The choice of method to be used is based on the accuracy desired by the researcher, as well as on the ease of analysis and data collection (Fonseca et al.,
2006; Bezerra Neto et al., 2010).
Genetic variability among the genotypes of Coffea canephora has been reported (Ferreira et al., 2005; Fonseca et al., 2006; Cecon et al., 2008; Ferrão et al., 2008; Ivoglo et al., 2008; Rodrigues et al., 2012). However, the majority of biometric information used to estimate the genetic divergence of coffee plants has been measured in plants conducted outside the regime of pruning and disbranching.
Pruning and disbranching are already widespread practices among conilon coffee growers, and are used routinely to rejuvenate and maintain land productivity and to improve profitability for the producer (Pereira et al., 2007). The option of scheduled cycle pruning (PPC) completely renews the aerial part of the crop every four or five years.
Considering this background and the lack of studies on genetic diversity based on solid multivariate analysis involving traits measured after the management of scheduled cycle pruning, the objective of this study was to evaluate promising genotypes of C. canephora and to estimate their genetic diversity, aiming to compose varieties through future hybridizations, and recovery of superior genotypes from segregating populations.
MATERIAL AND METHODS
This coffee test was conducted in the experimental farm “Bananal do Norte”, belonging to Instituto Capixaba de Pesquisa e Extensão Rural (Incaper), in the district of Pacotuba, municipality of Cachoeiro de Itapemirim, south of the State of Espírito Santo, Brazil. The experimental crops were planted in June 2005, following a randomized blocks design, four replications, with 55 treatments (genotypes of C. canephora var. Conilon). The genotypes belong to the Incaper breeding program, and 51 were clones derived from the phenotypic selection of matrix plants from agricultural properties in the area of Castelo, State of Espírito Santo (Avaliação Castelo, AC), three were clones belonging to the cultivar Incaper 8142 (conilon Vitória), and one genotype was the open-pollinated cultivar Emcaper 8151 (Robusta Tropical).
The plots were composed of a row of five plants, spaced 3.0 x 1.2 m, and the second and fourth plants were considered useful. Cultural practices were performed as recommended by Incaper for commercial crops, with the addition of supplemental irrigation.
After completion of the fourth harvest (September 2010), the experiment was subjected to PPC, maintaining two of the five orthotropic stems of the plants, and, of these, the plagiotropic branches that had produced grains in more than 50% of its rosettes were eliminated.
Based on the criteria of vigor and tolerance to rust fungus, observed in the first 5-year evaluation period (2006-2010), and on productivity, yield stability, uniformity of maturation, and grain size, regarding the first four crops (2007-2010), the 18 most promising clones were selected from the group AC, which were assessed during the agricultural year 2010/2011, together with the three clones belonging to the cultivar conilon Vitória (12V, early; 02V, medium; and 13V, late) and the genotype of the cultivar robusta tropical (RT), totaling 22 genotypes studied.
The morphoagronomic traits evaluated were: 1) number of orthotropic branches produced per plant (NRO), obtained by the monthly and cumulative count of new branches produced (length ≥ 10 cm), maintaining five new branches in each plant, to generate a new canopy, and removing the others; 2) dry matter of eliminated orthotropic branches (MSO), obtained by monthly and cumulative weighing after drying in an oven at 65oC for 72 h; 3) length of the new orthotropic
the old and their apical meristems (cm); 4) Diameter of the new orthotropic branches (DRO) with standardized measurement in the central region of the second internode of each of the five branches (mm); 5) number of nodes of the orthotropic branches (NNO), determined by counting each of the five new branches; 6) average length of the orthotropic internodes (CEO), obtained by the ratio between the length of the new orthotropic branches (CRO) and their respective number of nodes (NNO) (cm); 7) number of plagiotropic branches produced (NRP), obtained by counting in each of the five new orthotropic branches; 8) average length of the plagiotropic branches (CRP), measured in two selected branches per plant, one on each side of the planting row, and obtained through the distance between the insertion of these branches in the orthotropic branch and its apical meristem (cm); 9) number of plagiotropic nodes (NNP), obtained by direct counting in the selected branches; 10) number of leaves produced in the plagiotropic branches (NFP), obtained by monthly and cumulative count in the branches mentioned in item eight; 11) length of the plagiotropic internodes (CEP), obtained by the ratio between the length of the branches (CRP) and the number of nodes (NNP) of the selected plagiotropic branches (cm); 12) largest diameter of the base of the canopy (DBC), measured in the transverse direction in relation to the planting rows, having as limits the projection of the branches of greatest length (cm); 13) Percentage of mature rosettes on the plagiotropic branches (RM), obtained by the ratio between the number of rosettes that produced flowers and the number of plagiotropic nodes (NNP), counted directly in the selected branches; 14) number of flowers produced by rosettes (FL/RM), obtained by the direct and cumulative count, at every flowering, in the selected branches; 15) number of remaining fruits per rosette (NF/RM), obtained by counting 30 days after the last flowering, in the selected branches; 16) percentage of developed flowers (VING), obtained by the ratio between the number of flowers produced by rosettes (FL/RM) and the number of remaining fruits per rosette (NF/RM); and 17) number of remaining fruits per branch (FR/RA), obtained by multiplying the number of remaining fruits per rosette (NF/RM) and the number of rosettes that produced flowers per branch.
Growth traits were evaluated monthly until September 2011. For the purpose of analyses, the cumulative values were used for the traits NRO, MSO, CRO, DRO, NNO, NRP, CRP, NNP, NFP, and DBC and, the average values were used for the traits CEO and CEP. Productive traits RM and FL/RM were evaluated after each major flowering (August 24, September 07, September 17, October 05, and October 29, 2011), and the cumulative values were used in the analyses. The traits NF/RM, VING, and FR/RA were evaluated 30 days after the last flowering (November 29, 2011).
Individual variance analysis was performed in GENES (Cruz, 2013) for the 17 traits under evaluation, and, later, the Scott-Knott test (1%) was employed to cluster the means to confirm variation among the genotypes. In the next stage, the Mahalanobis generalized distance was determined in order to obtain the genetic dissimilarity matrix and, depending on the distance between the individuals, grouping was performed according to the unweighted pair group method with arithmetic mean (UPGMA). The relative importance of each trait was verified to discriminate genetic diversity through the principal component method, based on which variables were retained.
RESULTS AND DISCUSSION
Based on vigor and tolerance to rust fungus observed in the first 5-year evaluation period (2006-2010), and on productivity, yield stability, uniformity of maturation, and grain size, regarding the first four crops (2007-2010) (INCAPER, unpublished data), among those clones belonging to the AC group, the following were selected: AC02, AC03, AC12, AC13, AC22, AC24, AC26, AC27, AC28, AC29, AC30, AC35, AC36, AC37, AC39, AC40, AC43, and AC46, which were considered
the most promising for use in research on the genetic improvement of conilon coffee.
The individual analysis of variance for 22 genotypes (18 from the AC group, three from the cultivar Vitória, and one from the cultivar Robusta Tropical) showed significant differences at 1% probability as determined by the F test, in 16 of the 17 traits measured, except for the percentage of mature rosettes, RM (Table 1), demonstrating that there is genetic variability among the genotypes studied. These results are appropriate, and since they are associated with highly productive genotypes (INCAPER, unpublished data), they provide favorable indications of success in the selection of superior clones, with the possibility of use in breeding programs (Rodrigues et al., 2012).
(1)NRO: number of orthotropic branches produced per plant; MSO: dry matter of eliminated orthotropic branches (g); CRO: length of new orthotropic branches (cm); CRP: length of plagiotropic branches (cm); DBC: largest diameter of base of canopy (cm); DRO: diameter of new orthotropic branches (mm); NNO: number of nodes of orthotropic branches; NRP: number of plagiotropic branches produced; NNP: number of plagiotropic nodes; NFP: number of leaves produced on plagiotropic branches; CEO: length of orthotropic internodes (cm); CEP: length of plagiotropic internodes (cm); RM: percentage of mature rosettes per plagiotropic branch (%); FL/RM: number of flowers produced by mature rosettes; FR/RM: number of fruits “developed” per mature rosette; VING: development of fruits (%); FR/RA: number of remaining fruits per branch. **Significant at 1% probability by F test. nsNot significant by F test.
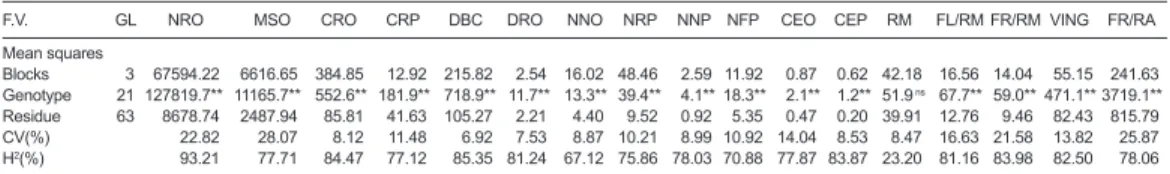
F.V. GL NRO MSO CRO CRP DBC DRO NNO NRP NNP NFP CEO CEP RM FL/RM FR/RM VING FR/RA Mean squares Blocks 3 67594.22 6616.65 384.85 12.92 215.82 2.54 16.02 48.46 2.59 11.92 0.87 0.62 42.18 16.56 14.04 55.15 241.63 Genotype 21 127819.7** 11165.7** 552.6** 181.9** 718.9** 11.7** 13.3** 39.4** 4.1** 18.3** 2.1** 1.2** 51.9 ns 67.7** 59.0** 471.1** 3719.1** Residue 63 8678.74 2487.94 85.81 41.63 105.27 2.21 4.40 9.52 0.92 5.35 0.47 0.20 39.91 12.76 9.46 82.43 815.79 CV(%) 22.82 28.07 8.12 11.48 6.92 7.53 8.87 10.21 8.99 10.92 14.04 8.53 8.47 16.63 21.58 13.82 25.87 H2(%) 93.21 77.71 84.47 77.12 85.35 81.24 67.12 75.86 78.03 70.88 77.87 83.87 23.20 81.16 83.98 82.50 78.06
Table 1. Analysis of variance, coefficients of variation (CV), genotypic determination coefficient (H2), and means of 17 morphoagronomic traits(1) evaluated in 22 genotypes of Coffea canephora belonging to the conilon coffee genetic improvement program of Instituto Capixaba de Pesquisa e Extensão Rural - Incaper, cultivated at Estação Experimental de Bananal do Norte - EEBN, municipality of Cachoeiro de Itapemirim, State of Espírito Santo, Brazil.
The experimental coefficients of variation (CVe) were within the range 6.92-28.07% (Table
1), which is considered acceptable for experiments in perennial cultures such as coffee (Ferrão et al., 2008). According to those authors, higher values of CVe can be observed in experiments
involving genetically different materials, because of their different responses to stresses such as high temperatures and drought, incidence of pests, diseases, winds, and pruning.
The traits that were less influenced by the environment were CRO, DBC, DRO, NNO, NNP, CEP, and RM, presenting CVe of <10%. The traits that were more influenced by the environment
were NRO, MSO, FR/RM, and NF/RA, which were between 20 and 30%.
The genotypic determination coefficients (H2) estimated from the means of the treatments,
are steady from 67.12 to 93.21%, except for the trait RM, which presented H2 of 23.21% (Table
1). The high values estimated for the vast majority of traits indicate that the genetic variability is predominant in relation to the environmental (Ferrão et al., 2008), that there was adequate control of experimental error (Ivoglo et al., 2008), and that there are favorable conditions for selection and improvement of the evaluated traits.
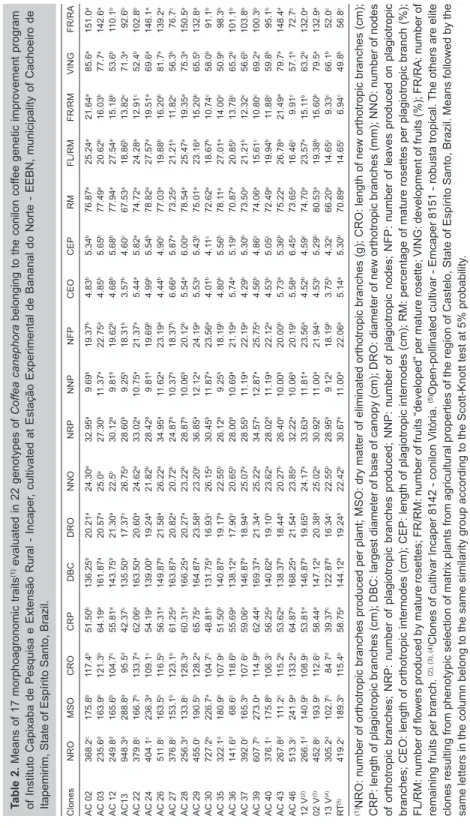
When means were clustered based on the Scott-Knott test at 1% probability (Table 2), five dissimilar groups of genotypes were observed for NRO and CRO, three groups for MSO, CRP, DRO, CEP, FL/RM, FR/RM, and FR/RA, two groups for DBC, NNO, NNP, NRP, NFP, CEO, and VING, and, for the trait RM, all the genotypes were similar.
Clones NRO MSO CRO CRP DBC DRO NNO NRP NNP NFP CEO CEP RM FL/RM FR/RM VING FR/RA AC 02 368.2 c 175.8 b 117.4 b 51.50 b 136.25 b 20.21 a 24.30 a 32.95 a 9.69 b 19.37 b 4.83 b 5.34 b 76.87 a 25.24 a 21.64 a 85.6 a 151.0 a AC 03 235.6 d 163.9 b 121.3 b 64.19 a 161.87 a 20.57 a 25.0 a 27.30 b 11.37 a 22.75 a 4.85 b 5.65 b 77.49 a 20.62 b 16.03 b 77.7 a 142.6 a AC 12 249.8 d 165.6 b 104.7 c 55.81 a 143.75 b 21.30 a 22.5 b 30.12 b 9.81 b 19.62 b 4.68 b 5.68 b 77.94 a 27.54 a 15.18 b 53.6 b 110.1 b AC13 948.3 a 288.8 a 95.5 d 42.37 c 135.50 b 17.37 c 26.75 a 28.60 b 9.25 b 18.31 b 3.57 b 4.60 c 67.53 a 18.86 b 13.82 c 71.3 a 92.6 b AC 22 379.8 c 166.7 b 133.7 a 62.06 a 163.50 a 20.60 a 24.62 a 33.02 a 10.75 a 21.37 a 5.44 a 5.82 a 74.72 a 24.28 a 12.91 c 52.4 b 102.8 b AC 24 404.1 c 236.3 a 109.1 c 54.19 a 139.00 b 19.24 b 21.82 b 28.42 b 9.81 b 19.69 b 4.99 b 5.54 b 78.82 a 27.57 a 19.51 a 69.6 a 146.1 a AC 26 51 1.8 c 163.5 b 116.5 b 56.31 a 149.87 b 21.58 a 26.22 a 34.95 a 11.62 a 23.19 a 4.44 b 4.90 c 77.03 a 19.88 b 16.20 b 81.7 a 139.2 a AC 27 376.8 c 153.1 b 123.1 b 61.25 a 163.87 a 20.82 a 20.72 b 24.87 b 10.37 b 18.37 b 6.66 a 5.87 a 73.25 a 21.21 b 11.82 c 56.3 b 76.7 c AC 28 256.3 d 133.8 c 128.3 a 60.31 a 166.25 a 20.27 a 23.22 b 28.87 b 10.06 b 20.12 b 5.54 a 6.00 a 78.54 a 25.47 a 19.35 a 75.3 a 150.5 a AC 29 455.0 c 190.5 b 128.2 a 65.75 a 164.87 a 23.58 a 23.20 b 36.85 a 12.12 a 24.19 a 5.53 a 5.43 b 75.01 a 23.16 a 15.20 b 65.5 b 132.8 a AC 30 727.2 b 226.7 a 104.7 c 48.81 b 131.75 b 16.93 c 26.15 a 30.45 b 11.87 a 23.56 a 4.01 b 4.1 1 c 72.62 a 18.67 b 10.74 c 58.0 b 91.1 b AC 35 322.1 d 180.9 b 107.9 c 51.50 b 140.87 b 19.17 b 22.55 b 26.12 b 9.25 b 18.19 b 4.80 b 5.56 b 78.1 1 a 27.01 a 14.00 c 50.9 b 98.3 b AC 36 141.6 d 68.6 c 118.6 b 55.69 a 138.12 b 17.90 c 20.65 b 28.00 b 10.69 a 21.19 a 5.74 a 5.19 b 70.87 a 20.85 b 13.78 c 65.2 b 101.1 b AC 37 392.0 c 165.3 b 107.6 c 59.06 a 146.87 b 18.94 b 25.07 a 28.55 b 11.19 a 22.19 a 4.29 b 5.30 b 73.50 a 21.21 b 12.32 c 56.6 b 103.8 b AC 39 607.7 b 273.0 a 114.9 b 62.44 a 169.37 a 21.34 a 25.22 a 34.57 a 12.87 a 25.75 a 4.56 b 4.86 c 74.06 a 15.61 c 10.80 c 69.2 a 100.3 b AC 40 376.1 c 175.8 b 106.3 c 56.25 a 140.62 b 19.10 b 23.62 a 28.02 b 11.19 a 22.12 a 4.53 b 5.05 c 72.49 a 19.94 b 11.88 c 59.8 b 95.1 b AC 43 267.8 d 111 .2 c 115.2 b 53.62 a 138.37 b 18.44 b 20.27 b 26.40 b 10.00 b 20.00 b 5.73 a 5.36 b 75.22 a 26.78 a 21.49 a 79.7 a 148.4 a AC 46 513.3 c 241.9 a 133.2 a 64.87 a 168.25 a 21.54 a 23.85 a 32.22 a 10.06 b 20.19 b 5.58 a 6.45 a 73.65 a 16.46 c 9.91 c 57.1 b 72.7 c 12 V (2) 266.1 d 140.9 b 108.9 c 53.81 a 146.87 b 19.65 b 24.17 a 33.63 a 11.81 a 23.56 a 4.52 b 4.59 c 74.70 a 23.57 a 15.1 1 b 63.2 b 132.0 a 02 V (3) 452.8 c 193.9 b 112.6 c 58.44 a 147.12 b 20.38 a 25.02 a 30.92 b 11.00 a 21.94 a 4.53 b 5.29 b 80.53 a 19.38 b 15.60 b 79.5 a 132.9 a 13 V (4) 305.2 d 102.7 c 84.7 d 39.37 c 122.87 b 16.34 c 22.55 b 28.95 b 9.12 b 18.19 b 3.75 b 4.32 c 66.20 a 14.65 c 9.33 c 66.1 b 52.0 c RT (5) 419.2 c 189.3 b 115.4 b 58.75 a 144.12 b 19.24 b 22.42 b 30.67 b 11.00 a 22.06 a 5.14 a 5.30 b 70.89 a 14.65 c 6.94 c 49.8 b 56.8 c (1)NRO: number of
orthotropic branches produced per plant; MSO:
dry matter of eliminated orthotropic branches (g); CRO: length of
new orthotropic branches (cm);
CRP: length of plag iotropic branches (cm); DBC: largest diameter of base of canopy (cm); DRO: diameter of new orthotropic branches (mm); NNO: number of nodes of orthotropic branches; NRP: number of plagiotropic branches produced; NNP: number of plagiotropic nodes; NFP: number of leaves produced on plagiotropic branches;
CEO: length of orthotropic
internodes (cm); CEP: length of plagiotr opic internodes (cm); RM: percentage
of mature rosettes per plagiotropic
branch (%); FL/RM: number of flowers produced by mature rosettes; FR/RM: number of fruits “developed” per mature rosette; VING: development of fruits (%); FR/RA: number of remaining
fruits per branch.
(2),
(3), (4)
Clones of cultivar Incaper 8142 - conilon
Vitória.
(5)Open-pollinated
cultivar - Emcaper 8151 - robusta tropical.
The others are elite
clones resulting
from phenotypic
selection
of matrix plants from agricultural
properties of the region
of Castelo, State of Espírito Santo, Brazil. Means followe
d by the
same letters in the column belong to the same similarity group according to the Scott-Knott test at 5% probability
. Table 2. Means of 17 morphoagronomic traits (1) evaluated in 22 genotypes of Coffea canephora belonging to
the conilon cof
fee
genetic improvement program
of Instituto Capixab
a de Pesquisa
e Extensão Rural - Incaper
, cultivated at Estação Experimental
de Bananal
do Norte - EEBN, municipality
of Cachoe
iro de
Concerning the features NRO and MSO, the genotype AC13 was highlighted, which produced 948.38 new branches during the evaluation period, “wasting” 288.82 grams of dry matter with the elimination. At the other extreme there was AC36, which produced 141.62 branches, “losing” 68.67 grams of dry matter. The production of orthotropic branches is a desirable trait because of the need for multiplication by the rooting of cuttings and renewal of the canopy; however, it is undesirable from the perspective of labor required for its removal and waste of energy to produce dry matter to be removed.
Regarding the traits that define the size of the plants (CRO, DRO, CEO, and NNO), AC22, AC46, AC28, and AC29 were highlighted as tall plants, and AC13 and 13V were of lower stature. In relation to traits that define the architecture of plants (CRP, DBC, NRP, NNP, CEO, and NFP), the clones AC03 and AC12 present intermediate CRO and one of the greatest DBC. Usually, the plants of lower stature and compact architecture are selected, which are appropriate to increase density and generate tolerance to diseases, to the main pests, and to drought (Ferreira et al., 2005).
In Table 2, the most prominent genotype for FL/RM was AC24, which produced 27.57 flowers per rosette; however, 30 days after flowers were produced, AC02 was the most notable with 21.64 fruits remaining per rosette, for reaching the highest development rate (85.60%), and resulting in the highest number of remaining fruits per branch (151.0). On the other hand, the negative aspect was represented by the genotypes RT and 13V: the first, in addition to producing few flowers per rosette (14.66), also showed the worst rate of development (49.82%), and the lowest number of fruits per rosette (6.94); the second produced the lowest number of flowers per rosette (14.65) and remaining fruits per branch (52.0).
Additionally, the Scott-Knott test (1%) established two groups of genotypes for the trait NNP and only one group for RM (Table 2), suggesting that branches with a lower NNP can differentiate a greater percentage of rosettes (RM). Architectural traits of the plant are highly hereditary and some present strong genetic correlation with yield. In particular, the proportion of fructification of the plagiotropic nodes counted at 15 cm from the uppermost region of the plant was found to be a good indicator of yield over two fructification cycles (Cilas et al., 2006).
Ivoglo et al. (2008) recommended that some variables should be disposed in studies on genetic divergence in robusta coffee because the original grouping of progenies is not altered and they have high genetic correlation with other evaluated traits. Principal components analysis estimated that the relative importance of each trait for genetic diversity was, in increasing order: NFP, RM, VING, FR/RM, CRO, NRO, DBC, FL/RM, DBC, NNO, NNO, NNP, NRP, MSO, FR/RA, CEO, and CRO. Although NFP is a minor contributor to genetic diversity, its elimination or the elimination of any other trait was not possible, since, the number of groups was altered after discarding.
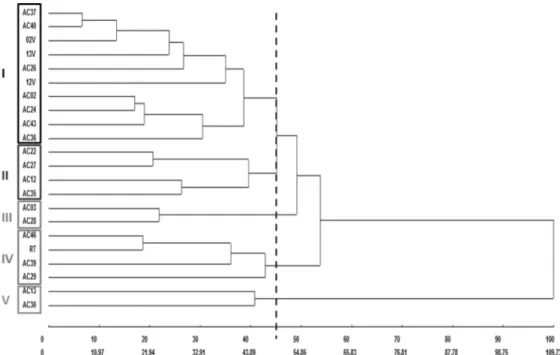
With the dendrogram obtained through the hierarchical method UPGMA (Figure 1) and considering the cut by the Mojena method (1977) at 45% of the maximum fusion level, it was verified that the, 22 genotypes were separated into five dissimilar groups: Group I: AC02, AC24, AC26, AC36, AC37, AC40, AC43, 02V, 12V, and 13V; Group II: AC12, AC22, AC27, and AC35; Group III: AC03 and AC28; Group IV: AC29, AC39, AC46, and RT; and Group V: AC13 and AC30.
In the genetic dissimilarity matrix obtained by Mahalanobis generalized distance, the most dissimilar genotypes were AC03 and AC13, with a distance of 168.37, and these were divided into different groups through the UPGMA method, a relevant result due to crosses between clones from different groups showing higher heterosis (Fonseca et al., 2006). The most similar genotypes were AC37 and AC40, with a distance of 7.32. The most dissimilar genotype was AC03, which presented the highest sum of distances among the pairs of distances of which this genotype was part, and
AC40 was the most similar, and presented the lowest sum of distances.
Figure 1. Analysis of hierarchical grouping of 22 genotypes of conilon coffee through the UPGMA method based on
the matrix obtained through the Mahalanobis generalized distance. 02V, 12V, and 13V = clones of cultivar Incaper 8142 - conilon Vitória; RT = open-pollinated cultivar - Emcaper 8151 - robusta tropical; the others (AC) are elite clones resulting from phenotypic selection of matrix plants from agricultural properties of the region of Castelo, State of Espírito Santo, Brazil. Considering the cut by the Mojena method at 45% of the maximum fusion level.
The genotypes 02V, 12V, and 13V, belonging to the cultivar Incaper 8142 (conilon Vitória), were part of the same group (I). The genotypes of AC that remained in the same group (AC02, AC24, AC26, AC36, AC37, AC40, AC43) are biometrically similar to the clones studied from the variety Vitória, and AC02, AC24, and AC43 obtained the best ratings of the group in relation to productive traits (RM, FL/RM, FR/RM, VING, and FR/RA). The genotypes of group II (AC12, AC22, AC27, and AC35) were characterized by a medium size, and medium budding and development of flowers; the genotypes of group III (AC03 and AC28), had a large size and a high level of budding and development of flowers; those of group IV (AC29, AC39, AC46, and RT), had large size and a low level of budding and flower development, and it was noteworthy that plants of AC (clonal plants) presented the same large size as the open-pollinated cultivar robusta tropical, which is multiplied with seeds. The genotypes of group V (AC13 and AC30) had a small size and the production of several orthotropic branches per plant was a prominent trait.
When an association is established between the productivities of the whole experiment in the first four crops (INCAPER, unpublished data) with the traits of groups previously described, clones AC02 and AC26 are highlighted in group I (fifth and sixth highest yield), clone AC27 in group II (the highest yield of the whole experiment), clone AC03 in group III (second most productive), clone AC29 in group IV (third most productive), and clone AC13 in group V (12th most productive).
The isolation of genotypes AC13 and AC30 in the last group demonstrate that they have a high genetic distance compared to the other genotypes and that they can be used in programs of directed crosses aimed at obtaining new or hybrid cultivars of robusta coffee, taking advantage of their small size when it is in the best interest of the breeder.
The choice of the breeder for a specific group of genotypes depends on the characteristics and objectives of the research; however, among those that possess the trait of interest, the most similar ones must be chosen when the objective is releasing a new variety, and the most dissimilar ones, when the objective is hybridization.
Based on yield stability, uniformity of maturation, grain size, vigor, tolerance to rust fungus, and productivity, the most promising genotypes within the AC group were AC02, AC03, AC12, AC13, AC22, AC24, AC26, AC27, AC28, AC29, AC30, AC35, AC36, AC37, AC39, AC40, AC43, and AC46. The existence of divergent genotypes was observed, and five dissimilar groups were formed. The trait that contributed the least to genetic divergence was the NFP; however, this was not eliminated, since discarding it altered the groups. The evaluated genotypes present the potential for continuity in genetic improvement programs interested in clonal variety and hybridization.
Conflicts of interest
The authors have no conflict of interest to declare.
ACKNOWLEDGMENTS
Research supported by Instituto Federal de Educação, Ciência e Tecnologia do Estado do Espírito Santo (Ifes), Universidade Estadual do Norte Fluminense Darcy Ribeiro (UENF), Universidade Federal do Espírito Santo (UFES), Instituto Capixaba de Pesquisa, Assistência Técnica e Extensão Rural (Incaper), and Coordenação de Aperfeiçoamento de Pessoal de Nível Superior (CAPES).
REFERENCES
Bertan I, Carvalho FIF de, Oliveira AC de, Vieira EA, et al. (2006). Comparação de métodos de agrupamento na representação da distância morfológica entre genótipos de trigo. Rev. Bras. Agrocienc. 12: 279-286.
Bezerra Neto FV, Leal NR, Gonçalves LSA, Rêgo Filho LM, et al (2010). Descritores quantitativos na estimativa da divergência genética entre genótipos de mamoneira utilizando análises multivariadas. Rev. Cienc. Agronom. 41: 294-299. Cecon PR, Silva FFE, Ferreira A, Ferrão RG, et al. (2008). Análise de medidas repetidas na avaliação de clones de café ‘Conilon’.
Pesq. Agropec. Bras. 43: 1171-1176.
Cilas C, Bar-Hen A, Montagnon C and Godin C (2006). Definition of architectural ideotypes for good yield capacity in Coffea
canephora. Ann. Bot. 97: 405-411.
Companhia Nacional de Abastecimento (CONAB) (2014). Acompanhamento da Safra Brasileira - Café, Safra 2013/2014, quarta estimativa, abril/2014. Available at [http://www.conab.gov.br]. Accessed April 17, 2013.
Costa RB da, Resende MDV de, Contini AZ, Rego FLH, et al. (2005). Avaliação genética de indivíduos de erva-mate (Ilex
paraguariensis St.Hil.) na região de Caarapó, MS, pelo procedimento REML/BLUP. Cienc. Florestal 15: 371-376.
Cruz CD (2013) GENES - a software package for analysis in experimental statistics and quantitative genetics. Acta Sci. 35: 271-276. Ferrão RG, Cruz CD, Ferreira A, Cecon PR, et al. (2008). Parâmetros genéticos em café Conilon. Pesq. Agropec. Bras. 43: 61-69. Ferreira A, Cecon PR, Cruz CD, Ferrão RG, et al. (2005). Seleção simultânea de Coffea canephora por meio da combinação
de análise de fatores e índices de seleção. Pesq. Agropec. Bras. 40: 1189-1195.
Fonseca AFA da, Sediyama T, Cruz CD, Sakaiyama NS, et al. (2006). Divergência genética em café conilon. Pesq. Agropec.
Bras. 41: 599-605.
Bragantia 67: 823-831.
Melo B de and Sousa LB de (2011). Biologia da reprodução de Coffea arabica L. e Coffea canephora Pierre. Rev. Verde 6: 1-7. Ministério do Desenvolvimento, Indústria e Comércio Exterior (MDIC) - Secretaria de Comércio Exterior (SECEX) (2013).
Balança Comercial Brasileira. Available at [http://www.camex.gov.br/portalmdic/sitio/interna/index.php?area=5]. Accessed January, 15, 2013.
Mojena R (1977). Hierarchical grouping methods and stopping rules: an evaluation. Comput. J. 20: 359-363.
Moreira RMP, Ferreira JM, Takahashi LSA, Vasconcelos MEC, et al. (2009). Potencial agronômico e divergência genética entre genótipos de feijão-de-vagem de crescimento determinado. Semina Ciências Agrárias 30: 1051-1060.
Rodrigues WN, Tomaz MA, Ferrão RG, Ferrão MAG, et al. (2012). Estimativa de parâmetros genéticos de grupos de clones de café conilon. Coffee Sci. 7: 177-186.