3D THERMO-ELASTIC DISTORTION MEASUREMENTS ON OSIRIS SIC HARDWARE
BY HOLOGRAPHIC INTERFEROMETRY AND CORRELATION WITH FINITE
ELEMENT MODELS
F. Eliot* (1), C. Thizy(2), D. Ballhause* (3), G. Laduree(4), D. Logut(5)
(1) EADS-Astrium, 31 Rue des Cosmonautes, 31402 Toulouse, France - [email protected]
(2) CSL - Université de Liège, Avenue du Pré-Aily, 4031 Angleur, Belgium - [email protected]
(3)EADS-Astrium, 88039 Friedrichshafen, Germany - [email protected]
(4)ESA ESTEC, Keplerlaan 1, NL-2200 AG Noordwijk ZH, The Netherlands -[email protected]
(5) EADS-Astrium, 31 Rue des Cosmonautes, 31402 Toulouse, France - [email protected]
ABSTRACT
Accurate prediction and verification of thermal distortions are of primary importance for highly stable opto-mechanical structures to deliver high quality images. Modelling guidelines have been issued, for bolted and glued connections, using samples, during the first phase of this study. The aim of this second phase is to validate those guidelines on a complete instrument. Thermal load cases have been applied to OSIRIS STM flight representative hardware. Thermo-elastic distortions have then been measured with a four-illuminations holographic camera system providing the three components of displacement without physical contact on the hardware. This technique was developed and validated for this study in CSL laboratory.
Tested load cases have been analytically reproduced using transient analysis for thermal mapping. Predictions obtained by Finite Element Modelling have then been compared to the test results.
The predictions are within measurement uncertainties (120nm to 400nm): validity of the modelling guidelines, on a complete instrument, has been assessed.
1 INTRODUCTION
The objective of the first phase of this project [1] was to improve and develop analytical predictions and verification of thermo-elastic distortions using sample testing for modelling correlation. The study was performed on SiC/SiC and SiC/TA6V bonded and bolted samples representative of the connections/junctions used in stable structures and identified as significant contributors to the instrument stability. In this study, physical properties of material involved are assumed to be well known. Finite Element Modelling and holographic measurement technique recommendations have been issued after phase 1 completion. The second phase of the project aimed at evaluating and validating the outcomes of phase 1 on a flight representative hardware, including all contributors tested during phase 1.
OSIRIS STM instrument has been retained as it offers several advantages to fulfil phase 2 objectives.
It includes the following elements (Fig. 1):
the M2 baseplate, the M1-M3 baseplate, the central tube
and the cap (SiC), the three interface bipods with satellite (TA6V). A mirror M1 has been bolted to M1-M3 baseplate. This STM contains SiC/SiC glued interfaces between tube / M1-M3 and M2 baseplates and between tube and cap. It contains also glued and bolted SiC/TA6V interfaces, between lateral bipods and M2 baseplate and between the SiC Cap and the central bipod, a SiC/SiC bolted interface between M1 mirror and the M1-M3 baseplate.
Figure 1. OSIRIS STM
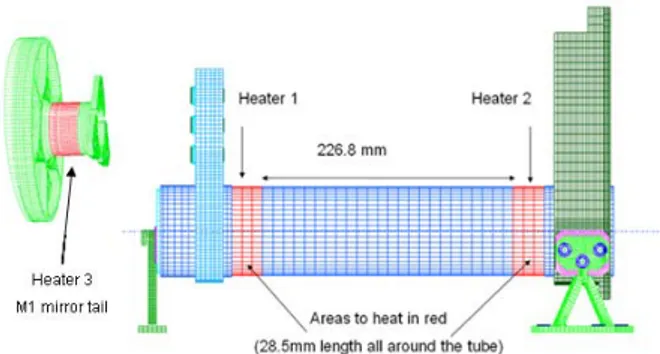
Heaters have been glued at each extremity of the tube and around the mirror tail (Fig. 2).
Figure 2. Heaters location
M1 Mirror Bipod MX Baseplate M2 Baseplate M1-M3 Tube Cap
Several load cases have been performed: measurement of the M2 baseplate (divided in two tests because of the size of the M2 baseplate), the M1-M3 baseplate, the M1 mirror interface (I/F) and the M1 mirror. This paper will present the results obtained for the right part of the M2 baseplate with heater 2 (Fig.2) powered (case 1) and the ones for the M1 mirror I/F with heater 3 (Fig. 2) powered (case 2). For case 2, the M1 mirror is mounted between the two baseplates to measure the I/F with the holographic camera (HC). The field of view (FoV) of the HC for both cases is presented in Fig. 3, the red area is the region of interest: 255x236 mm² for case 1 and 131x111 mm² for case 2. The X- and Y- axis are the in-plane axis in the FoV, respectively horizontal and vertical, Z is the out-of-plane axis.
Figure 3. FoV for the two load cases presented, (left) right part of the M2 baseplate (right) M1 mirror I/F
2 TESTING DESCRIPTION 2.1 3D displacement Measurement
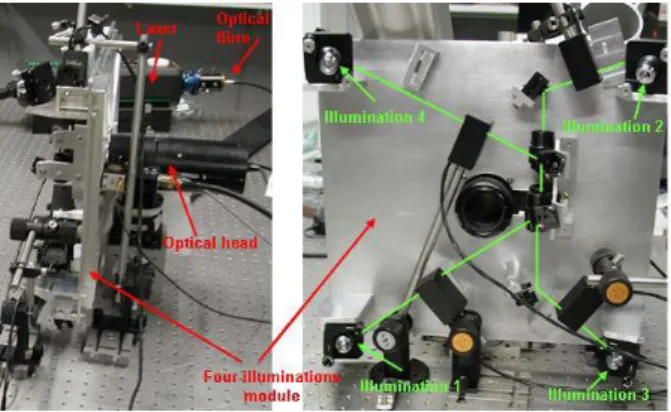
The holographic camera developed by CSL [2], [3] has been used to measure the thermo-elastic distortions on a whole field and contactless. It is composed of a compact optical head and an electronic rack containing the 5W Nd-YAG laser operating at 532 nm. An optical fibre brings the light from the laser to the optical head, which makes it a flexible instrument. A first step consists in recording the hologram of the object under test, the reference state. Then, a stimulation (thermal or mechanical) is applied to the object. Finally the hologram is readout; the interference pattern resulting from the superposition of the wavefront diffracted by the hologram (reference state of the object) and the one coming directly from the object (deformed state of the object) is recorded on a CCD camera. The phase image obtained is composed of a fringe pattern representing the relative displacement of the surface. This phase image is then unwrapped to obtain the continuous relative displacement. Each hologram readout partially erases the hologram, which means that only typically 4 readouts can be performed from the same recording. Nevertheless, successive measurement sequences (hologram recording and readout) can be performed indefinitely, which allows measuring large displacements. The HC usually allows measuring the out-of-plane relative displacements because of the object illumination and observation geometry. For this study, a four-illuminations configuration has been
developed to measure the three components of the displacement [4], as shown in Fig. 4.
Figure 4: Four-illuminations configuration of the holographic camera
The four-illuminations module is interfaced on the optical head of the HC and splits the laser beam into four beams using cube beam-splitters and folding mirrors. Four holograms are simultaneously recorded in the photorefractive crystal of the HC; the readout is sequential. In this configuration only one acquisition can be performed from the same reference. The three components of the displacement are obtained by solving an overdetermined linear system [4]. The system has been designed to measure large objects, typically 250x250 mm². The measurement range is such that the sum of the maximal relative displacements along the three measurement directions is about 20 µm. The system has been validated in the lab using a 60 mm SiC disc with a well-known CTE, mounted on a three-axis translation stage to introduce rigid body translations. This validation phase showed that many factors influence the results, the main ones are: noise in the data, temperature change of the four-illuminations module, error on the calculation of the sensitivity vector, drift in the laser wavelength. A reference is therefore added in the field of view of the HC to check the reliability of the measurements and to apply a correction to the measurements if necessary. This reference is a piece of Zerodur with a length of 70 mm and a CTE of 0.05x10⁻⁶ /K. It is located away from the
heated area and its temperature variation is less than 2°C; it can therefore be considered to have zero expansion compared to the measurement uncertainties involved. Also, the same test is performed at least three times to check the consistency of the results. The measurement uncertainties obtained from the validation are:
- ± 120 nm for the relative displacements
- ± 230 nm for the absolute in-plane displacements - ± 400 nm for the absolute out-of-plane displacements Using the four-illumination holographic technique puts some constraints on the test set-up. The measurement principle is holographic interferometry and it therefore requires a good mechanical stability between the HC
and the tested object. Large objects are tested and the illuminations are not normal to the surface, it is therefore needed to improve the laser light scattering of the surface by applying white powder on the object. For the measurement of surfaces with steps, shadow areas are created and no measurement can be performed in these areas. Small displacements of the illuminations with respect to the tested object will be interpreted as a displacement of the object, it is therefore important that the four illuminations do not move during the measurement. The four-illuminations module is made in aluminium, for weight and budget reasons, the temperature of the HC must therefore be kept constant during the test to avoid any additional measurement errors. The validation phase shows that for temperature variation of 0.01 °C on the HC, the measurement is still reliable.
2.2 Test set-up
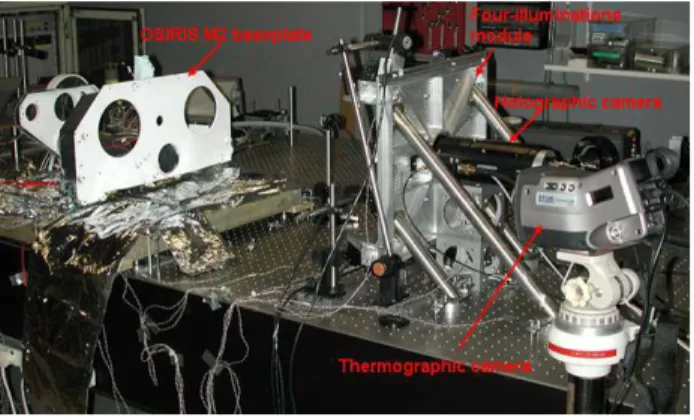
In order to limit the influence of vibrations on the measurement, OSIRIS and the HC are implemented on an optical table (Fig. 5). A stable temperature of the HC is needed, the test set-up is therefore implemented in a closed lab and is controlled from outside the lab. The measurements are performed once the thermal equilibrium is reached in the lab. The temperature of the measurement system is monitored with thermocouples and the test duration is short enough to have temperature variations compatible with the 0.01°C criteria.
Figure 5. Test set-up
The thermal load creates temperature gradients in the connections that are measured with thermocouples (uncertainty on absolute temperature 0.4°C) and a thermographic camera (uncertainty on absolute temperature 2°C) to have the temperature distribution. 2.3 Testing and results
The test sequence is presented in Fig. 6. The heating lasts only a few minutes to create temperature gradients in the connections. The delta temperature applied to the hardware is derived from the predictions and is adjusted if incompatible with the measurement system (fringes density too high).
Figure 6. test sequence
An example of the phase images obtained with the four illuminations for case 1 is presented in Fig. 7. Post processing of these data produced the three displacement maps of Fig 12.
Figure 7. Phase images obtained for case 1
3 ANALYSIS APPROACH
In the frame of the study a dedicated analysis procedure is developed. It consists of three steps: a thermal analysis to establish the temperature field, the mechanical thermo-elastic distortion analysis to obtain the deformation and finally a post processing of the displacement data. A detailed model of the structure including the modelling assumptions that were issued in the first phase of the study is used.
3.1 Thermal analysis
In the first analysis step the temperature distribution in the structure is established. A transient heat transfer analysis is used with the thermocouple data as boundary conditions. A transient analysis is required as the performed test is also measuring a transient state. As the overall thermal input parameters for the heater and the heat flux into the structure are not known with enough detail to perform a full physically representative thermal analysis a simplified approach is chosen. In between the thermocouple data points TC on the structure, the thermography measurement results are evaluated at dedicated locations TG (see Fig 8.). During the transient analysis the temperature between the TC points increases until steady state is reached as depicted in Fig 9. The suitable evaluation time (te) of the transient heat
transfer analysis is identified by the best fit to the TG data points.
Figure 8. Thermography image of Case 1 with location of TG points for evaluation time determination
Figure 9. Temperature distribution calculation based on TC boundary conditions and TG reference
The only drawback is the higher measurement uncertainty of the thermography image compared to the thermocouples for absolute temperature values. A correction of the absolute value of the thermography map is performed using thermocouple data in the field of view of the thermography camera.
3.2 Thermo-elastic distortion analysis
With the temperature map as input, the displacement field of the overall structure is obtained from the thermo-elastic distortion analysis. The displacement field of the surface nodes in the field of view of the holographic camera system is extracted with the components oriented in the coordinate system of the HC FoV.
3.3 Displacement Post-processing
In order to allow the direct comparison between the measurement and the analysis the nodal displacement fields are transformed into the same type of pixel map as the test results. The irregular node pattern is interpolated to generate the regular pixel map as depicted in Fig 13. for the Y-component of Case 1. Based on these two maps from test and simulation, respectively, a quantitative comparison can be made for the three components of displacement. The resulting
displacement component maps can be statistically evaluated to obtain mean value, standard deviation, minimum, maximum and range of the displacement. These quantities together with the difference maps allow a quantitative comparison of test and simulation.
Figure 13. Interpolation of simulated displacement component to generate regular pixel map in the FoV
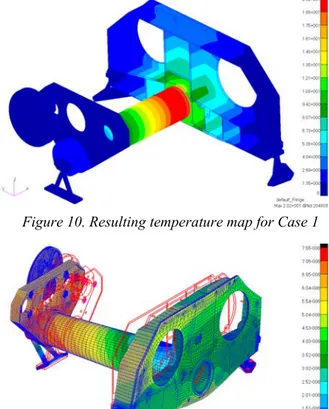
Figure 10. Resulting temperature map for Case 1
Figure 11. Overall displacement obtained from thermo-elastic distortion analysis for Case 1
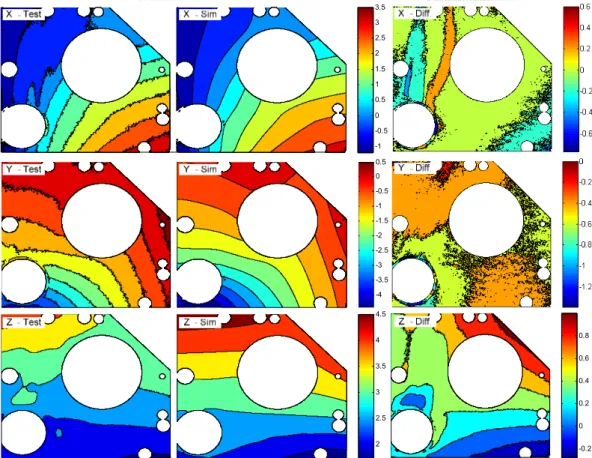
The displacement maps resulting from the measurement of Case 1 are given in Fig. 12. The analysis procedure, as described above, is applied to derive the temperature map (Fig 10.) and the displacement field (Fig. 11). The obtained displacement components in the FoV are extracted and interpolated to derive a similar displacement map as obtained from the HC. The component maps from the simulation are depicted in Fig. 12 in the centre. The displacement maps from test and simulation of Case 1 are statistically evaluated and compared in Tab. 1. Difference maps are calculated by pixel-wise subtraction of the test map from the simulation map. The results are given in Fig. 12 on the right. The average displacement of this difference map is used as a quantitative criterion for the assessment of the correlation. For the X-component an average difference of 0.06 µm is obtained which is an extremely good correlation results. The Y- and Z-component results with -0.38 and 0.44 µm, respectively, are slightly outside the measurement uncertainties of 0.23µm (in-plane uncertainty) and 0.4µm (out-of-(in-plane uncertainty) but the uncertainty of the simulation also has to be considered. In a parallel Astrium internal study, the influence of the uncertainty on the temperature measurement and on the materials CTE is assessed by a stochastic analysis [5]. The uncertainty range is in the order of 0.1µm and thus the ranges of simulation and
test overlap for all components. The correlation of Case 1 is therefore judged successful.
Table 1. Statistic evaluation results for Case 1
Sim. Test Diff.
Average 0.88 0.81 0.06 Deviation 1.17 1.19 -0.02 Average -0.99 -0.61 -0.38 Deviation 0.97 0.90 0.06 Average 3.36 2.93 0.44 Deviation 0.77 0.55 0.22 CASE 1 X Y Z
5 CORRELATION RESULTS CASE 2
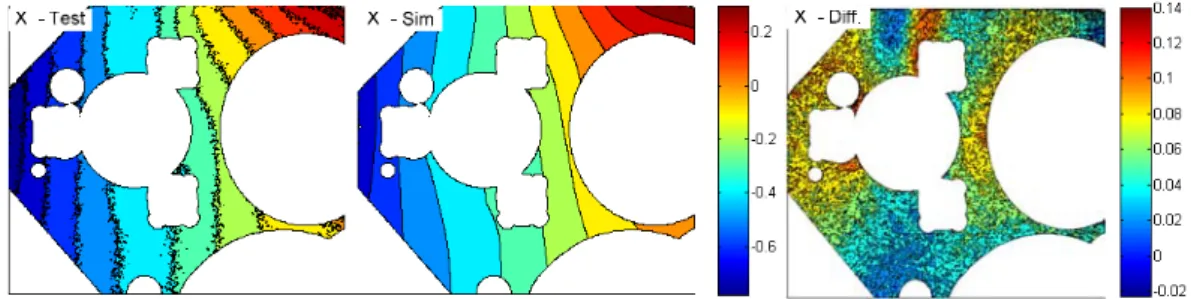
In Case 2 the heating is restricted mainly to the mirror with some gradients in the baseplate. Consequently deformations are also restricted to the mirror and its I/F area. The temperature map resulting from simulation is given in Fig. 15. The displacement maps from test and simulation for the X-component and the respective difference map are plotted in Fig. 14. The statistical evaluation of the displacement components maps is summarized in Tab. 2. The correlation results are even better than for Case 1. The average differences of 0.07, 0.03 and 0.13µm for X-, Y- and Z-component are well within the measurement accuracy (0.23µm for X and Y, 0.4µm for Z). The correlation is successful.
Displacement X [µm] -1 -0.5 0 0.5 1 1.5 2 2.5 3 3.5 -4 -3.5 -3 -2.5 -2 -1.5 -1 -0.5 0 0.5
2 2.5 3 3.5 4 4.5 -0.2 0 0.2 0.4 0.6 0.8
Figure 15. Temperature map obtained for Case 2 Table 2. Statistic evaluation results for Case 2
Sim. Test Diff.
Average -0.24 -0.31 0.07 Deviation 0.23 0.24 0.00 Average 0.54 0.51 0.03 Deviation 0.20 0.21 -0.01 Average 0.54 0.41 0.13 Deviation 0.42 0.28 0.14 CASE 2 X Y Z 6 CONCLUSIONS
For this study, a specific measurement method has been developed and validated by CSL. The four-illuminations holographic camera system provides the three components of displacement without physical contact over an area about 250mmx250mm with an uncertainty: - ± 120 nm for the relative displacements
- ± 230 nm for the absolute in-plane displacements - ± 400 nm for the absolute out-of-plane displacements The simulations have allowed to validate the modelling guidelines, issued from phase 1, on a flight representative hardware. In the presented two load cases correlation differences between 0.03 and 0.44 µm are obtained. The overall average difference for all five load cases is 0.26µm and 0.31µm for the in-plane and 0.33µm for the out-of plane components. These results are slightly outside the measurement accuracy range of 0.23 for in-plane and inside the range of 0.4µm for out-of plane absolute displacement. In analogy to the measurement data the reported analysis results are also subject to numerous uncertainties. Especially the quality of the temperature field mapping is assumed to include some remaining uncertainty. From structural point of
view the used materials (SiC and Titanium) are well characterized and are not expected to be a significant source of uncertainty as well as the modelling quality which was analysed in detail in phase 1 of the study As there are numerous uncertainties to be expected in the analysis from temperature map generation to displacement extraction this results is a very good success. In a parallel Astrium internal study, the influence of uncertainty is assessed by a stochastic analysis. The uncertainty range is in the order of 0.1µm and thus the ranges of simulation and test overlap for all components. This supports the successful conclusion of the present study.
7 REFERENCES
[1] C. Thizy, F. Eliot, A. Shannon, Y. Stockman, D.
Logut, "Thermo-elastic distortion measurements by holographic interferometry and correlation with finite element models for SiC connections/junctions on satellite"- IAC, Pragues, 2010.
[2] M.P. Georges, V.S. Scauflaire, P.C. Lemaire, "Compact and portable holographic camera using photorefractive crystals. Application in various metrological problems", Appl. Phys. B 72, 761 (2001).
[3] M. Georges, C. Thizy, V. Scauflaire, S. Ryhon, G. Pauliat, P. Lemaire, G. Roosen, "Holographic interferometry with photorefractive crystals : review of applications and advances techniques", Speckle Metrology 2003, SPIE Vol. 4933, pp. 250-255, Trondheim, Norway, 2003.
[4] K.A. Stetson, "Use of sensitivity vector variations to determine absolute displacements in double exposure hologram interferometry", Applied optics, 29, 502, (1990).
[5] D. Ballhause, "Stochastic Analysis of Dimensionally Stability of Instrument Structures", European Conference on Spacecraft Structures, 20-23 March 2012, ESA/ESTEC, Noordwijk, The Neteherlands
Figure 14. Displacement maps from test, simulation and difference map for X-component. Note that the areas around the bolts produce shadowed areas in the holography image and are thus excluded from the evaluation