1
Reduction of Odours in Pilot-Scale Landfill Biocovers
M. A. Capanemaa; H. Cabanab; A. R. Cabralc*
a Formerly: Geoenvironmental Group, Department of Civil Engineering, Université de
Sherbrooke, Sherbrooke, Quebec, Canada J1K 2R1. Presently: Laboratório de Pesquisas em Resíduos Sólidos, LARESO - Depto de Engenharia Sanitária e Ambiental, Universidade Federal de Santa Catarina, Campus Universitário, CEP 88040-970, Florianópolis, SC, Brazil.
b Environmental Engineering Laboratory, Department of Civil Engineering, Université de
Sherbrooke, Sherbrooke, Canada J1K 2R1.
c Geoenvironmental Group, Department of Civil Engineering, Université de Sherbrooke,
Sherbrooke, Quebec, Canada J1K 2R1.
*Corresponding author: Tel.: +1 819 821-7906; fax: +1 819 821-7974. Postal address: 2500, boul. de l’Université, Sherbrooke, Quebec, Canada J1K 2R1.
E-mail addresses: alexandre.cabral@usherbrooke.ca (A. R. Cabral);
marlon.capanema@usherbrooke.ca (M. A. Capanema); hubert.cabana@usherbrooke.ca (H. Cabana).
2 Abstract
Unpleasant odours generated from waste management facilities represent an environmental and societal concern. This multi-year study documented odour and total reduced sulfur (TRS) abatement in four experimental landfill biocovers installed on the final cover of the Saint-Nicéphore landfill (Canada). Performance was evaluated based on the reduction in odour and TRS concentrations between the raw biogas collected from a dedicated well and the emitted gases at the surface. Odour analyses were carried out by the sensorial technique of
olfactometry, whereas TRS analyses followed the pulse fluorescence technique. The large difference of 2 to 5 orders of magnitude between raw biogas (average odour concentration = 2 100 000 OU m-3) and emitted gases resulted in odour removal efficiencies of close to 100%
for all observations. With respect to TRS concentrations, abatement efficiencies were all greater than 95%, with values averaging 21 000 ppb of eq. SO2 in the raw biogas. The
influence of water infiltration on odour concentrations was documented and showed that lower odour values were obtained when the 48-hour accumulated precipitation prior to sampling was higher.
3 1. Introduction
The anaerobic decomposition of organic wastes within landfills generates a biogas composed of two important greenhouse gases, methane (CH4, 50 to 60%), and carbon dioxide (CO2, 40
to 50%). Biogas also includes trace concentrations (< 1%) of hazardous and odour pollutants, such as volatile organic compounds (VOCs; e.g. benzene, toluene, ethylbenzene and xylene, or BTEX), halogenated hydrocarbons, mercury (gaseous elemental Hg) and some odorous gases, such as sulfur compounds (Ducom et al., 2009; IPCC, 2007; Kim et al., 2001; Scheutz et al., 2008; Zou et al., 2003).
Unpleasant odours generated from waste management facilities represent an environmental and societal concern because they negatively affect the quality of life of the surrounding population, particularly if the landfill is located relatively close to crowded areas, as is the case with several landfills in China (He et al., 2011). The main environmental and societal impacts of odour emissions are: reduction of quality of life, decreases in local property values; a population which becomes more sensitive to and less tolerant of odours, potentially leading to odour complaints, and risks to workers’ health associated with the toxicity of some odorous and trace compounds. In addition, the public is concerned about the unknown effects of long-term exposure to landfill emissions (He et al., 2011; Scheutz et al., 2008; Sironi et al., 2005; USEPA, 2008).
Landfill odour emissions vary with meteorological conditions (e.g. atmospheric pressure and temperature) and within different sectors of the landfill. For example, odour concentrations of 120, 240 and 320 OU m-3 (odour units per cubic meter) have been measured on final covers,
4 daily covers and in the air, respectively; whereas for raw landfill biogas, odour concentrations were quite high, with values between 250 000 and 1 200 000 OU m-3 (Capelli et al., 2008;
Micone and Guy, 2007; Sironi et al., 2005).
Total reduced sulfur (TRS) are odorous compounds found in landfill biogas (Ducom et al., 2009; Sironi et al., 2005). The main sulfur compounds are: hydrogen sulfide (H2S), methyl
mercaptan (CH3SH), dimethyl sulfide (DMS, (CH3)2S), carbonyl sulfide (COS), carbon
disulfide (CS2) and dimethyl disulfide (DMDS, (CH3)2S2). H2S has the characteristic smell of
rotten eggs and is one of the main odorous compounds in landfill biogas. In addition, it is the most abundant (~ 80%) among sulfur compounds (Ducom et al., 2009; Hurst et al., 2005; Kim, 2006a; Lee et al., 2006).
Landfill sites have to comply with odour concentration and/or odour emission limits established by local regulations. The emissions can be controlled by gas recovery systems, daily covers, final covers, and masking and neutralizing techniques. However, it has been shown that gas recovery and final covers are not 100% efficient. In fact, gas recovery
efficiencies can vary from 50 to 85% (Lombardi et al., 2006; Manfredi et al., 2009; Spokas et al., 2006). Final cover integrity can be compromised by erosion caused by intense rainfall and differential settlement of the waste mass, the results of which are localized cracks or hotspots that facilitate release of biogas directly to the atmosphere as fugitive emissions (Lee et al., 2006). In relation to masking and neutralizing techniques, some products consisting in a mix of water and essential oils (i.e. concentrated hydrophobic liquids extracted from plants) are used to mask or neutralize the odor of ambient air and provide a better olfactory comfort. It is rather a palliative approach that diminishes the odour nuisance, without necessarily
5 eliminating it from the odour source. Several studies have been carried out to investigate the masking effects of odour compounds in gas mixtures (ADEME, 2008; Kim, 2010; Kim, 2011; MDDEP, 2006).
Management practices that could mitigate odour emissions are extremely important in
connection with the social acceptance and environmental sustainability of waste management facilities. Thus, landfill biocovers constitute an effective alternative for odour abatement. A biocover, which is part of a landfill final cover, optimizes the development and activity of ubiquitous microorganisms that can oxidize CH4 (into CO2), and some VOCs and sulfur
compounds in landfill biogas (IPCC, 2007; Iranpour et al., 2005). In addition, physical-chemical reactions, such as adsorption and absorption, can take place in the biocover soils, reducing their concentrations in the gas emitted to the atmosphere (Cooper and Alley, 2002; Ducom et al., 2009; He et al., 2011). The potential of odour abatement within landfill biocovers is high, with the reported removal efficiencies of 70-100% (Hurst et al., 2005; Iranpour et al., 2005). Solan et al. (2010) obtained odour abatement of 50% in a 0.20-m deep alternative daily cover constructed with demolition and construction wastes and woodchips.
A great number of studies about landfill biocovers have focused on the biotic oxidation of CH4
(Capanema and Cabral, 2012; Huber-Humer et al., 2008; Scheutz et al., 2009; Stern et al., 2007). However, few studies have documented odour abatement and among those treating the subject, few have used the sensorial method of olfactometry. This study documented the odour removal in four experimental biocovers under actual field conditions by olfactometry and TRS analyses. The four biocovers were constructed at the Saint-Nicéphore landfill (Quebec,
6 efficiencies) were calculated based on the reduction in odour and TRS concentrations between the raw biogas collected from a dedicated biogas well and the emitted gas at the surface of the field plots. Biogas loading, atmospheric pressure, temperature, precipitation and degree of water saturation (Sr) were the main parameters monitored during the study period.
2. Materials and Methods 2.1 Field plots
This study is part of a multidisciplinary research project that started in 2006, with the initial goal of evaluating the microbial oxidation of the greenhouse gas CH4 using biocovers in actual
field conditions (details in Cabral et al., 2010b; Capanema and Cabral, 2012). Overall, eight field plots – namely biocovers 1B, 2, 3B and 4, and field columns (FC) 1, 2, 3 and 4 –were constructed and monitored at the Saint-Nicéphore landfill (Quebec, Canada). In 2009, odour and total reduced sulfur abatement started to be evaluated. The present study was carried out on four field plots (biocovers 1B and 2, and FC 2 and FC 4), the characteristics of which are presented in Table 1. Samples were collected during the 2009 to 2012 sampling campaigns.
Biocover 1B measured 2.45 m (W) × 9.45 m (L). Its configuration included, from the bottom up, a 1.90-m gas distribution layer (GDL) of 12.7-mm clean gravel, a 0.50-m transitional layer of 6.4-mm gravel and a 0.30-m substrate layer (Figure 1). The latter consisted of one volume of a mixture of sand and compost (1:5 v/v) mixed with one volume of 6.4-mm gravel, with a resulting organic matter content of 7.2% go.m./gdry soil, a density (ρd) of 1 500 kg m-3 and a total
7 its construction, the final cover was excavated down to the waste mass, and it was constructed using higher permeability material to facilitate gas transport and promote CH4 oxidation. As a
consequence, the biogas loading could not be controlled (or monitored) for this particular field plot.
Figure 1: Profile of the configuration and instrumentation of biocover 1B.
Biocover 2 measured 2.45 m (W) × 9.45 m (L). Its configuration included, from the bottom up, a 0.30-m gas distribution layer of 12.7-mm clean gravel, a 0.10-m transitional layer of 6.4-mm gravel and a 0.80-m substrate layer (Figure 2). Its substrate consisted of the same mixture of sand and compost used in biocover 1B and had an organic matter content of 20% go.m./gdry soil, a density (ρd) of 700 kg m-3 and a total porosity of 64% (Table 1). Biocover 2 was fed with
biogas from a dedicated well installed near the field plots. The amount of biogas provided to the plots was controlled by means of a valve (with the exception of biocover 1B), and the flow was measured using a flow meter (Cole Parmer Co). Biocovers 1B and 2 were insulated from the silty soil constituting the final cover by a 1.5-mm HDPE geomembrane
(impermeabilization) and 0.15-m polystyrene panels. This insulation prevented lateral migration of moisture due to temperature gradients. In addition, the two biocovers were subdivided into four sections along their main axis. In each, temperature (TMC20-HD;
coupled HOBO U12 data loggers from Onset) and water content (ECH2O EC-5; connected to Em50 loggers from Decagon) were continuously monitored at several depths (e.g. 0.10 m).
8 FC 2 and FC 4 measured 0.90 m × 0.90 m. Their configuration included, from the bottom up, a 0.10-m gas distribution layer of 12.7-mm clean gravel, a transitional layer of a fine wire mesh (to avoid fine grains from clogging gravel pores) and a 0.45-m substrate layer, as shown in Figure 3. The substrate of FC 2 consisted of a 0.30-m sand layer covered with a 0.15-m top soil layer, whereas the substrate of the FC 4 consisted of a 0.30-m sand layer covered with a 0.10-m top soil layer and a 0.05-m superficial layer of top soil enriched with compost.
Figure 3: Configuration and instrumentation of the FC 2 and FC 4.
The substrate layer of both FC 2 and FC 4 was instrumented with temperature (TMC20-HD; coupled HOBO U12 data loggers from Onset) and water content (ECH2O EC-5; connected to Em50 loggers from Decagon) probes. FC 2 and FC 4 were fed with biogas provided by the same dedicated well used for biocover 2, and the flow was measured using a flow meter (Gilmonts Instruments Inc.). These field columns were constructed on the surface of the final cover, and insulated from the outside environment, i.e. the atmospheric air, by PVC panels and a 0.30-m layer of silty sand soil, the same that was used in the final cover of the site. The insulation aimed to simulate the installation of the field columns within the final cover, and to diminish the influence of changes in atmospheric temperature directly on the deeper layers of the field columns. Finally, weather information, such as atmospheric temperature and
precipitation, was continuously recorded by a weather station installed at the landfill site.
9 Odour removal efficiencies were evaluated using the odour concentrations from the raw and emitted biogas. Odour samples were collected in Tedlar® (polyvinyl fluoride, PVF) and
Nalophan® (polyethylene terephtalate, PET) bags. These materials are suitable for odour
analyses as they do not react (i.e. they are chemically inert) with the sample compounds (AFNOR, 2003; Beghi and Guillot, 2008; Nielsen and Jonsson, 2002). Tedlar bags are reusable and had to be preconditioned prior to gas collection, thereby ensuring elimination of any residual odorous compound. The bags were flushed for 48 hours with an odour-free gas (filtered ambient air) in the laboratory (temperature = 21 °C). They were emptied immediately before leaving for the field for sample collection.
For biocovers 1B and 2, from 2009 to 2011, a volume of 60 to 120 l of emitted gas was collected at the surface, from inside a rectangular Plexiglas® (polymethyl methacrylate,
PMMA) flux chamber, formed by a frame and movable cover. The flux chamber measured 1.22 m (length) × 0.76 m (width) × 0.25 m (height), resulting in an area of 0.93 m2. The frame
of this flux chamber was inserted 0.15 m deep into the biocover surface, leaving 0.10 m outside the soil. The perimeter was sealed with bentonite. The cover, also made of Plexiglas, was equipped with a stainless steel valve, placed at its center, from where samples were collected. Teflon (polytetrafluoroethylene, PTFE) tubing with an inner diameter of 9.5 mm and stainless steel fittings were used to stream the gas samples from the flux chamber to the bag. The emitted gas was sampled using a peristaltic pump (from Cole-Parmer Instrument Co), whose flux was set to a value of 150 ml min-1, which corresponds to the average CO2 and
CH4 surface fluxes. This average was calculated based on a large data base of CH4 and CO2
emission measurements. The details of CH4 and CO2 emission measurements were described
10 FC 4, a volume of 30 l of emitted gas was collected using a round stainless steel flux chamber (from Consumaj Inc.), which had a 0.50-m diameter and a resulting area of 0.20 m2. As in the
case of the rectangular chamber, Teflon tubing and stainless steel fittings were used to stream the gas from the chamber to the bags.
In addition to gas collection, CH4 surface scans were performed on a weekly basis on
biocovers 1B and 2 using a portable FID (TVA 1000B, Thermo Scientific). This enabled identification of any localized biogas hotspots that might bias the evaluation of odour abatement efficiency of the biocover. The scan procedure is detailed in Roncato and Cabral (2012).
For the TRS analyses, 10-l samples were collected on the surface in metalized Teflon® FEP
(fluorinated ethylene propylene) bags. These bags were preconditioned by flushing them with an odour-free gas (filtered ambient air) for 24 hours in the laboratory. Although Teflon FEP bags are suitable for this kind of analysis, it is known that minor sorptive loss of TRS may occur on the inner wall of the bags (Kim, 2006b). The sorptive loss of TRS was not evaluated within the present study, and therefore is one of its limitations. The sampling procedure followed the same procedure and used the same materials described for odour sampling, i.e. a flux chamber, the peristaltic pump with a flux set at a value of 150 ml min-1, and Teflon tubes
and stainless steel fittings. For biocovers 1B and 2, the flux chamber was the same used in the collection of odour samples, i.e. the 0.93-m2 rectangular Plexiglas chamber. For FC 2 and FC
4, the flux chamber measured 0.90 × 0.90 m, with a resulting area of 0.80 m2. This flux
11 edges of the field column. To avoid infiltration of atmospheric air during the sampling
procedure, the frame was sealed with a fine soil paste along its perimeter.
Raw biogas samples were collected from the dedicated biogas well for both odour and TRS analyses. As it presented high odour concentrations, raw biogas had to be diluted 65 to 300 times in filtered air prior to olfactometric analyses. The dilutions were performed by using an acrylic flow meter equipped with a controlling valve (0 to 10 LPM, from Cole-Parmer
Instruments Co). First, a known amount of odour-free gas (i.e. filtered air) was sampled into the bag, then a known volume of raw biogas was sampled to form the mixture, i.e. diluted raw biogas, by connecting the flow meter to a sampling port installed at the biogas well. A volume of 30 to 60 l of diluted raw biogas was used in the odour analyses, while for the TRS analyses, 10-l samples were collected.
For the odour analyses, each sample of raw and emitted gas was paired with a field blank consisting of filtered ambient air that was collected in a similar bag. In addition, the field blank bags were prepared by following exactly the same procedure as their respective gas samples. The main objective of having field blanks was to detect any contamination other than that present in the tested gas samples; for example during the collection of samples and
transport. Odour concentrations from emitted and raw biogas were corrected by subtracting the odour concentration from the respective field blank.
12 2.3 Odour analyses
The odour analyses followed the European olfactometry standard EN 13725 (AFNOR, 2003). From 2009 to 2011, the analyses were carried out using a dynamic dilution olfactometer (Odile, Odotech Inc.). In 2012, this olfactometer was no longer available and the analyses were performed using an Onose-8 olfactometer (Consumaj Inc.). The odour concentration was evaluated in odour unit per cubic meter (OU m-3) according to the olfactive sensitivity of a
certified panel formed of 4 to 8 individuals. Panel certification was carried out prior to the odour analyses to select individuals who are able to evaluate odour samples, according to their sensitivity to a standard compound, i.e. n-butanol. In accordance with the certification, the individual threshold to the n-butanol had to be between 20 and 80 ppb (AFNOR, 2003). During the odour analyses, the certified panel tested different dilutions of the collected sample in an odour-free gas (filtered air). The odour concentration was subsequently obtained from the number of dilutions required to reach the detection threshold of the sample. The detection threshold is the dilution factor at which 50% of a population detects the odour and 50% does not detect it.
2.4 Total reduced sulfur analyses
Total reduced sulfur concentrations were analyzed by the pulsed fluorescence technique using a thermal oxidizer (Model CDN-101, CD Nova Inc.) coupled with a SO2 analyzer (Pulsed
Fluorescence SO2 Analyzer Model 43i, Thermo Scientific). First, the sample bag was
connected to the thermal oxidizer using a Teflon tube. The SO2 present in the collected sample
13 material to remove SO2 from the sample. The other sulfur compounds were then converted
into SO2 by the thermal oxidizer under high temperature (850 °C). The SO2 resulting from this
conversion fluoresces after being excited by a short burst of ultraviolet light. Finally, SO2 was
pumped at a flow rate of 0.4 l min-1 and measured in ppb of equivalent SO2 by the SO2
analyzer. The latter was regulated in a 0-to-100-ppm range, with a precision of 1% of the reading, and a lower detectable limit lower than 0.5 ppb. It was calibrated using filtered air and a standard SO2. Filtered air was provided by a portable air filtration system formed by 3
cylinders of filters connected in series, i.e. silica gel, anhydrous calcium sulfate – Drierite®,
and activated carbon. The standard SO2 (from Praxair, GTS-Welco Inc.) had a certified
concentration of 104 ppm and an analytical accuracy of ± 2%. A new calibration was carried out in the beginning of each sampling year, and the resulting calibration curve was used to adjust measured values, with a coefficient of determination R2 greater than 0.99. In addition,
14 3. Results and Discussion
3.1 Raw biogas
A statistical summary of the results of odour and TRS concentrations from raw and emitted gases is presented in Table 2. Odour concentrations in raw biogas ranged from 640 000 to 4 000 000 OU m-3 and averaged 2 100 000 OU m-3. The standard deviation (STD) was equal to
950 000 OU m-3 for 22 observations. The 95 percent confidence interval estimate on odour
concentrations from raw biogas extended from 1 700 000 to 2 500 000 OU m-3. Despite the
skewed behavior of odour concentrations from raw biogas, the difference was not significant for the 2011 and 2012 sampling campaigns (p > 0.05). For example, in 2011, the average odour concentration was 2 800 000 OU m-3 (STD=600 000 OU m-3, n=10); whereas in 2012,
odour concentrations averaged 2 300 000 OU m-3 (STD=810 000 OU m-3, n=5). Large
variations in odour concentrations in raw biogas have been found in other studies. For example, Capelli et al. (2008) obtained odour concentrations varying from 250 000 to 1 000 000 OU m-3 in an Italian landfill.
TRS concentrations in raw biogas averaged 21 000 ppb, and concentrations ranged from 1 300 to 130 000 ppb, as shown in Figure 4. The standard deviation of 29 000 ppb was higher than the average for the n=22 observations. For several sulfur compounds (e.g. H2S, CH3SH, DMS,
CS2 and DMDS), the standard deviations were higher than the averages. Such a significant
variation can be partly attributed to the fact that sulfur compounds generation (e.g. H2S) is not
homogeneous within the waste mass (Kim, 2006a; Lee et al., 2006). The 95 percent
15 39 000 ppb. The range of the TRS concentrations obtained in this study is comparable to, and in the same order of magnitude of, other studies that analyzed some sulfur compounds. For example, concentrations of 89 000 to 2.1×10⁶ ppb of H2S; 33 to 164 000 ppb of CH3SH; and
64 to 30 000 ppb of DMS have been reported (Ducom et al., 2009; Kim, 2006a; Kim et al., 2005; Lee et al., 2006). This analysis is partial and further study would be needed to assess different species of sulfur compounds separately in the landfill biogas. However, the presence of TRS indicates that the biogas has potential odorous pollutants in its composition.
Figure 4: TRS concentrations in the raw biogas during the sampling period.
With respect to field blanks, odours originate from the materials of the bags and tubing. In this study, they averaged 100 OU m-3 (STD=90 OU m-3). In spite of thorough preparation before
gas collection, i.e. ventilation with odour-free air (in the case of Tedlar bags), low odours were released by these materials during sampling and transport. According to the panelists, the odours from field blanks could be associated with plastic, which was totally different – and less unpleasant – than the raw and emitted gases that were evaluated. Thus, it indicated that there was no important contamination of blanks with outer gases from the landfill site.
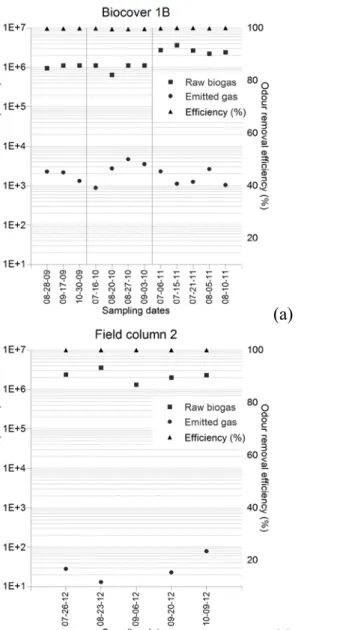
3.2 Biocover 1B
Figure 5, shows odour concentrations in the raw and emitted gases, and odour removal efficiencies obtained for each sampling date for the biocovers and field columns tested.
16 Figure 5 : Odour concentrations and removal efficiencies of the four field plots.
Biocover 1B had the highest odour concentrations in emitted gas in comparison to the other field plots (Figure 5a). The average odour concentration was 2 200 OU m-3, and the minimum
and maximum concentration values were 880 and 4 700 OU m-3, respectively. The standard
deviation was equal to 1 100 OU m-3 for n=12 observations, and the 95 percent confidence
interval estimate on odour concentrations extended from 1 400 to 2 900 OU m-3 (Table 2).
Large differences (3 to 4 orders of magnitude) in odour concentrations between the raw biogas and the emitted gas at biocover 1B resulted in removal efficiencies close to 100% for all the sampling dates, from 2009 to 2011.
Analyses of total reduced sulfur were carried out in August and September of 2009 and 2011. The concentrations obtained for the emitted gas at the surface of biocover 1B averaged 90 ppb, with minimum and maximum values of 4 to 290 ppb, respectively (STD=110 ppb for n=11 observations, Table 2). The 95 percent confidence interval estimate on TRS concentrations from biocover 1B extended from 45 to 300 ppb. The values obtained in this study were in the same order of magnitude as H2S values measured by Lee et al. (2006) (3 to 4 000 ppb) in the
atmospheric air at different landfills, and higher than several sulfur compounds (H2S, CH3SH,
DMS, etc.) values measured by Shon et al. (2005) . The reduction in the TRS concentrations between the base of the biocovers and their surface (Table 2) resulted in 95.5 to 100% removal efficiencies.
Considering the high efficiencies in odour and TRS removal obtained in this study, any attempt to correlate the two would not be as meaningful as in a case where a wide range of
17 efficiencies were obtained. In addition, there is an important variability in the values of the two parameters (high standard deviations, Table 2) and the number of comparable values (i.e. from samples collected on the same dates) was limited.
Meteorological conditions (e.g. 48-hour accumulated precipitation and temperature) and biogas loading are presented in Table 3 for each sampling date. With respect to biocover 1B, temperature conditions fluctuated between 7.1 and 25.5 °C at the surface and from 5.7 to 40.4 °C at a depth of 0.10 m during collection of odour samples for the 12 sampling dates (Table 3). Temperatures within the biocover were usually higher than atmospheric temperature because of the exothermic reactions (e.g. methane oxidation) occurring due to microbial activity within the substrate, and the relatively warm temperature of the raw biogas (Cabral et al., 2010a; Gebert and Groengroeft, 2006; Scheutz et al., 2009). According to some studies (e.g. Delhomenie and Heitz, 2005; Kennes and Thalasso, 1998), the suitable range of temperatures for the microbial activity in biofilters is between 25 and 40 °C. The degree of water saturation (Sr) varied from 50 to 70% within the soil of biocover 1B. The fact that Sr
remained well below 85%, indicates that air in the pores of the biocover was far from being occluded (Burnotte et al., 2005). It is relevant to note that variations in atmospheric pressure in the hours preceding and during sampling (data not presented herein) were always lower than 0.8 kPa, i.e. no sudden decrease or increase in atmospheric pressure was recorded. Important variations might have caused an increase or decrease in emissions, thus in odour values. As far as the present study is concerned, the high odour abatement efficiencies obtained would not require further analyses, such as correlating variations in atmospheric pressure with odour concentration values.
18 The minimum and maximum odour concentrations for biocover 1B were obtained on July 16 and Aug. 27, 2010 respectively (Figure 5a), with the maximum value being nearly 5 times greater than the minimum. As indicated in Table 3, meteorological conditions such as precipitation and temperature were quite similar for these dates. The degrees of water saturation were also similar (e.g. 70 and 67% at a depth of 0.10 m, respectively).
Consequently, the large disparity could not be caused by changes in external conditions or pore occlusion by water. One possible explanation for the disparity in odour values was that the higher odour values were associated with higher surface fluxes. In fact, during a scanning procedure performed the week after July 16, a leak was detected on biocover 1B and promptly sealed. CH4 and CO2 surface fluxes increased accordingly and were much higher on Aug. 27
than on July 16 (data not presented herein). It has been reported that high fluxes of biogas can disturb the development of vegetation in landfill soils by asphyxiating roots (depletion of O2)
in the rhizosphere zone and by the presence of some toxic compounds at trace concentrations (e.g. Chan et al., 1991; El-Fadel et al., 1997). The vegetation was thick and abundant on July 16, whereas on Aug. 27 it was sparser and drier.
Higher odour and TRS concentrations measured at the surface of biocover 1B in comparison with the other field plots can be attributed, among other reasons, to the fact that this biocover was constructed directly on the waste mass, as described in section 2.1. It could be considered a constructed hotspot. Therefore, high biogas loadings reached the biocover leading to high concentrations of odour and total reduced sulfur at the surface. In addition, the substrate layer of this plot was thinner (0.30 m) and constituted of coarser soils. Both thickness and size of voids affected the residence time of biogas, i.e. the time during which biogas is in contact with the substrate. Such combined conditions, i.e. high loadings and reduced residence time,
19 diminished the time for microbial activity and for other abatement reactions, such as
absorption and adsorption.
3.3 Biocover 2
The average odour concentration in the emitted gas from biocover 2 was 660 OU m-3, with a
minimum concentration of 30 OU m-3 and a maximum concentration of 3 100 OU m-3. Odour
concentrations presented skewed behavior, and the standard deviation was bigger than the average (STD=910 OU m-3) for n=10 observations. The 95 percent confidence interval
estimate on odour concentrations from biocover 2 extended from 300 to 2 000 OU m-3. The
differences in odour concentrations between the raw and emitted biogas resulted in removal efficiencies of close to 100% for all the sampling dates for 2011 and 2012 (Figure 5b).
During the same period of odour monitoring, the average TRS concentration in the emitted gas was 30 ppb, while concentrations ranged from 2 to 170 ppb (STD=50 ppb, n=16, Table 2). The 95 percent confidence interval estimate on TRS concentrations from this biocover extended from 20 to 80 ppb. TRS removal efficiencies of 98.2 to 100% were obtained for biocover 2.
The biogas loading supplied to biocover 2 ranged from 3.6 to 7.9 mlbiogas m-2 s-1 during the
2011 and 2012 sampling campaigns. The air temperature during collection of the odour samples varied from 6.8 to 24.8 °C, whereas at a depth of 0.10 m it varied from 25.0 to 39.5 °C. The Sr values varied between 37 and 94% at several depths of biocover 2 (Table 3).
20 The Sr value of 94% can be discarded as an outlier. In fact, Sr values calculated at other depths
in this same profile and in other profiles within biocover 2 led to values between 44 and 77%.
The highest odour concentration obtained for biocover 2 (3 100 OU m-3, on Aug. 23, 2012)
was influenced, among other factors, by a scheduled increase in biogas loading (from 3.6 to 5.0 mlbiogas m-2 s-1), combined with dryer conditions within the soil. The two combined led to
an increase in biogas flux. The Sr values during this period varied from 39 to 71% within
biocover 2, and no precipitation accumulated in the 48 hours preceding gas collection.
Odour and TRS concentrations were lower in biocover 2 in comparison to those in biocover 1B (Table 2), in part due to the thicker substrate layer and smaller pore sizes in biocover 2, which resulted in greater biogas residence time. In addition, the material in biocover 2 has a greater organic matter content, i.e. 20% go.m./gdry soil (Table 1). The organic matter content (i.e.
nutrient input) boosts the development of the ubiquitous microorganisms that can oxidize odour compounds (not identified within the context of this study). During the monitoring period, it can be hypothesized that these microorganisms were already acclimated and active within the soil of the field plots, given the fact that the plots started being exposed to biogas one month prior to odour and TRS sampling.
3.4 Field columns 2 and 4
The average odour concentration in the emitted gas from FC 2 was 30 OU m-3, with
concentrations ranging from nil (e.g. on Sept. 6, 2012, Figure 5c) to a value of 80 OU m-3. The
21 confidence interval estimate on odour concentrations from the FC 2 extended from 0 to 70 OU m-3. The results of the TRS analyses averaged 15 ppb, while concentrations ranged from 3 to
40 ppb (STD=20 ppb, Table 2).
For FC 4, the average odour concentration in the emitted gas was 30 OU m-3, with
concentrations ranging from 20 to 40 OU m-3 (Figure 5d). The standard deviation obtained
was the lowest (8 OU m-3) in comparison to the other field plots. The 95 percent confidence
interval estimate on odour concentrations from FC 4 extended from 20 to 40 OU m-3.
Actually, the odour concentrations measured at FC 2 and FC 4 were very similar to the field blanks. The average TRS concentration in the emitted gas from FC 4 was 50 ppb, while concentrations ranged from 3 to 190 ppb (STD=60 ppb and n=9). The 95 percent confidence interval estimate on TRS concentrations from FC 4 extended from 20 to 200 ppb (Table 2).
The large differences in odour concentrations between the raw and emitted gas for FC 2 and FC 4 resulted in removal efficiencies of virtually 100% for all the sampling dates. The removal efficiencies of TRS varied from 95 to 100%. The low odour concentrations in the emitted gas were mainly influenced by low biogas loadings, which varied from 2.1 to 6.4 mlbiogas m-2 s-1, and by the odour character of the substrates forming of FC 2 and FC 4, as
discussed later. The air temperature fluctuated between 6.8 and 22.1 °C during sampling. At a depth of 0.10 m, temperatures in FC 2 fluctuated between 8.0 and 24.9 °C, while for FC 4 they fluctuated between 8.6 and 28.0 °C for the 5 sampling dates of 2012. Finally, the degree of water saturation within the substrate of the two field columns remained well below 85%, with the exception of one peak at 94% registered after a long period of rainfall (Table 3).
22 3.5 Odour concentration values and precipitations
The database presented herein indicated that a trend existed toward lower odour concentrations caused by higher precipitations. The relationship between the 48-hour accumulated precipitations and odour concentrations is shown in Figure 6. For biocover 2, FC 2 and FC 4, only the sampling dates with very similar loading values (between 6.4 and 7.2 mlbiogas m-2 s-1) were retained for this analysis. In the case of biocover 1B, all sampling dates
were considered since this biocover was not designed to allow monitoring of the loading rate. It is important to note that no biogas leakage (or hotspot) was detected at the surface of the field plots throughout the sampling period, which could affect the results of odour
concentrations and this analysis. Indeed, according to the results of periodical surface scans, CH4 concentrations remained lower than 50 ppm for biocover 2, FC 2 and FC 4. For biocover
1B, higher – although relatively uniform – values of up to 300 ppm were obtained.
Figure 6: Accumulated precipitation and odour concentrations.
For example, for biocover 2 on Sept. 2, 2011, no precipitation accumulated in the 48 hours prior to gas collection, and the odour concentration was equal to 510 OU m-3 (Figure 5b). One
week later (on Sept. 9), the 48-hour accumulated precipitation was 6.0 mm and the odour concentration decreased to a value of 220 OU m-3. On Sept. 15, 2011, the 48-hour
accumulated precipitation reached the highest value of all sampling dates at 35.4 mm (Figure 6), with Sr reaching 92% at a depth of 0.45 m (indicating a probable occurrence of occluded
air). The odour concentration therefore decreased to 30 OU m-3, the lowest odour
23 dates mentioned above (7.2 mlbiogas m-2 s-1). An increase in soil moisture, i.e. the amount of
interstitial water, can increase the reactivity and retention (e.g. absorption) of some
hydrophilic odorous compounds such as hydrogen sulfide, reducing odour concentrations in the emitted gas (Ducom et al., 2009; He et al., 2011). Precipitation had a similar effect on odour concentrations for biocover 1B, and FC 2 and FC 4 (Figure 6).
The influence of precipitation was also observed for FC 2 and FC 4. For FC 2, on Sept. 20, 2012, the 48-hour accumulated precipitation was 23.2 mm and the odour concentration was equal to 20 OU m-3. On Oct. 9, 2012, the 48-hour accumulated precipitation was lower (18.4
mm) and the odour concentration increased to 80 OU m-3. For FC 4 – and the same dates – the
odour concentration was equal to 30 OU m-3 and 40 OU m-3, respectively (Figure 6).
3.6 Background Odour and Odour Character
The difference in odour concentrations in the emitted gases from the four field plots can also be attributed to the background odour, i.e. the odour from the biocover substrates (in OU m-3)
prior to exposing them to biogas. In this study, a consistent evaluation of background odour of the substrates could not be carried out because they were already in contact with raw biogas when this work was started. However, it is speculated that the background odour from biocover 2 was higher than those of the other field plots. Some panelists described the odour character (i.e. their perception of how the sample smelled like) of the biocover 2 samples as being "musty and earthy", whereas the soils of FC 2 and FC 4 were associated with moist sand, with a lower intensity (less unpleasant) than the soil of biocover 2. Moreover, the odour character of the overall emitted gases was very different from that of the raw biogas, the latter
24 being associated with rotten matter. This evaluation of odour character is indicative and without a scientific value, because to date there is no scientifically accepted method to assess odour character using odour descriptors. However, solely considering odour concentrations for their absolute values in OU m-3, one may underestimate the actual odour impact, since OU
25 4. Conclusions
The present study documented the abatement of biogas odour and TRS concentrations in four experimental biocovers under actual field conditions at the Saint-Nicéphore landfill during a four-year monitoring campaign. Removal efficiencies were calculated by the difference in odour and TRS concentrations between raw biogas and emitted gas at the surface of the field plots.
Odour concentrations in raw biogas ranged from 640 000 to 4 000 000 OU m-3 (average =
2 100 000 OU m-3), and were 2 to 5 orders of magnitude higher than those in emitted gases.
TRS concentrations in raw biogas averaged 21 000 ppb, and varied from 1 300 to
130 000 ppb, a range comparable to that found in other studies. As a consequence, odour and TRS removal efficiencies of close to 100% were obtained for all observations.
In the case of FC 2 and FC 4, odour concentration values were very similar to the field blanks. Biocover 1B had higher odour and TRS concentrations in emitted gas in comparison to the other field plots mainly due to the fact that this biocover was constructed directly on the waste mass (high biogas loadings could reach the biocover), and was constructed with a thinner substrate layer.
The present study also documented the influence of water infiltration (due to rainfall) on odour concentrations, with lower odour values obtained when the 48-hour accumulated precipitation prior to sampling was higher.
26 The difference in odour concentrations in the emitted gas from the four field plots can also be influenced by the odour character. Biocover 2 samples presented a musty and earthy character, whereas the soils of FC 2 and FC 4 could be associated with moist sand, with a lower intensity (less unpleasant). In addition, the odour character of the overall emitted gases was very
different from that of the raw biogas. Regardless of which configuration was tested, odour and TRS removal efficiencies were very high (>95%). As a result, it is not possible to identify the possible causes that would significantly differentiate the response of one plot compared to another.
Acknowledgements
This study was supported by a Cooperative Research and Development Grant from NSERC and Waste Management (grant # CRD 379885–08). The invaluable help of Jean-Guy Lemelin, technician, must be acknowledged. We also are grateful to the personnel of Consumaj Inc. (Saint-Hyacinthe, Quebec, Canada) and Dairy and Swine Research and Development Center/ Agriculture and Agri-Food Canada (Sherbrooke, Québec, Canada).
27 References
ADEME (2008). Pollutions offactives, ADEME, Paris, 389 p.
AFNOR (2003). EN 13725: Détermination de la concentration d'une odeur par olfactométrie dynamique, Association Française de Normalisation p.
Beghi, S. and Guillot, J.-M. (2008). Use of poly(ethylene terephtalate) film bag to sample and remove humidity from atmosphere containing volatile organic compounds. Journal of
Chromatography A, 1183(1–2), 1-5.
Burnotte, F.,Cabral, A.R. and Lefebvre, G. (2005). A Simple Field Method to Qualify the State of Saturation in Capillary Barriers. Geotechnical Testing Journal, 28(6), 1-5. Cabral, A.R.,Moreira, J.F.V. and Jugnia, L.B. (2010a). Biocover performance of landfill
methane oxidation: Experimental results. Journal of Environmental Engineering, 136(8), 785-793.
Cabral, A.R.,Capanema, M.A.,Gebert, J.,Moreira, J.F. and Jugnia, L.B. (2010b). Quantifying microbial methane oxidation efficiencies in two experimental landfill biocovers using stable isotopes. Water, Air, and Soil Pollution, 209, 157-172.
Capanema, M.A. and Cabral, A.R. (2012). Evaluating Methane Oxidation Efficiencies in Experimental Landfill Biocovers by Mass Balance and Carbon Stable Isotopes. Water
Air and Soil Pollution, 223(9), 5623-5635.
Capelli, L.,Sironi, S.,Del Rosso, R.,Centola, P. and Il Grande, M. (2008). A comparative and critical evaluation of odour assessment methods on a landfill site. Atmospheric
Environment, 42(30), 7050-7058.
Chan, G.Y.S.,Wong, M.H. and Whitton, B.A. (1991). Effects of Landfill Gas on Subtropical Woody Plants. Environmental Management-Springer-Verlag, 15(3), 411-411.
Cooper, C.D. and Alley, F.C. (2002). Air Pollution Control - A Design Approach. Waveland Press, Inc., Long Grove, Illinois.
Delhomenie, M.-C. and Heitz, M. (2005). Biofiltration of air: A review. Critical Reviews in
Biotechnology, 25(1-2), 53-72.
Ducom, G.,Radu-Tirnoveanu, D.,Pascual, C.,Benadda, B. and Germain, P. (2009). Biogas - Municipal solid waste incinerator bottom ash interactions: Sulphur compounds removal. Journal of Hazardous Materials, 166(2-3), 1102-1108.
El-Fadel, M.,Findikakis, A.N. and Leckie, J.O. (1997). Environmental Impacts of Solid Waste Landfilling. Journal of Environmental Management, 50(1), 1-1.
Gebert, J. and Groengroeft, A. (2006). Performance of a passively vented field-scale biofilter for the microbial oxidation of landfill methane. Waste Management, 26(4), 399-407. He, R.,Xia, F.-F.,Wang, J.,Pan, C.-L. and Fang, C.-R. (2011). Characterization of adsorption
removal of hydrogen sulfide by waste biocover soil, an alternative landfill cover.
Journal of Hazardous Materials, 186(1), 773-778.
Huber-Humer, M.,Gebert, J. and Hilger, H. (2008). Biotic systems to mitigate landfill methane emissions. Waste Management & Research, 26(1), 33-46.
Hurst, C.,Longhurst, P.,Pollard, S.,Smith, R.,Jefferson, B. and Gronow, J. (2005). Assessment of municipal waste compost as a daily cover material for odour control at landfill sites.
Environmental Pollution, 135(1), 171-177.
IPCC (2007). Climate change 2007: Mitigation. Contr. Working Group III to the 4th Assess
28 United Kingdom and New York, NY, USA.,
http://www.ipcc.ch/ipccreports/ar4-wg3.htm.
Iranpour, R.,Cox, H.H.J.,Deshusses, M.A. and Schroeder, E.D. (2005). Literature review of air pollution control biofilters and biotrickling filters for odor and volatile organic
compound removal. Environmental Progress, 24(3), 254-267.
Kennes, C. and Thalasso, F. (1998). Waste gas biotreatment technology. Journal of Chemical
Technology and Biotechnology, 72(4), 303-319.
Kim, K.-H. (2006a). Emissions of reduced sulfur compounds (RSC) as a landfill gas (LFG): A comparative study of young and old landfill facilities. Atmospheric Environment, 40(34), 6567-6578.
Kim, K.-H. (2006b). A study of sorptive loss patterns for reduced sulfur compound (RSC) in the use of the bag sampling method. Environmental Monitoring and Assessment, 123(1), 259-269.
Kim, K.-H. (2010). Experimental demonstration of masking phenomenon between competing odorants via an air dilution sensory test. Sensors, 10(8), 7287-7302.
Kim, K.-H. (2011). The averaging effect of odorant mixing via air dilution sensory test: A case study on reduced sulfur compounds. Sensors, 11(2), 1405-1417.
Kim, K.-H.,Kim, M.Y. and Lee, G. (2001). The soil-air exchange characteristics of total gaseous mercury from a large scale municipal landfill area. Atmospheric Environment 35(20), 475-493.
Kim, K.-H.,Choi, Y.,Jeon, E. and Sunwoo, Y. (2005). Characterization of malodorous sulfur compounds in landfill gas. Atmospheric Environment, 39(6), 1103-1112.
Lee, S.,Xu, Q.,Booth, M.,Townsend, T.G.,Chadik, P. and Bitton, G. (2006). Reduced sulfur compounds in gas from construction and demolition debris landfills. Waste
Management, 26(5), 526-533.
Lombardi, L.,Carnevale, E. and Corti, A. (2006). Greenhouse effect reduction and energy recovery from waste landfill. Energy, 31(15), 3208-3219.
Luo, J. and Lindsey, S. (2006). The use of pine bark and natural zeolite as biofilter media to remove animal rendering process odours. Bioresource Technology, 97(13), 1461-1469. Manfredi, S.,Niskanen, A. and Christensen, T.H. (2009). Environmental assessment of gas
management options at the Old Ämmässuo landfill (Finland) by means of LCA-modeling (EASEWASTE). Waste Management, 29(5), 1588-1594.
MDDEP (2006). Règlement sur l'enfouissement et l'incinération des matières résiduelles (c. Q-2, r. 19). Quebec, Canada.
Micone, P.G. and Guy, C. (2007). Odour quantification by a sensor array: An application to landfill gas odours from two different municipal waste treatment works. Sensors and
Actuators, B: Chemical, 120(2), 628-637.
Nielsen, A.T. and Jonsson, S. (2002). Quantification of volatile sulfur compounds in complex gaseous matrices by solid-phase microextraction, Journal of Chromatography A 1-2, Elsevier, Vol.963, 57-64.
Roncato, C.D.L. and Cabral, A.R. (2012). Evaluation of methane oxidation efficiency of two biocovers: field and laboratory results. J. Env. Eng., 138(2), 164-173.
Scheutz, C.,Bogner, J.,Chanton, J.P.,Blake, D.,Morcet, M.,Aran, C. and Kjeldsen, P. (2008). Atmospheric emissions and attenuation of non-methane organic compounds in cover soils at a French landfill. Waste Management, 28(10), 1892-1908.
29 Scheutz, C.,Kjeldsen, P.,Bogner, J.E.,De Visscher, A.,Gebert, J.,Hilger, H.A.,Huber-Humer,
M. and Spokas, K. (2009). Microbial methane oxidation processes and technologies for mitigation of landfill gas emissions. Waste Management and Research, 27(5), 409-455. Sironi, S.,Capelli, L.,Centola, P.,Del Rosso, R. and Il Grande, M. (2005). Odour emission
factors for assessment and prediction of Italian MSW landfills odour impact.
Atmospheric Environment, 39(29), 5387-5394.
Solan, P.J.,Dodd, V.A. and Curran, T.P. (2010). Evaluation of the odour reduction potential of alternative cover materials at a commercial landfill. Bioresource Technology, 101(4), 1115-1119.
Spokas, K.,Bogner, J.,Chanton, J.P.,Morcet, M.,Aran, C.,Graff, C.,Golvan, Y.M.-L. and Hebe, I. (2006). Methane mass balance at three landfill sites: What is the efficiency of
capture by gas collection systems? Waste Management, 26(5), 516-525.
Stern, J.C.,Chanton, J.,Abichou, T.,Powelson, D.,Yuan, L.,Escoriza, S. and Bogner, J. (2007). Use of a biologically active cover to reduce landfill methane emissions and enhance methane oxidation. Waste Management, 27(9), 1248-1258.
USEPA (2008). Frequently Asked Questions About Landfill Gas and How It Affects Public Health, Safety, and the Environment, United States Environmental Protection Agency p.
Zou, S.C.,Lee, S.C.,Chan, C.Y.,Ho, K.F.,Wang, X.M.,Chan, L.Y. and Zhang, Z.X. (2003). Characterization of ambient volatile organic compounds at a landfill site in
30 List of Tables
Table 1: Characteristics of the field plot substrates.
Table 2: Statistical summary of odour and total reduced sulfur data.
Table 3: Biogas loading and meteorological conditions for the odour sampling dates.
List of Figures
Figure 1: Profile of the configuration and instrumentation of biocover 1B. Figure 2: Profile of the configuration and instrumentation of biocover 2. Figure 3: Configuration and instrumentation of the FC 2 and FC 4.
Figure 4: TRS concentrations in the raw biogas during the sampling period. Figure 5 : Odour concentrations and removal efficiencies of the four field plots. Figure 6: Accumulated precipitation and odour concentrations.
31 Table 1: Characteristics of the field plot substrates.
Field plot Substrate Thickness (m)
Organic matter content (% go.m./gdry soil)
Density (kg m-3)
Total porosity (%)
Biocover 1B Mixture of
sand-compost and gravel 0.30 7.2 1 500 48
Biocover 2 Mixture of
sand-compost 0.80 20.0 700 64
Field column 2 Top soil 0.15 5.7 1 209 52
Sand 0.30 0.8 1 611 41
Field column 4
Mixture of top soil
and compost 0.05 9.4 n.d.
a n.d.a
Top soil 0.10 6.0 1 285 52
Sand 0.30 0.7 1 526 41
32 Table 2: Statistical summary of odour and total reduced sulfur data.
Field Plot Parameter n Average STD Minimum Maximum 95% confidence interval Biocover 1B Odoura 12 2 200 1 100 880 4 700 1 400 - 2 900 TRS 11 90 110 4 290 45 - 300 Biocover 2 Odour 10 660 910 30 3 100 300 - 2 000 TRS 16 30 50 2 170 20 - 80 Field column 2 Odour 5 30 30 0 80 0 - 70 TRS 4 15 20 3 40 n.d.b Field column 4 Odour 5 30 8 20 40 20 - 40 TRS 9 50 60 3 190 20 - 200 Raw biogas Odour 22 2 100 000 950 000 640 000 4 000 000 1 700 000 - 2 500 000 TRS 22 21 000 29 000 1 300 130 000 13 000 - 39 000
a Odour in OU m-3 and TRS in ppb of eq. SO2
33 Table 3: Biogas loading and meteorological conditions for the odour sampling dates.
Field plot Sampling dates
Biogas loading 48-h. accumulated precipitation (mm) Temperature (°C) (LPM) (mlbiogas m-2 s-1) Surface 0.10 m Biocover 1B 08-28-09
Biogas loading cannot be monitored. 0.0 12.2 25.0 09-17-09 0.0 10.8 20.7 10-30-09 0.0 7.1 5.7 07-16-10 0.0 25.5 28.3 08-20-10 0.2 17.8 26.5 08-27-10 1.0 16.3 27.1 09-03-10 4.0 24.2 36.4 07-06-11 4.8 20.5 30.5 07-15-11 2.2 23.8 33.1 07-21-11 0.0 25.4 40.4 08-05-11 0.4 24.6 30.4 08-10-11 17.6 21.9 27.9 Biocover 2 08-18-11 8 5.8 8.0 24.8 39.5 09-02-11 10 7.2 0.0 23.9 37.0 09-09-11 10 7.2 6.0 21.2 27.0 09-15-11 10 7.2 35.4 10.3 25.5 09-22-11 11 7.9 3.8 19.6 25.0 07-26-12 5 3.6 12.6 21.6 36.4 08-23-12 7 5.0 0.0 21.9 30.7 09-06-12 7 5.0 3.8 22.1 31.9 09-20-12 7 5.0 23.2 13.3 31.2 10-09-12 7 5.0 18.4 6.8 27.6 Field column 2 07-26-12 0.10 2.1 12.6 21.6 24.2 08-23-12 0.21 4.6 0.0 21.9 24.9 09-06-12 0.26 5.7 3.8 22.1 24.1 09-20-12 0.30 6.4 23.2 13.3 13.7 10-09-12 0.30 6.4 18.4 6.8 8.0 Field column 4 07-26-12 0.10 2.1 12.6 21.6 22.6 08-23-12 0.21 4.6 0.0 21.9 28.0 09-06-12 0.26 5.7 3.8 22.1 23.0 09-20-12 0.30 6.4 23.2 13.3 13.3 10-09-12 0.30 6.4 18.4 6.8 8.6
34 Figure 1: Profile of the configuration and instrumentation of biocover 1B.
35 Figure 2: Profile of the configuration and instrumentation of biocover 2.
36 Figure 3: Configuration and instrumentation of the FC 2 and FC 4.
37 Figure 4: TRS concentrations in the raw biogas during the sampling period.
38
(a) (b)
(c) (d)
39 Figure 6: Accumulated precipitation and odour concentrations.