Université de Liège
Faculté des Sciences
Département des Sciences et Gestion de l’Environnement
Using remote sensing (optical and radar) and modeling to support
the irrigation management of cereals in a semi-arid region: a case
study of the Tadla irrigated perimeter in Morocco
Benabdelouahab Tarik
Thèse présentée en vue de l’obtention du grade de Docteur en Sciences Décembre 2015
Composition du jury :
Président : Dr. Christian Barbier (CSL)
Promoteur : Pr. Bernard Tychon (ULg)
Co-promoteur : Dr. Riad Balaghi (INRA-Maroc)
Lecteurs : Pr. Pierre Defourny (UCL)
Dr. Dominique Derauw (CSL) Pr. Dirk Raes (KU Leuven) Dr. Joost Wellens (ULg)
Années académique 2015-2016
i
For my parents and my wife who keep me walking
Thanks for your great support and continuous care
ii
Acknowledgment
The completion of this thesis would have not been possible without their precious contributions and support throughout or during my doctoral study in the University of Liège. I am very grateful to all of them. First of all, I would like to express my sincerest thanks and appreciation to my supervisor Professor Dr. Bernard Tychon for his supervision and valuable guidance during the research period. His sincere technical advice and moral support allowed me to complete this work. I am thankful to Dr. Riad Balaghi, from INRA, who motivated me to undertake this Ph.D. study, and for his advice and suggestions and for spending his valuable time on the evaluation of this study. Also, special thanks to Dr. Christian Barbier for spontaneously accepting to promote my study. I learned a lot from his style of supervision and I really benefited from his knowledge and long experience in SAR analysis. I am very grateful to Dr. Dominique Derauw for his support and encouragement and for his professional suggestions and, rich knowledge and experience in the SAR analysis have had a great contribution to this thesis. Dominique, I have really appreciated your friendship. My gratitude also goes to Professor Dr. Mohamed Badraoui for his support and encouragement.
I would like to express my sincere gratitude to all members of jury to accept to evaluate this work.
I am thankful to the University of Liège and the National Institute of Agronomic Research (INRA) for their logistic support during this work. Sincere gratitude goes to Noury Hassan, Hamid Riani, Jaafar, Hassan Gradess and Lahssen Aarab, Adil Assous and Abdelatif Assous, without their assistance it would not have been possible for me to carry out the field work.
Very keenest thanks extended to my PhD colleagues, staff members and my friends, with whom I shared very important moments during these
iii
years, Pr, Hassan Mrabet, Dr. Moussa Eljaroudi, Dr. Joost Wellens, Dr. Djaby Bakary, Dr. Badr Benjelloun, Dr. Rachid Hadria, Abdoul Aziz Diouf, Marie Lang, Catherine Hyemen, Abdoul Hamid Sallah, Dr. Farid Traore, Dr. Julien Minet, Antoine Denis, Claire Simonis, Dr. Louis Amani, Pr. Adil Salhi, Hamza Iaaich, Pr. Ibrahim Elboukari and Françoise Dasnoy, for their support when it was most need. Many thanks for the good company, moral support and friendship.
I am thankful to the Belgian Technical cooperation (CTB) and National Institute of Agronomic Research (INRA) for their financial support for the study. Thanks extended to the ISIS program and ESA for their valuable financial and technical support for images acquisition.
I would like to express my honest and sincere thankfulness to my parents, my sister and my father in law for their spiritual support and blessing. Last but not least, my wife Dr. Hayat Lionboui, and kids Alae and Ahmed, I reserve offer all my thanks to them for their unlimited support and endless patience that encouraged and gained me strength to complete the study.
iv
Summary
Irrigated agriculture is an important strategic sector in Morocco, it accounts for about 45%, on average, of the agricultural Gross Domestic Product, contributing thus to food security and employment. It occupies 15% (about 1.5 million ha) of the total cultivated area in the country. Irrigation scheme managers need to ensure that water is optimally used in the irrigated perimeters and that water shortages are avoided. For large areas under irrigation, this can be achieved through water monitoring at plot level using modeling and satellite-based methodologies. The main objective of this research was to assess the use of optical and radar remote sensing and of crop modeling in the irrigation monitoring and management of wheat in the irrigated perimeter of Tadla. The potential of spectral indices derived from SPOT-5 images was explored for comparing, quantifying and mapping surface water content changes at regional and local levels. Indices were computed using the reflectance in red, near infrared and shortwave infrared bands. Our findings show that the normalized difference water index (NDWIRog) could be used to estimate and map the surface water content of wheat plots, from bare soil to fully covered soil. Backscatter threshold values derived from SAR images were used to detect irrigation water supplies in wheat plots and the optimal acquisition frequency of SAR images was determined in order to ensure continuous monitoring. A field crop model (AquaCrop) was adjusted to simulate durum wheat yields and the temporal evolution of soil moisture status in order to manage and schedule irrigation water supplies and assess their impact on yield. Currently, the approaches described in this paper are being applied independently. This research was intended, therefore, to provide tools to help policy-makers and
v
stakeholders improve irrigation monitoring and mitigate wheat water stress at the field and irrigation perimeter levels in semi-arid areas.
Keywords: irrigation management, spectral index, wheat, backscattering,
vi
Résumé
L'agriculture irriguée est un secteur stratégique au niveau des régions semi-arides et l'un des principaux contributeurs à la sécurité alimentaire et à l’emploi. Elle occupe 15% de la superficie totale cultivée au Maroc (environ 1,5 millions d'hectares), et contribue à hauteur de 45% en moyenne de la valeur ajoutée en agriculture. Actuellement, les gestionnaires de périmètres veillent à ce que l’utilisation de l'eau d’irrigation soit optimale et ainsi éviter une pénurie d’eau au niveau des périmètres irrigués. Ceci peut être accompli, sur de grands périmètres, à travers un suivi de l'eau d'irrigation à l’échelle de chaque parcelle en utilisant des méthodologies basées sur le satellite et la modélisation. La présente recherche a été positionnée par rapport à cette problématique, avec un objectif principal de soutenir le suivi et la gestion de l'irrigation du blé à travers les outils de la télédétection optique et radar et de la modélisation. Le potentiel des indices spectraux a été examiné pour comparer, quantifier et cartographier le changement de teneur en eau de surface à l’échelle d’un périmètre et au sein des parcelles. Les indices spectraux, dérivés des images SPOT-5, ont été déterminés à partir de la réflectance des bandes moyenne infrarouge, proche infrarouge et rouge. D'après nos travaux de recherche, le NDWIRog est approprié pour estimer et cartographier la teneur en eau de surface des parcelles de blé. A partir des valeurs du coefficient de rétrodiffusion dérivées des images SAR, la valeur de seuil de rétrodiffusion a été établie pour détecter les apports en eau d'irrigation au niveau des parcelles de blé. En outre, la fréquence d'acquisition optimale des images SAR a été déterminée afin d'assurer une surveillance continue. Le modèle de cultures (AquaCrop) a été ajusté et testé pour simuler les rendements de blé dur aussi bien que l'évolution temporelle de l'état de l'humidité du sol. AquaCrop a été utilisé aussi pour établir une planification des apports en eau d'irrigation et estimer leur
vii
impact sur les rendements. Actuellement, les approches présentées laissent entrevoir une valorisation opérationnelle et elles sont appliquées indépendamment. Cette recherche fournit des méthodes pour la gestion et la planification afin d’aider les décideurs et les parties prenantes à améliorer la surveillance d’irrigation et atténuer le stress hydrique de la culture du blé à l’échelle de grands périmètres irrigués dans les régions semi-arides.
Keywords: irrigation, indice spectral, blé, rétrodiffusion, SAR, semi-aride,
viii
List of symbols
αi,j Local incidence angle -
θi,j Look angle corresponding to pixel ‘i,j’ - σ, Backscattering coefficient dB
°C Celsius -
CC Canopy cover %
CCo Initial canopy cover %
CCx Maximum canopy cover %
CDC Canopy decline coefficient %
CGC Canopy growth coefficient %
Da Bulk density g.cm
-3
ET Cumulative crop evapotranspiration mm
ET0 Reference evapotranspiration mm
FC Field capacity mm
G(θi,j)² The gain -
HIo Reference harvest index %
K The constant parameters (the calibration - factor)
Ks Hydraulic conductivity cm.h-1
n Number of observations -
Pef Effective rainfall mm
ix
Ri,j Slant range position -
Rg Global radiation kW/m²
R² Coefficient of determination -
Rg Global radiation -
RAW Ready available amount of water %
TWC Total water content mm
x
List of acronyms
ABHOER Agence du Bassin Hydraulique d'Oum Er Rbia AGR Arrondissement de Gestion du Réseau
ADC Agricultural Development Center
CIS CSL InSAR Suite
C.P.C.S French soil classification CSL Centre Spatial de Liège CV Coefficient of variation dB decibels
DGRID Département de la Gestion du Réseau d’irrigation et de drainage
DN Digital number
DTM Digital terrain model
ERS European Remote Sensing Satellite FAO Food and Agriculture Organization
FLAASH Fast Line-of-sight Atmospheric Analysis of Spectral Hypercubes
GDP Gross domestic product GIS Geographic information system GPS Global positioning system
GVMI the global vegetation moisture index
GY Final grain yield
xi
HI Harvest index
HRV High-Resolution Visible
INRA Institut National de la Recherche Agronomique
ISIS Incentive for the Scientific use of Images from the Spot system
JM Jeffries-Matusita K-fold CV K-fold cross-validation
KU Leuven Universiteit Leuven LAI Leaf area index
LOOCV Leave-one-out cross-validation
MAX Maximum
M Mean of the observed variable
MAPM Ministère de l’Agriculture et de la Pêche Maritime
MBE Mean bias error
MIN Minimum
MLC Maximum-likelihood classification MPDI the modified perpendicular drought index MSI Moisture stress index
MSPSI the modified shortwave infrared perpendicular water stress index
NDVI Normalized difference vegetation index NDWIRog Rogers’s normalized difference water index NDWIGao Gao’s normalized difference water index
xii
NIR Near Infrared
NPK Nitrogen, phosphorous, potassium nRMSE Normalized root mean square error
OA Overall accuracy
Oi Observed value
ONCA Office National du Conseil Agricole ORMVAT Office de Mise en Valeur Agricole de Tadla
p Probability
PA Producer’s accuracy
PDI the perpendicular drought index
R Red
RADAR RAdio Detection And Ranging RGB Red, green, blue
RMSE Root mean square error ROI Region of Interest SAR Synthetic aperture radar SGDB Spatial geo-database
Si Simulated value
SPOT Système probatoire d'observation de la Terre ou Satellite pour l'observation de la Terre
STD DEV Standard deviation
SWCI the surface water content index SWIR Shortwave Infrared
xiii
ULg Université de Liège
xiv
Table content
Acknowledgment --- ii
Summary --- iv
Résumé --- vi
List of symbols --- viii
List of acronyms --- x
Table content --- xiv
List of figures --- xviii
List of tables --- xxii
I. Chapter 1: Introduction and thesis outline --- - 1 -
1. Context --- - 2 -
2. Water resources in the study area --- - 2 -
3. Wheat production --- - 5 -
4. Thesis outline --- - 6 -
II. Chapter 2: Monitoring surface water content using visible and shortwave infrared SPOT-5 data of wheat plots in irrigated semi-arid regions --- - 9 -
1. Introduction --- - 10 -
2. Materials and methods --- - 13 -
2.1 Study area --- - 13 -
2.2 Soil data --- - 14 -
2.3 Field data --- - 15 -
2.4 Satellite images and their processing --- - 16 -
2.5 Model calibration and evaluation --- - 19 -
2.6 Mapping soil moisture --- - 20 -
xv
3.1 Soil moisture assessment at the beginning of wheat
cropping season --- - 20 -
3.2 Vegetation water content and soil moisture assessment at full vegetation cover --- - 22 -
3.3 Soil moisture assessment during the main growth stages of wheat --- - 25 -
3.4 Mapping soil moisture --- - 30 -
4. Conclusions --- - 34 -
III. Chapter 3: Detecting wheat irrigation supply using SAR data in semi-arid regions --- - 37 -
1. Introduction: --- - 38 -
2. Methodology --- - 40 -
2.1 Study Site --- - 41 -
2.2 Ground and Satellite Data --- - 43 -
2.2.1 Ground Data --- - 43 -
2.2.2 Climate Data --- - 43 -
2.2.3 Radar Data: Time Series of SAR Images --- - 44 -
2.2.4 Amplitude Images --- - 45 -
2.2.5 Backscatter Coefficient Calculation and Georeferencing - 46 - 2.3 Delimitation of the Cereal Area --- - 47 -
2.3.1. Satellite Images and Their Processing --- - 47 -
2.3.2 Supervised Classification --- - 47 -
2.4 Integration of Ground and Satellite Data --- - 48 -
3. Results and Discussion --- - 49 -
4. Conclusion --- - 57 -
IV. Chapter 4: Testing AquaCrop to simulate Durum wheat yield and schedule irrigation in semi-arid irrigated perimeter --- - 59 -
xvi
2. Materials and methods --- - 63 -
2.1 Study area --- - 63 -
2.2 Field experiments --- - 65 -
2.3 Soil data --- - 67 -
2.4 Meteorological data --- - 67 -
2.5 AquaCrop: presentation and parameterization --- - 68 -
2.6 Testing AquaCrop --- - 70 -
2.7 Model evaluation --- - 72 -
2.8 Model application --- - 73 -
3. Results and discussions --- - 73 -
3.1 Grain yield --- - 73 -
3.2 Final aboveground biomass --- - 76 -
3.3 Soil water content --- - 78 -
3.4 Model applications for irrigation management --- - 80 -
4. Conclusions and perspectives --- - 83 -
V. Conclusion and perspectives --- - 85 -
1. Conclusion --- - 86 -
2. Perspectives --- - 89 -
2.1 Use of recent advances in remote sensing data --- - 89 -
2.2 Retrieving soil moisture by satellite --- - 90 -
2.3 Soil water content monitoring at the field-scale --- - 91 -
2.4 Crop models spatialization --- - 91 -
2.5 Development of a system for crop management at large-scale fields --- - 92 -
References --- - 97 -
Appendix 1: Assessment of vegetation water content in wheat using near and shortwave infrared SPOT-5 data in an irrigated area --- - 111 -
xvii
2. Materials and methods --- - 114 -
2.1 Study area --- - 114 -
2.2 Field experiments --- - 116 -
2.3 Satellite images and their processing --- - 117 -
2.4 Supervised classification --- - 119 -
2.5 Model validation --- - 120 -
2.6 Model evaluation --- - 120 -
2.7 Mapping of vegetation water content --- - 121 -
3. Results and discussions --- - 121 -
3.1 Vegetation water content assessment at full vegetation cover --- - 121 -
3.2 Supervised classification --- - 124 -
3.3 Mapping of vegetation water content --- - 124 -
4. Conclusions --- - 127 -
xviii
List of figures
Figure 1: Location of the Tadla irrigated perimeter. ... - 4 - Figure 2: Schematic diagram illustrating the thesis outline ... - 7 - Figure 3: Location of the irrigated area (upper left inset shows a map of Morocco; the study area is indicated by diagonal lines and the experimental plots are in grey) ... - 14 - Figure 4: Schematic diagram illustrating field data and satellite image processing ... - 19 - Figure 5: Relationship between vegetation and soil moisture measurements (FC: Field capacity and PWP: Permanent wilting point). Data were acquired on 21 March 2013, 26 March 2013, 11 April 2013, 26 March 2014 and 15 April 2014 ... - 25 - Figure 6: Relationship between soil moisture (at 10 cm depth) and
the NDWIRog values derived from all the acquired images
(cropping season 2012/2013 in blue and cropping season 2013/2014 in Red: squares = bare soil; cross = covered soil; circles = mixed cover). Error bars (based on standard deviation) show the range of NDWIRog values in each sub-plot ... - 26 - Figure 7: Relationship between soil moisture (at 10 cm depth) and
the NDWIRog values derived from all the acquired images (lag
time of maximum 2 days between field measurements and dates of satellite pass) ... - 26 - Figure 8: Comparison between observed and predicted soil moisture using the k-fold CV of all acquired images ... - 27 - Figure 9: Relationship between soil moisture (at 10 cm depth) and the MSI values derived from all the acquired images: (A) covered soil; (B) mixed cover; and (C) bare soil. Error bars (based on
xix
standard deviation) show the range of MSI values in each sub-plot ... - 28 -
Figure 10: Soil moisture maps derived from the NDWIRog data: (a) 12
December 2012; (b) 2 February 2013; (c) 21 March 2013; (d) 26 March 2013; (e) 11 April 2013; and (f) codes for the experimental plots ... - 32 - Figure 11: Soil moisture maps derived from the NDWIRog data: (a) 2 December 2013; (b) 6 January 2014; (c) 1 February 2014; (d) 26 March 2014; (e) 15 April 2014; and (f) codes for the experimental plots ... - 33 - Figure 12: Location of the irrigated area (upper left inset shows a map of Morocco; the plot plan is indicated by black lines and the studied irrigated plots are multicolored according to the date the irrigation was completed) ... - 42 - Figure 13: Daily meteorological data for the study area ... - 44 - Figure 14: Schematic diagram illustrating field data and SAR data processing ... - 49 - Figure 15: Coherence image (1) between acquired images on 31/03/11 and 03/04/11 and (2) between acquired images on 31/03/11 and 12/04/11 ... - 50 - Figure 16: Coherence image between ERS 1 and ERS 2 acquired respectively on 01/01/1996 and 02/01/1996 ... - 50 - Figure 17: Potential of SAR data to detect irrigated plots (A: All plots; B: Plots ≤ 1 ha and C: Plot > 1 ha)... - 54 - Figure 18: Evolution of backscattering values with regard to the time gap between irrigation time and satellite image acquisition. No gap means that irrigation time is the date of the satellite pass and a gap indicates the difference in days between irrigation and
xx
satellite pass (negative gap: irrigated plots; positive gap: non-irrigated plots) ... - 56 - Figure 19: Location of the Tadla irrigated perimeter (upper left window represents Morocco map; in the upper right window, the experimental plots in black diamond) ... - 64 - Figure 20: Relationship between observed and simulated durum wheat grain yield using the whole datasets (Calibration) ... - 75 - Figure 21: Relationship between observed and simulated durum wheat grain yield using the LOOCV subsets (Validation) ... - 75 - Figure 22: Relationship between observed and simulated durum wheat biomass (t.ha-1) using the whole datasets ... - 77 - Figure 23: Relationship between observed and simulated durum wheat biomass using the LOOCV subsets (Validation) ... - 77 - Figure 24: Comparison between simulated and observed soil moisture measurements at 0-90 cm depth for plot E1 followed during the cropping season 2009/2010. Descendent arrows indicate irrigation water supply ... - 78 - Figure 25: Comparison between simulated and observed soil moisture measurements at 0-90 cm depth for plot E2 followed during the cropping season 2010/2011. Descendent arrows indicate irrigation water supply ... - 79 - Figure 26: Workflow of an integrated system for irrigation management and crop growth monitoring ... - 93 - Figure 27: Location of the Tadla irrigated perimeter (upper left window represents Morocco map; in the lower right window, the study area in dashed line and the experimental plots are in blue) ... - 116 -
xxi
Figure 28: Schematic diagram illustrating field data and Satellite images processing ... - 119 - Figure 29: Relationship between observed vegetation water content and derived spectral indices ... - 122 - Figure 30: Comparison between observed and predicted vegetation water content (%) using the k-fold CV of all acquired images- 123 - Figure 31: Supervised classification map of wheat over the region of
Beni-Moussa East (2012-2013) ... - 124 -
Figure 32: Vegetation water content maps derived from NDWIGao
data (21/03/2013) ... - 126 -
Figure 33: Vegetation water content maps derived from NDWIGao
data (26/03/2013) ... - 126 -
Figure 34: Vegetation water content map derived from NDWIGao data
xxii
List of tables
Table 1: Studies and projects on the Tadla irrigated perimeter ... - 5 - Table 2: Soil physics properties in Tadla, Morocco ... - 15 - Table 3: List of acquired SPOT-5 HRV images and their characteristics
... .- 17 - Table 4: Spectral indices derived from the SPOT-5 sensor (Red, NIR and SWIR refer to the spectral reflectance bands of SPOT-5 image) ... - 18 - Table 5: Linear regression analysis of the relationship between observed soil moisture and selected spectral indices ... - 21 - Table 6: The k-fold CV of the linear regression analysis of the relationship between observed soil moisture and selected spectral indices ... - 22 - Table 7: Linear regression analysis of the relationship between observed vegetation water content and selected spectral indices ... - 23 - Table 8: The k-fold CV of the linear regression analysis of the relationship between observed vegetation water content and the spectral indices... - 23 - Table 9: SAR images selected covering the study area. ... - 45 - Table 10: List of acquired SPOT-5 HRV images and their characteristics... - 47 - Table 11: The average backscattering values for irrigated wheat plots as a function of date of completion of irrigation and date of acquired images (no gap means that irrigation time is the date of satellite pass and a gap indicates the difference in days between
xxiii
irrigation and satellite pass (negative gap: irrigated plots; positive gap: non-irrigated plots) ... - 53 - Table 12: Main management characteristics of experimental fields of durum wheat ... - 66 - Table 13: Soil physics properties in Tadla, Morocco ... - 67 - Table 14: Monthly average weather conditions over the experimental plots (3 cropping seasons, from 2009-2010 to 2011-2012) ... - 68 - Table 15: Crop parameters used for durum wheat ... - 71 - Table 16: Alternative irrigation scenarios implemented in AquaCrop for the plot E1 (Rainfall = 448,6 mm) ... - 82 - Table 17: Alternative irrigation scenarios implemented in AquaCrop for the plot E2 (Rainfall = 337 mm) ... - 82 - Table 18: Studied spectral indices derived from SPOT-5 sensor .. - 118 -
- 1 -
Introduction and
thesis outline
- 2 -
1.
Context
Irrigated areas produce more than half of all foodstuffs in the world and therefore contribute significantly to food security. This activity, however, consumes about 72% of available water resources (Geerts and Raes, 2009; Seckler et al., 1999). In Morocco, water availability is one of the main limiting factors in achieving good yields. Irrigated agriculture occupies only 15% of the cultivated area (about 1.5 million ha) in the country, but accounts for about 45% of the agricultural Gross Domestic Product and 75% of agricultural exports, depending on the season. This contribution is greater during dry seasons when production in rainfed areas is severely affected (MAPM, 2012). The challenge for stakeholders and managers in the irrigated perimeter is to increase production, control water management and rationalize irrigation. In order to save water and help farmers meet this challenge, they are given technical supervision and coaching, as well as subsidies for irrigation equipment, and legislation governing the mobilization and rational use of water resources has been enacted (Conseil Supérieur de l’Eau et du Climat, Law No. 10-95).
2.
Water resources in the study area
Created in the 1940s, the Tadla irrigated perimeter was among the first large irrigation schemes in the country. It is on a plain in central Morocco (32°23΄ N latitude; 6°31΄ W longitude; 445 m above sea level) that covers about 100,000 hectares (ha) and is characterized by a flat topography. The plain has a semi-arid climate, with about 300 mm average annual precipitation over the 1970-2010 period and a high inter-annual variation, ranging from 130 to 600 mm over the same period.
The Tadla irrigated perimeter is divided into two sub-schemes by the Oum-Er-Rbia river, which flows from the Middle-Atlas Mountains (east) to the Atlantic Ocean (west) (Figure 1).
- 3 -
The irrigation water used in the Tadla perimeter comes mainly from surface water (87.1% of the total amount of irrigation water consumed in 2009/2010). Two dams, Ahmed-Al-Hansali (capacity of 750 million m³) and Bin-El-Ouidane (1.5 billion m³), supply irrigation water to the Tadla perimeter, in addition to groundwater pumping.
The over-exploitation of groundwater has led to reduced piezometric levels (FAO, 2011). The proportion of groundwater, however, has increased in recent years due to frequent droughts. Groundwater used for agricultural purposes in the Tadla comes from Beni-Moussa and Beni Amir groundwater and the Turonian deep water table. The total amount groundwater used by the Tadla perimeter was 12.9% (120 million m3 per year) of the total amount of irrigated water used in the 2009-2010 cropping season.
The irrigation scheduling program is based on the amount of water reserves in dams at the beginning of the cropping season and the estimated need for irrigation water. In drought years, restrictions on the water allocation to the Tadla perimeter are set by the Agence du Bassin Hydraulique d'Oum Er Rbia (ABHOER), which is responsible for the assessment and management of water resources in the Oum Er Rbia watershed area.
- 4 -
Figure 1: Location of the Tadla irrigated perimeter.
The Tadla irrigated perimeter is managed by the Regional Office for Agricultural Development of Tadla (ORMVAT), a public sector institution within the Ministry of Agriculture that is responsible for organizing the distribution of the water in the perimeter to more than 27,000 farmers.
The Département de la Gestion du Réseau d’irrigation et de drainage (DGRID), which is responsible for managing the irrigation and drainage network, establishes the provisional distribution program in the irrigated perimeter, covering 100,000 ha. This program is sent to the district-level network management agency, Arrondissement de Gestion du Réseau (AGR), for implementation. The AGR receives applications from farmers for their weekly water requirements per block and, based on these applications and within the context of the provisional DGRID program, sets the water rotational turns for irrigation blocks of 25-40 ha and then releases the water.
The irrigation water is supplied via a canal system consisting of a network of main canals (212 km), primary and secondary canals (742 km) and tertiary canals (2,166 km). Distribution agents and valve guards are responsible for
- 5 -
implementing and controlling the distribution of the irrigation water. This system involves many field staff and agents at the local level, but lacks the ability to monitor and optimize control of the entire irrigated area.
Since the 1980s, several studies of the Tadla perimeter (Table 1) have been carried out by national and regional stakeholders in partnership with international institutions and development bodies. They have focused on identifying periods of likely water scarcity and improving irrigation management across the perimeter, but have not provided a spatio-temporal approach for the monitoring and control of the main production parameters. Such an approach, however, is essential for decision-making on large-scale schemes, such as Tadla. Our research sought to contribute to improving the spatio-temporal monitoring and control of irrigation in the Tadla irrigated perimeter.
Table 1: Studies and projects on the Tadla irrigated perimeter
3.
Wheat production
Wheat is the main crop in the Tadla irrigated perimeter, covering more than 36% (40,000 ha) of the total irrigated area. Despite the large amounts of irrigation water used, wheat yields remain low, with high inter-seasonal variations due to fluctuating water availability and poor management practices. The average yield in the 1994-2010 period was 32 quintals/ha, with a coefficient of variation of 9.84% (ORMVAT, 2009). Water is one of the main factors limiting wheat production in the Tadla perimeter, and good management of irrigation water on a large-scale is required in order to address this challenge.
- 6 -
The volume of irrigation water used by wheat in the 1994-2002 period in Tadla rose to 136 million m3/year, on average. This is equivalent to 18% of all irrigation water used across the irrigated perimeter (ORMVAT, 2009).
The wheat-growing cycle in the region runs from November-December to June. During this period, wheat is irrigated following traditional flood irrigation practice, from two to five times, depending on rainfall availability in the autumn and the volume of water accumulated in dams during winter and spring.
Traditional flood irrigation practice (Robta) involves compartmentalizing land into elementary basins with an average size of 50-60 m² and supplying water to these basins, one by one. This technique results in irrigation efficiency losses of about 50% (ORMVAT, 2002).
The spatio-temporal monitoring of wheat development, irrigation supplies and surface water content could be an interesting basis for improving irrigation scheduling and preventing water stress from adversely affecting yield (Duchemin et al., 2006).
4.
Thesis outline
The objective of the research described here was to improve irrigation management and plot surface water content monitoring for wheat crop throughout a large perimeter, based on remote sensing and crop modeling in the semi-arid area of Morocco (figure 2). The research was aimed primarily at decision-makers and managers of large-scale irrigated perimeters. The development and application of decision-support tools are presented. The chapters (2-4) are based on scientific papers published in, or submitted to, peer-reviewed international journals.
- 7 -
Figure 2: Schematic diagram illustrating the thesis outline
Chapter 2 aims to evaluate the potential of two spectral indices, Roger’s normalized difference water index (NDWIRog) and the moisture stress index (MSI), to assess surface water content in wheat fields in order to detect irrigation water supplies in the irrigated perimeter. The indices were computed using red, near infrared (NIR) and shortwave infrared (SWIR) spectral bands from SPOT-5 high-resolution visible (HRV) images. These satellite images covered the main growth stages of wheat.
These indices were compared with corresponding in situ measurements of soil moisture and vegetation water content in 30 wheat fields in the Tadla irrigated perimeter in the 2012-2013 and 2013-2014 cropping seasons.
The results obtained were validated using a k-fold cross validation method. NDWIRog was identified as an operative index for monitoring irrigation and estimating and mapping surface water content changes at the main crop growth stages.
Chapter 3 assesses the potential of synthetic aperture radar (SAR) satellite images for detecting irrigation supplies and analyzes the radar backscattering coefficient as a function of the changes of wheat water content and soil moisture
Chapter 2 : Optical
remote sensing data (SPOT-5 high-resolution visible
images)
Chapter 3: Radar
remote sensing data (SAR satellite images) Chapter 4: Crop simulation model (AquaCrop). Chapter 5: Synthesis of
perspectives to develop a system integrating satellite data and crop
modeling.
- 8 -
throughout the cropping season in irrigated semi-arid areas. The analysis was performed using SAR images acquired between 31 March and 12 April 2011 and the irrigation water invoices database (invoices submitted to farmers for irrigated water use). A reference level of 1 dB was set for differentiating between irrigated (recently, up to 2 days) and non-irrigated plots. SAR backscattering signal analysis showed the potential for improving irrigation monitoring and detecting irrigation supplies at the field and perimeter levels.
Chapter 4 addresses the management of irrigation water in plots throughout the cropping season using a soil-plant-atmosphere model (i.e., the AquaCrop model developed by the Land and Water Division of Food and Agriculture Organization of the United Nations, FAO). The experiment was conducted on 15 fields between 2009 and 2012. AquaCrop v. 4.0 was adjusted and tested for durum wheat plots under semi-arid conditions. Grain yield, biomass and the evolution of soil water content (0-90 cm layer) in an irrigated perimeter were simulated. Chapter 4 also describes the analysis of irrigation scenarios used to test the ability of the model to schedule irrigation water and identify the relationship between grain yield and irrigation water scheduling in order to improve grain yield and increase water-use efficiency.
- 9 -
Monitoring surface water content using visible and shortwave infrared SPOT-5 data of wheat plots in irrigated semi-arid regions 1
II. Chapter 2: Monitoring surface water content using visible
and shortwave infrared SPOT-5 data of wheat plots in
irrigated semi-arid regions
1
Adapted from: Benabdelouahab T, Balaghi R, Hadria R, Lionboui H, Minet J,
Tychon B. 2015. Monitoring surface water content using visible and short-wave infrared SPOT-5 data of wheat plots in irrigated semi-arid regions. International
- 10 -
Irrigated agriculture is an important component of the agricultural sector, in arid and semi-arid regions. Given the large spatial coverage of irrigated areas, operational tools based on satellite remote sensing can contribute to optimal irrigation management. The objective of this study consisted in detecting irrigation supplies and in estimating surface water content of cereal fields using two spectral indices, the normalized difference water index (NDWI) and the moisture stress index (MSI) derived from SPOT-5 high-resolution visible (HRV) data. , These two indices were correlated to observed soil moisture and vegetation water content in 30 wheat fields located in an irrigated area of Morocco, for two consecutive seasons, in 2012-2013 and 2013-2014. NDWIRog and MSI were highly correlated with in situ measurements at both the beginning of the growing season (sowing) and at full vegetation cover (grain filling). From sowing to grain filling, the best correlation (R²=0.86; p<0.01) was found for the relationship between NDWIRog values and observed soil moisture values. NDWIRog can be used operationally for monitoring irrigation, such as detecting irrigation supplies and mitigating wheat water stress at field and regional levels in semi-arid areas.
1.
Introduction
Half of the world’s food supply comes from irrigated areas that use about 72% of the available water resources (Geerts and Raes, 2009; Seckler et al., 1999). In Morocco, water availability is the main limiting factor for crop production, and it is becoming a national priority for the agricultural sector (Lionboui et al., 2014). This situation has led to work on developing optimum strategies for planning and managing available water resources. Cereal (wheat and barley) production is strongly linked to the amount and distribution of rainfall in rainfed areas (Balaghi et al., 2013b) and to the amount of groundwater and water stored in dams for irrigated areas. A set of irrigated areas in the country was equipped with the means to improve and secure crop production. Despite the large amounts of consumed irrigation water, wheat yields in irrigated areas remain low and fluctuate from one season to another due to fluctuating water availability and
non-- 11 non--
optimal management practices (Balaghi et al., 2010). In the current context of climate change, water scarcity and population growth, managing irrigation water has become a critical issue.
In Morocco, the Tadla irrigated area is managed by the Regional Office for Agricultural Development of Tadla (ORMVAT). The main cultivated crop in this area is wheat, covering more than 40,000 hectares (ha), which represent more than 36% of the total irrigated area (ORMVAT, 2009). ORMVAT is seeking a spatio-temporal methodology for monitoring surface water content in order to improve irrigation scheduling and preventing agricultural water stress (Er-Raki et al., 2010; Ozdogan et al., 2010). In addition, this could also be profitable for detecting uncontrolled irrigation and illegal water pumping.
Remotely sensed reflectance has been used to estimate soil and vegetation water content for various crops and to monitor water irrigation per surface unit (Ben-Gal et al., 2010; Ceccato et al., 2002a; Cheng et al., 2012; Hadria et al., 2010; Penuelas et al., 1997; Tian et al., 2001; Trombetti et al., 2008), drawing on the high temporal and spatial resolution of satellite images. Several indices based on wavelengths ranging between 400 and 2,500 nm have been developed to describe land-surface moisture conditions (Kogan, 2000). Estimation of surface water content values from remote sensing data is usually based on reflectance in the red (R; 610-680 nm), Near Infrared (NIR; 780-890 nm) and Shortwave Infrared (SWIR; 1,580-1,750 nm) regions of the spectrum (Lobell et al., 2003; Moreno et al., 2014; Muller and Décamps, 2000; Skidmore et al., 1975).
During wheat development cycle, crop water stress can be deduced from both vegetation and soil water content (Feng et al., 2013; Ghulam et al., 2007; Ning et al., 2013). Water stress indices used for crop management should therefore be based on the spectral bands that are sensitive to both soil moisture and vegetation water content.
Many indices for the simultaneous estimation of vegetation water content and soil moisture have been proposed for different land surfaces, from bare soils to
- 12 -
vegetated areas, among which are the visible and shortwave infrared drought index (VSDI) (Ning et al., 2013), the modified shortwave infrared perpendicular water stress index (MSPSI) (Feng et al., 2013), the modified perpendicular drought index (MPDI) (Ghulam et al., 2007), the normalized difference water index (NDWIRog) (Rogers and Kearney, 2004) and the moisture stress index (MSI) (Hunt Jr and Rock, 1989).
Indices specifically designed for vegetation water content monitoring have been developed using NIR and SWIR bands, including the normalized difference infrared index (NDII) (Hardisky et al., 1983), the global vegetation moisture index (GVMI) (Ceccato et al., 2002a; Ceccato et al., 2002b) and the normalized difference water index (NDWIGao) (Gao, 1996). Although this last index has been given the same name as the NDWIRog developed by Rogers and Kearney (2004), it is based on a different formula. Gao’s NDWIGao is calculated as the normalized difference of NIR and SWIR bands, whereas Rogers and Kearney (2004) use red and SWIR bands to compute the NDWIRog (Lei et al., 2009). In our study, we used the NDWIRog definition given by Rogers and Kearney (2004).
In the literature, many indices based on NIR spectral reflectance have been developed to monitor soil moisture, such as the perpendicular drought index (PDI) (Ghulam et al., 2007), the distance drought index (DDI) (Yang et al., 2008), the surface water content index (SWCI) (Zhang et al., 2008) and the surface water capacity index (SWCI) (Du et al., 2013). These indices have proved to be efficient over bare soil surfaces (Ghulam et al., 2008; Qin et al., 2008; Zhang et al., 2008).
An operational index for simultaneously measuring surface water content of bare soil, mixed bare and covered soil has become crucial for irrigation management, especially in arid and semi-arid regions. This is required, especially for large irrigated areas and throughout the cropping season, when the vegetation cover is continuously changing. An operational tool adapted to this context, and that combines simplicity and robustness still deserves to be explored.
- 13 -
The main objective of this study was to explore the potential of NDWIRog and MSI for comparing, quantifying and mapping the surface water content of wheat plots, from bare soil to completely covered soil. This index could lead to an operational tool for monitoring surface water content and managing irrigation, at least for the study area.
2.
Materials and methods
2.1 Study area
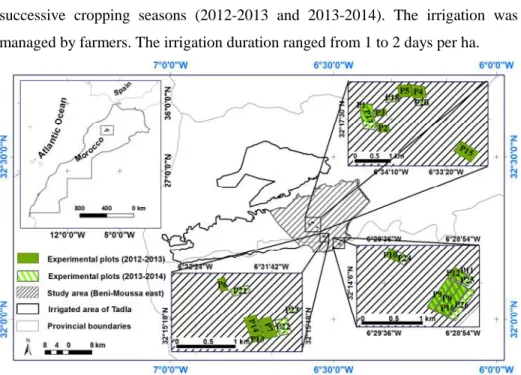
The study area is located in central Morocco (32°23΄ north ; 6°31΄ west; 445 m above sea level), within the irrigation perimeter of the Tadla region. The area is characterized by a semi-arid climate: the annual average temperature is about 19°C, with large inter-seasonal variation. The average cropping season precipitation is about 300 mm (average over the 1970-2010 period), with significant inter-annual variation ranging from 130 to 600 mm. The area covers about 100,000 (ha) and is characterized by a flat topography. The groundwater depth varies from 31 to 117 m (Bouchaou et al., 2009; Najine et al., 2006). Wheat is one of the main cultivated crops, covering 36% of the total cultivated land. As in the rest of Morocco, traditional flood irrigation is the dominant practice used in cereal plots. Generally, the wheat-growing cycle in the region starts in November and ends in June of the following calendar year, overlapping the rainy season. Wheat is irrigated from two to five times, depending on water availability in autumn and winter and on amount of stored water in dams during the rainy season.
The area is divided into several hundred irrigation plots. For this study, 30 wheat plots were selected, with size varying from 1.7 to 24.5 ha (total area 117 ha). The diversity of crop management and irrigation schedules in these plots was representative of the general agricultural practices in the area.
Figure 3 shows the location of studied area and illustrates the location of the selected plots. The plots were labeled from P1 to P26 and divided into 348
sub-- 14 sub--
plots of about 0.5 ha each. The plots P8, P9, P11 and P16 were monitored for two successive cropping seasons (2012-2013 and 2013-2014). The irrigation was managed by farmers. The irrigation duration ranged from 1 to 2 days per ha.
Figure 3:Location of the irrigated area (upper left inset shows a map of Morocco; the study area is indicated by diagonal lines and the experimental plots are in grey)
2.2 Soil data
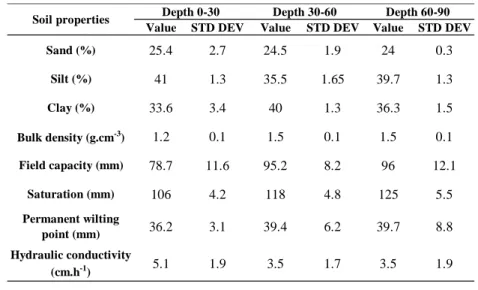
At the study area, soil physics analyses were performed from 30 soil samples (Table 2) (Benabdelouahab, 2009). These samples were collected from several sites providing coverage of the entire study area. Water content at permanent wilting point (PWP) and field capacity (FC) were measured using a pressure plate extractor. Soil reached PWP and FC when the water potential was at -1.5 MPa and -0.033 MPa, respectively (Kirkham, 2005).
On the basis of these analyses (Table 2), the soils are mainly homogeneous with fine texture which is characterized by a high water holding capacity. The proportions of clay, silt and sand, which determine together the soil textural class, present a high homogeneity, with a standard deviation of 3.40%, 2.69% and 1.27%, respectively. The bulk density value is 1.21 (g.cm-3), with a standard
- 15 -
deviation of 0.14. The small variability of the bulk density permits us to consider this parameter as constant value. This result justifies the use of the gravimetric soil moisture.
Table 2: Soil physics properties in Tadla, Morocco
2.3 Field data
The experiments were conducted during the 2012-2013 and 2013-2014 wheat cropping seasons to assess changes in soil moisture and vegetation. Dates and amounts of irrigation water supply and physiological crop data were collected.
Soil moisture was measured weekly for all 30 plots during the two cropping seasons, starting from sowing until grain filling, at 0-10 cm depth, with three random replications per plot. Soil moisture was measured using gravimetric methodology (dried in an oven at 105°C for 24 hours). Vegetation water content was also measured weekly, starting from tillering until wheat grain filling (January to May 2013). In each plot, the vegetation water content was measured in four randomly selected quadrats (i.e., an area of 0.5 * 0.5 m). From each quadrat, sub-samples were used to measure the weight of the fresh and dry above-ground biomass in order to quantify vegetation water content (dried in an oven at
Value STD DEV Value STD DEV Value STD DEV
Sand (%) 25.4 2.7 24.5 1.9 24 0.3 Silt (%) 41 1.3 35.5 1.65 39.7 1.3 Clay (%) 33.6 3.4 40 1.3 36.3 1.5 Bulk density (g.cm-3) 1.2 0.1 1.5 0.1 1.5 0.1 Field capacity (mm) 78.7 11.6 95.2 8.2 96 12.1 Saturation (mm) 106 4.2 118 4.8 125 5.5 Permanent wilting point (mm) 36.2 3.1 39.4 6.2 39.7 8.8 Hydraulic conductivity (cm.h-1) 5.1 1.9 3.5 1.7 3.5 1.9
- 16 -
65°C for 48 h). Soil and vegetation water content were quantified on a gravimetric basis (i.e., grams water/grams soil or biomass), expressed as a percentage (%). These measurements were used to establish a relationship between vegetation water content and covered soil moisture.
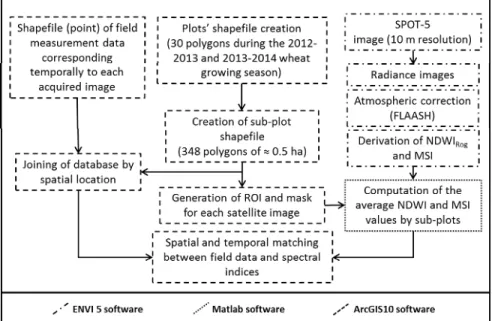
The collected field data (soil moisture and vegetation water content) were vectorized as points and the experimental plots as polygons, in a Geographical Information System. Polygons were drawn so as to remove pixels falling along plots boundaries. The experimental plots were subdivided into sub-plot units of identical size (0.5 ha) and an identifier code was assigned to each of these units. Polygons of these sub-plot units served as a way of extracting pixel images that were close and directly linked to ground measurements.
As far as possible, field data were collected in a regular and timely manner to ensure that ground measurements were acquired synchronously with satellite passes so as to obtain a good comparison between field measurements and remote sensing data. Field measurements collected within a maximum of 3 days before or after a satellite pass were used for the analysis. We also ensured that during this period (between the field observation and the image acquisition date) there was no precipitation event or irrigation water supply.
2.4 Satellite images and their processing
Ten SPOT-5 HRV satellite images were acquired between December (at wheat emergence) and April (at grain filling) for the 2012-2013 and 2013-2014 cropping seasons (Table 3). They covered temporal changes in surface water content during the main wheat growth stages, except for the final senescent stage. The processing level of the acquired images was 1B, which included radiometric and geometric corrections. Atmospheric corrections were performed from radiance images, using the Fast Line-of-sight Atmospheric Analysis of Spectral Hypercubes (FLAASH) model available in the ENVI software. FLAASH is an atmospheric correction tool that corrects the wavelengths between 400 and 2,500 nm by eliminating the effects of water vapor and aerosols in the atmosphere. This
- 17 -
model is considered to be more accurate for SPOT-5 images than other models (Guo and Zeng, 2012).
The NDVI threshold method (Momeni and Saradjian, 2007; Ning et al., 2013) was used to classify the land surface into three land cover categories (Tables 5 and 6): bare soil (beginning of cropping season) with NDVI < 0.2; partly vegetated soil (mixed cover) with 0.2 ≤ NDVI ≤ 0.5; and full vegetation cover with NDVI > 0.5.
The 12 December 2012 and 2 December 2013 images were acquired at the beginning of the growing season, when the soil was bare, whereas the 21 March 2013, 26 March 2013, 11 April 2013, 26 March 2014 and 15 April 2014 images were acquired when the soil was completely covered. The 2 February 2013, 6 January 2014 and 1 February 2014 images were acquired in the middle of the cropping season when the surface was partly covered by vegetation.
Table 3: List of acquired SPOT-5 HRV images and their characteristics
The visible spectrum (400-740 nm) is sensitive to vegetation water stress (Jensen, 2005), with a more significant reflectance change in the red band (580-680 nm). The NIR band serves as a moisture-reference band, whereas the SWIR band is used as the moisture-measuring band. Reflectance in the NIR spectrum
(740-Acquisition date Cropping season Sensor Wavelength (nm) Resolution (meters) 12 December 2012 02 February 2013 21 March 2013 26 March 2013 11 April 2013 02 December 2013 06 January 2014 01 February 2014 26 March 2014 15 April 2014 SPOT-5 HRV Green: 500-590 Red: 610-680 NIR: 780-890 SWIR:1580-1750 Red: 10 Green: 10 NIR: 10 SWIR: 20 2012/2013 2013/2014
- 18 -
1,300 nm) is most sensitive to leaf internal structure changes (Jacquemoud and Baret, 1990) and is insensitive to moisture variation (Elvidge and Lyon, 1985), except in conditions leading to leaf dehydration which therefore affects leaf structure (Girard and Girard, 2010; Jensen, 2007). Recent studies confirmed the high sensitivity of the SWIR band to moisture variation in vegetation and soil (Ceccato et al., 2001; Cheng et al., 2013; Cheng et al., 2011; Hunt Jr et al., 2011; Hunt Jr and Rock, 1989; Liu et al., 2012; Yilmaz et al., 2008a; Yilmaz et al., 2008b).
The first step of images post-processing involved computing two spectral indices, the NDWIRog (Lasaponara and Masini, 2012; Rogers and Kearney, 2004) and the MSI (Ceccato et al., 2001; Ceccato et al., 2002b; Hunt Jr and Rock, 1989) (Table 4), using the spectral reflectance in the Red, NIR and SWIR bands for each SPOT-5 HRV image.
Table 4: Spectral indices derived from the SPOT-5 sensor (Red, NIR and SWIR refer to the spectral reflectance bands of SPOT-5 image)
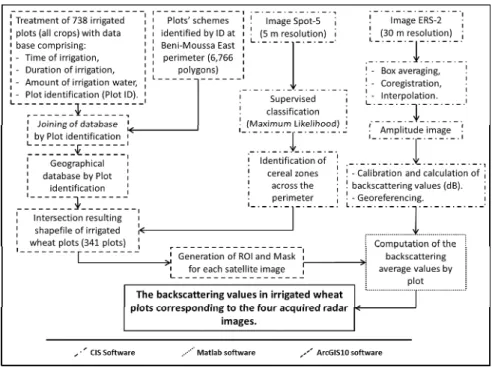
The second step involved delineating the region of interest (ROI) used as a mask of wheat sub-plots. The average values of the NDWIRog and MSI spectral indices were then computed for each corresponding sub-plot (7×7 pixels) where field measurements were conducted (Figure 4).
Indices Equation Properties References Normalised Difference Water Index (NDWI Rog) (Red – SWIR)/(Red + SWIR) Vegetation water content and soil moisture content
Rogers and Kearney, 2004; Lei, Li, and Bruce 2009; Lasaponara and Masini,
2012 Moisture Stress Index (MSI) (SWIR/NIR) Vegetation water content
Ceccato et al. 2001; Ceccato et al. 2002; Hunt Jr and
- 19 -
Figure 4: Schematic diagram illustrating field data and satellite image processing
2.5 Model calibration and evaluation
The average MSI and NDWIRog values of the sub-plots and the corresponding ground measurements were compared using linear regression analysis. The regression coefficients a and b, reported in Tables 5 and 7, stand for the slope and intercept of the regression line, respectively.
The statistics used for evaluating the regression models were: the coefficient of determination (R²), the root mean square error (RMSE) which is one of the most widely used as error assessment indices), and the normalized RMSE (nRMSE) expressed as a percentage of the RMSE divided by the mean of observed values (Richter et al., 2012):
RMSE = [∑ni=1 (Si-Oi) ²/n] 0.5
(1) nRMSE = [∑ni=1 (Si-Oi) ²/n]
0.5
×100/M (2)
where Si and Oi refer to simulated and observed values of the studied variable, respectively; n is the number of observations; and M is the mean of the observed variable.
- 20 -
nRMSE indicates the accuracy of the model and the dispersion around the mean of the observed values.
The accuracy of the regression models was evaluated using the k-fold cross validation (k-fold CV) approach (Cassel, 2007). Cross validation is a resampling method that offers a different approach to model evaluation. It uses k replicate samples of observation data, builds models with (k-1)/k of data and tests with the remaining 1/k. The random k-fold CV takes k independent samples of size N*(k-1)/k (Cassel, 2007). In our study, it involved 33.3% of the observations as the validation data, with the remaining 66.6% of the observations being the training data, with 10 repetitions (N = 10).
2.6 Mapping soil moisture
Soil moisture was mapped using relationships of the validated linear regression models between satellite indices and ground measurements. The maps display surface soil moisture at plot level for each acquired satellite image. The same approach could be used to map vegetation water content (see the Appendix 1).
3.
Results and discussion
3.1 Soil moisture assessment at the beginning of wheat cropping season
The relationship between observed soil moisture and the MSI and NDWIRog values was assessed in 47 sub-plots at the beginning of the wheat cropping season (NDVI<0.2), using images acquired on 12 December 2012 and 2 December 2013.
The reduced number of data used for this analysis is explained by the infrequent measurements collected with a lag time of maximum 3 days between field measurements and dates of satellite pass.
- 21 -
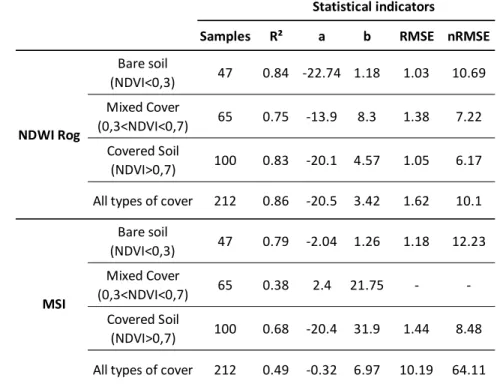
As shown in Table 5, the R² and RMSE were 0.84 (p<0.01) and 1.03% for the NDWIRog and 0.79 (p<0.01) and 1.18% for the MSI, respectively.
We compared the soil moisture values predicted using the k-fold CV method and those measured in situ (Table 6). The statistical indicators obtained from this comparison were R² = 0.81 (p<0.01) and RMSE = 1.09% for NDWIRog and R² = 0.76 (p<0.01) and RMSE = 1.24% for MSI. This comparison showed that errors were acceptable for both the MSI and NDWIRog, confirming the ability of these indices to accurately explain soil moisture variability for bare soil. Ghulam et al. (2007) reported similar results using the PDI and MPDI, with an R² of 0.56 and 0.55, respectively, over bare surfaces.
Table 5: Linear regression analysis of the relationship between observed soil moisture and selected spectral indices
Samples R² a b RMSE nRMSE
Bare soil (NDVI<0,3) 47 0.84 -22.74 1.18 1.03 10.69 Mixed Cover (0,3<NDVI<0,7) 65 0.75 -13.9 8.3 1.38 7.22 Covered Soil (NDVI>0,7) 100 0.83 -20.1 4.57 1.05 6.17 All types of cover 212 0.86 -20.5 3.42 1.62 10.1
Bare soil (NDVI<0,3) 47 0.79 -2.04 1.26 1.18 12.23 Mixed Cover (0,3<NDVI<0,7) 65 0.38 2.4 21.75 - -Covered Soil (NDVI>0,7) 100 0.68 -20.4 31.9 1.44 8.48 All types of cover 212 0.49 -0.32 6.97 10.19 64.11 NDWI Rog
MSI
- 22 -
Table 6: The k-fold CV of the linear regression analysis of the relationship between observed soil moisture and selected spectral indices
3.2 Vegetation water content and soil moisture assessment at full vegetation cover
The relationship between observed vegetation water content and MSI and NDWIRog was assessed in 62 sub-plots, when the soil was completely covered by vegetation (NDVI > 0.5). The statistical indicators obtained are presented in Table 7. The two spectral indices were strongly related to vegetation water content. The statistical indicators R² and RMSE were 0.77 (p<0.01), 2.49% for NDWIRog and 0.55 (p<0.01), 3.47% for MSI, respectively.
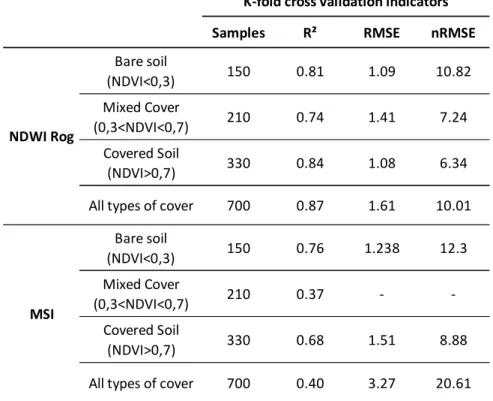
Samples R² RMSE nRMSE
Bare soil (NDVI<0,3) 150 0.81 1.09 10.82 Mixed Cover (0,3<NDVI<0,7) 210 0.74 1.41 7.24 Covered Soil (NDVI>0,7) 330 0.84 1.08 6.34
All types of cover 700 0.87 1.61 10.01
Bare soil (NDVI<0,3) 150 0.76 1.238 12.3 Mixed Cover (0,3<NDVI<0,7) 210 0.37 - -Covered Soil (NDVI>0,7) 330 0.68 1.51 8.88
All types of cover 700 0.40 3.27 20.61
MSI NDWI Rog
- 23 -
Table 7: Linear regression analysis of the relationship between observed vegetation water content and selected spectral indices
Table 8: The k-fold CV of the linear regression analysis of the relationship between observed vegetation water content and the spectral indices
In order to validate these results, we compared observed vegetation water content values with those predicted using the k-fold CV method. As shown in Table 8, the errors were low for both NDWIRog and MSI. The evaluation model indicators obtained for predicted vegetation water content from NDWIRog were: RMSE=2.62% and R²=0.72 (p<0.01). For MSI, the values were RMSE=3.69% and R²=0.47 (p<0.01). These results confirmed the ability of NDWIRog to estimate the vegetation water content for wheat, whereas the MSI values were less in agreement with the observed values. Similar results were reported for MSI by QiuXiang et al. (2012) and Hunt Jr and Rock (1989).
Ning et al. (2013) reported the ability of the VSDI to simulate both soil moisture and vegetation water content, obtaining an R²=0.51 and 0.42, respectively.
Samples R² a b RMSE nRMSE
NDWI Rog 0.77 -47.75 43.90 2.49 3.48
MSI 0.55 -34.98 97.57 3.47 4.85
Vegetation 62
Statistical indicators
Samples R² RMSE nRMSE
NDWI Rog 0.78 2.62 3.64
MSI 0.57 3.69 5.13
K-fold cross validation indicators
200 Vegetation
- 24 -
In areas with limited water availability, the critical period for wheat is during rapid growth, from the end of tillering to full stem elongation. In our study area, this corresponds to the period that usually begins in mid-March. Figure 5 compares measured soil moisture and wheat vegetation water content during the critical tillering to grain filling period. The figure shows a strong relationship between these two variables, with an R²=0.82 (p<0.01). During the development stages of healthy wheat, from tillering to grain filling, and under the soil moisture conditions of the study area, the relationship was linear between FC (24.3%) and PWP (9.8%), which accorded with the findings reported by Girard and Girard (2010). This shows that surface soil moisture can be estimated using vegetation water content and vice-versa.
NDWIRog and MSI performed well in assessing top 10 cm soil moisture, when the soil was completely covered by vegetation. As shown in Table 5, R² and RMSE were equal to 0.83 (p<0.01) and 1.05% for the NDWIRog and 0.68 (p<0.01) and 1.44% for the MSI, respectively.
These results show the capacity of both NDWIRog and MSI to simultaneously estimate both vegetation water content and soil moisture, even when the soil is completely covered by the canopy, as confirmed by the k-fold validation results in Table 6.
Table 5 shows that change in land-cover type induced an MSI with opposing trends. As MSI uses NIR band that behave differently according to type of cover (Ning et al., 2013), this index is not suitable for comparing different land-cover types simultaneously.
- 25 -
Figure 5: Relationship between vegetation and soil moisture measurements (FC: Field capacity and PWP: Permanent wilting point). Data were acquired on 21 March 2013, 26
March 2013, 11 April 2013, 26 March 2014 and 15 April 2014
3.3 Soil moisture assessment during the main growth stages of wheat
Following the strong ability of NDWIRog and MSI to estimate soil moisture separately for bare soil and full vegetation cover, we tested the capacity of these spectral indices to estimate this parameter throughout wheat cropping season, apart from the senescent stage which was not studied, since no irrigation is applied during this stage of wheat development. Figures 6 and 9 show the comparison between observed soil moisture values and those derived using the spectral indices for the 10 acquisition dates.
- 26 -
Figure 6: Relationship between soil moisture (at 10 cm depth) and the NDWIRog
values derived from all the acquired images (cropping season 2012/2013 in blue and cropping season 2013/2014 in Red: squares = bare soil; cross = covered soil; circles = mixed cover). Error bars (based on standard deviation) show the range of NDWIRog
values in each sub-plot
Figure 7: Relationship between soil moisture (at 10 cm depth) and the NDWIRog
values derived from all the acquired images (lag time of maximum 2 days between field measurements and dates of satellite pass)
- 27 -
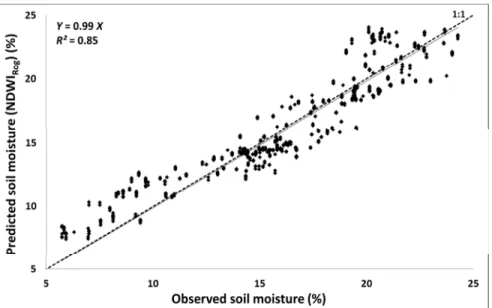
Figure 8: Comparison between observed and predicted soil moisture using the k-fold CV of all acquired images
- 28 -
Figure 9: Relationship between soil moisture (at 10 cm depth) and the MSI values derived from all the acquired images: (A) covered soil; (B) mixed cover; and (C) bare
soil. Error bars (based on standard deviation) show the range of MSI values in each sub-plot
- 29 -
The statistical indicators R² and RMSE were 0.86 (p<0.01) and 1.62 % for NDWIRog, respectively (Table 5). The point clouds for MSI, representing different kinds of cover, show opposite trends according to the main growth stages of wheat (Figure 9). This indicated that there was no unique linear relationship between MSI and surface soil moisture, for the entire wheat crop cycle (apart from the senescent stage). The standard deviation of this index varies between 0.009 and 0.1 (Figure 9). The ratio between MSI values and the standard deviation expressed as a percentage varies between 0.23% and 11.88%.
In contrast, there was good agreement between NDWIRog and soil moisture, whatever the wheat growth stage with a standard deviation values ranging between 0.007 and 0.087 (Figure 6). The ratio between NDWIRog values and the standard deviation as a percentage ranges between 1.12% and 12.87%. The relationship was maintained from one year to the other (cf. figure 6). The dispersion of the observed cloud points was mainly due to the spatial heterogeneity which characterized soil moisture at plot level (Bi et al., 2009; Song et al., 2009; Wang et al., 2013), and the variable time lags ranging from 0 to 3 days between field measurement and satellite pass.
With a two-day lag time, 75% of the overall observed points were discarded. In this case, the selected points corresponded to only five of the acquired images. As shown in Figure 7, R² and RMSE were 0.95 (p<0.01) and 1.16% for the NDWIRog, respectively. The observed point clouds dispersion was significantly reduced (figure 7).
As shown in Table 5, the slope values (a) of the different types of cover for NDWIRog were relatively similar. For mixed cover, the slope was slightly steeper, indicating the stability of NDWIRog at different stages of crop cover (from emergence to grain filling) and its ability to quantify soil moisture throughout crop growth.