HAL Id: tel-01382750
https://tel.archives-ouvertes.fr/tel-01382750
Submitted on 17 Oct 2016
HAL is a multi-disciplinary open access
archive for the deposit and dissemination of
sci-entific research documents, whether they are
pub-lished or not. The documents may come from
L’archive ouverte pluridisciplinaire HAL, est
destinée au dépôt et à la diffusion de documents
scientifiques de niveau recherche, publiés ou non,
émanant des établissements d’enseignement et de
Color harmony : experimental and computational
modeling
Christel Chamaret
To cite this version:
Christel Chamaret. Color harmony : experimental and computational modeling. Image Processing
[eess.IV]. Université Rennes 1, 2016. English. �NNT : 2016REN1S015�. �tel-01382750�
ANN´
EE 2016
TH`
ESE / UNIVERSIT´
E DE RENNES 1
sous le sceau de l’Universit´
e Bretagne Loire
pour le grade de
DOCTEUR DE L’UNIVERSIT´
E DE RENNES 1
Mention : Informatique
Ecole doctorale Matisse
pr´
esent´
ee par
Christel Chamaret
pr´
epar´
ee `
a l’IRISA
(Institut de recherches en informatique et syst`
emes al´
eatoires)
et Technicolor
Color Harmony:
experimental and
computational
modeling.
Th`
ese soutenue `
a Rennes
le 28 Avril 2016
devant le jury compos´
e de :
Pr Alain Tr´
emeau
Professeur, Universit´e de Saint-Etienne / rapporteur
Dr Vincent Courboulay
Maˆıtre de conf´erences HDR, Universit´e de La Rochelle / rapporteur
Pr Patrick Le Callet
Professeur, Universit´e de Nantes / examinateur
Dr Frederic Devinck
Maˆıtre de conf´erences HDR, Universit´e de Rennes 2 / examinateur
Pr Luce Morin
Professeur, INSA Rennes / examinateur
Abstract
While the consumption of digital media exploded in the last decade, consequent improvements happened in the area of medical imaging, leading to a better understanding of vision mechanisms. More than ever, making aesthetic pictures quickly - with or without artistic expertise - is a research topic. Different axis of investigations remain possible: high resolution, high dynamic range or wide color gamut. Additionally to these objective image properties, more perceptual and artistic insights could be of benefit to any user manipulating pictures.
In such context, this thesis deals with the topic of Color Harmony . The literature related to this topic is limited, but involves many different scientific areas: color science, image processing, psychology, biology and so on. The valid-ity of collected data is questionable due to their limitation to two- or three-colors patches. The models extrapolated from these data remain non-exploitable on natural pictures. Other models depicting rules or areas on color wheel lack sci-entific guidelines for their utilization. Nonetheless, some algorithms employing color harmony theory and models as a core concept showed up in the literature, but suffered from being quantitatively tested and validated. This is typically due to the deficiency of available ground truth.
In this thesis, two views are put in perspective in order to respond to the previous statements: an experimental and a computational approaches. The conducted experiment allowed observing some effects with an eye-tracking pro-tocol, never applied before with a task on color harmony assessment. From the collected data of our experimental work, we designed a method to gener-ate a ground truth, which would serve to the validation of the two proposed computational methods.
First, we improved an existing architecture for automatic color harmoniza-tion and demonstrated exhaustively the benefit of our approach. As a second computational contribution, a novel quality metric is introduced that integrates the concepts of visual masking and color harmony. Thus, we may predict which areas would be perceived harmonious regarding its neighborhood and then the potential masking effects. As a last contribution, two editing tools made ac-cessible the color harmony theory through a hidden formulation of it and a user-friendly and intuitive interface.
R´
esum´
e en Fran¸
cais
Contexte et Motivation
La couleur est un ´el´ement dominant de la vision humaine. Excluant la pathologie li´ee au daltonisme, la plupart des ˆetres humains - grˆace `a leur syst`eme visuel - sont capables de d´ecoder et analyser leur environnement en interpr´etant les couleurs et leurs nuances. Ainsi, depuis le plus jeune ˆage, la connaissance des diff´erentes couleurs composant notre ecosyst`eme est transf´er´ee et la conscience d’un monde color´e est acquise.
En mˆeme temps que les premiers philosophes grecs commenc`erent `a se ques-tionner sur leur environnement et ses fonctionnalit´es, l’association des couleurs et leur signification sont devenus un sujet majeur. Parce qu’il est intimement li´e au domaine artistique, diff´erentes communaut´es ont ´etudi´e l’association des couleurs, plus tard d´enomm´ee l’Harmonie des couleurs. Ainsi, des physi-ciens, peintres, designers, publicitaires, psychologues etc montr`erent un int´erˆet `
a la compr´ehension de l’harmonie des couleurs.
En 1704, Isaac Newton mis en ´evidence les propri´et´es circulaires des diff´erentes longueurs d’onde et proposa un am´enagemennt des couleurs sous forme de roue [181]. Cons´ecutif `a cette d´ecouverte, plusieurs personnages influents d´efinirent leur propre roue des couleurs qui amen`erent `a une caract´erisation, parfois dif-f´erente, de ce que sont les meilleurs combinaisons ou associations de couleurs [52,177,110, 26,94]. C’est le d´ebut de la conceptualisation de l’harmonie des couleurs. Alors que le rˆole et l’influence des artistes rest`erent pr´epond´erants aux 18e et 19e si`ecle, ce sujet fˆut soutenu plutˆot par la communaut´e de color
science au 20e si`ecle [267].
A partir du milieu du 20e si`ecle, la tendance ´etait de collecter des donn´ees
au travers de questionnaires reflettant l’opinion des participants `a propos de la bonne association des couleurs. Ainsi, des protocoles exp´erimentaux, s’´etendant parfois sur des ann´ees [168], ont ´et´e mis en oeuvre. Une fois collect´ees, ces donn´ees ont permis de construire une repr´esentation empirique de l’harmonie des couleurs, malgr´e les limites ´evidentes de ce genre d’approche: diversit´e cul-turelle, nombre de stimuli, temps de collecte ou d’exp´erience... En parall`ele, les techniques d’imagerie m´edicale se sont am´elior´ees afin de mieux comprendre les m´ecanismes du cerveau et plus pr´ecis´ement le comportement du syst`eme vi-suel humain. Cependant, `a la fin du 20e si`ecle, nous ´etions encore incapables de
mesurer et d’expliquer la notion d’harmonie des couleurs. Dans le mˆeme sens, les psychologues d´efendirent la th´eorie de l’idiosyncrasie rendant le probl`eme beau-coup plus complexe et ind´etermin´e. Ils insist`erent sur le fait que les diff´erences culturelles, pr´ef´erences personnelles, l’´epoque, l’humeur etc avaient un impact fort sur le jugement port´e `a l’harmonie des couleurs [193].
A partir du 21eme si`ecle, le sujet revint au devant de la sc`ene, de part
l’expansion de nouvelles technologies. Un nouveau genre d’artiste est apparu dans les communaut´es de web design, photographie num´erique, computer graphic. En cons´equence, ils ont eu besoin d’outils efficaces et faciles `a manipuler afin d’exploiter ces nouvelles opportunit´es num´eriques. De plus, internet et les r´eseaux sociaux ont facilit´e le d´eploiement d’exp´eriences `a large ´echelle dont les donn´ees sont collect´ees `a la fois rapidement et `a travers le monde.
Dans ce contexte, nous avons identifi´e une opportunit´e de contribuer `a ce monde artistique ´emergeant en ´etudiant le th`eme de l’harmonie des couleurs sous une nouvelle perspective.
Une approche interdisciplinaire
Nous avons d´ecid´e d’aborder ce th`eme avec une approche interdisciplinaire telle que cela a ´et´e ´evoqu´e dans l’historique pr´ec´edent. Ainsi, cette vue interdis-ciplinaire a ´et´e s´epar´ee en deux approches qui vont se rejoindre ensuite: des algorithmes et mod`eles num´eriques ont ´et´e con¸cus et impl´ement´es en prenant en compte les observations et v´erit´e terrain g´en´er´es lors de notre approche exp´erimentale. Pendant ce travail de recherche, nous avons gard´e `a l’esprit les limitations existantes des outils d’´edition d’image et proposer ainsi des in-terfaces et usage qui exploitent nos algorithmes et mod`eles de fa¸con transparente pour l’utilisateur.
L’approache exp´erimentale
Dans cette partie, nous avons choisi de mettre en place deux protocoles distincts, jamais explor´es dans le cadre de l’harmonie des couleurs.
Dans un premier temps, nous avons abord´e cette probl`ematique exp´erimentale localement en questionnant le rˆole du syst`eme visuel humain. Il semblait raisonnable de faire l’hypoth`ese que le syst`eme visuel humain est partie prenante dans l’´evaluation de l’harmonie des couleurs. Ainsi, comme l’attention vi-suelle est principalement mesur´ee `a l’aide d’oculom`etre, nous proposons de car-act´eriser l’harmonie des couleurs au travers des mouvements oculaires mesur´es avec un protocole faisant intervenir une tˆache. En d’autres termes, ce qui at-tire l’attention va vraissemblablement d´eterminer ou influencer notre opinion `a propos de la tˆache consid´er´ee [275, 64, 248,88].
Apr`es avoir conclus sur les effets ´evalu´es `a l’aide de mouvements oculaires, nous exploitons ces donn´ees collect´ees afin de concevoir une base de donn´ees qui servira `a l’´evaluation des mod`eles ´etudi´es.
Dans un second temps, nous examinons le concept d’harmonie des couleurs globalement. Dans ce but, nous avons mis en place un protocole de type comparaison par paires, o`u il ´etait demand´e aux participants d’exprimer leur choix sur l’image la plus harmonieuse lors de la pr´esentation de deux images cˆote `
a cˆote. Ensuite, toutes ces paires annot´ees sont class´ees sur une ´echelle commune d’harmonie, permettant ainsi de comparer tous les stimulis entre eux. Suivant la mˆeme m´ethodologie que dans l’´etude locale de l’harmonie des couleurs, ces donn´ees collect´ees avaient deux objectifs: l’´evaluation du facteur d’harmonie des couleurs (la coh´erence entre les annotateurs, le rˆole de la distribution couleur des stimulis...) et la constitution d’une v´erit´e terrain pour l’´evaluation des m´ethodes propos´ees.
L’approche algorithmique
La seconde approche d´evelopp´ee dans ce m´emoire concerne la conception d’algori-thmes et/ou mod`eles. Nous avons con¸cu et d´evelopp´e principalement deux m´ethodes diff´erentes dont les contributions se situent `a diff´erents niveaux:
1. un algorithme de traitement d’image dont le but est la recolorization au-tomatique d’images,
2. un mod`ele perceptuel d’estimation de la qualit´e d’image; tous deux bas´es sur les pr´eceptes d’harmonie des couleurs.
En suivant l’hypoth`ese que le syst`eme visuel humain joue un rˆole dans l’´evaluation de l’harmonie des couleurs, un mod`ele d’attention visuel a ´et´e int´egr´e `a dessein dans la premi`ere architecture propos´ee dans l’´etat-de-l-art [54] qui harmonise automatiquement les couleurs d’une image. D’autres contribu-tions algorithmiques, par exemple la fonction de r´eajustement des couleurs, la segmentation des zones homog`enes, la fonction de coˆut pour le choix du mod`ele d’harmonie, ont permis d’am´eliorer significativement les r´esultats de l’´etat-de-l’art. Afin de d´emontrer ce gain, nous avons propos´e une ´evaluation exhaustive des diff´erentes ´etapes contituant l’architecture de cet algorithme. En plus de cela, nous avons d´emontr´e objectivement en utilisant le classement de l’exp´erience paire-`a-paire le b´en´efice de notre m´ethode.
La deuxi`eme contribution algorithmique est une m´etrique de qualit´e per-ceptuelle prenant en compte les pr´eceptes d’harmonie des couleurs. D’apr`es notre ´etude de l’´etat-de-l’art, il n’y a pas eu de tentatives ant´erieures `a l’´ elabora-tion d’une telle m´etrique incluant le concept d’harmonie des couleurs dans des architectures imitant le syst`eme visuel humain. Nous avons propos´e une ´evaluation pr´eliminaire de cette m´etrique en nous appuyant sur des cartes cr´e´ees `
a partir des donn´ees oculaires collect´ees lors de nos exp´eriences.
En r´esum´e, ces deux contributions algorithmiques visent `a ing´erer des no-tions de perception visuelle dans les th´eories existantes d’harmonie des couleurs.
Application dans des outils d’´edition
Les contributions propos´ees ne se limitent pas `a une ´etude exp´erimentale et des m´ethodes algorithmiques. Un effort suppl´ementaire a ´et´e apport´e afin d’offrir un cadre applicatif concret `a ces algorithmes. Ainsi, ils ont ´et´e mis en oeuvre dans un contexte d’´edition d’image. L’id´ee sous-jacente de ces outils d’´edition est que ceux-ci b´en´eficient `a tout utilisateur, quelque soit son exper-tise en traitement d’image, en harmonie des couleurs et son sens artistique. Plus g´en´eralement, nous souhaitons rendre accessible les th´eories et r`egles sur l’harmonie des couleurs `a travers des interfaces intuitives et simples.
Dans cet esprit, deux outils d’´edition sont d´ecrits: le premier simplifie et guide l’utilisateur lors d’une tˆache de retouche des couleurs par zone homog`ene; le second propose de biaiser ou influencer le traitement d’harmonisation automa-tique des couleurs `a partir d’une base de donn´ees d´efinies par l’utilisateur. Le premier outil affiche les cartes perceptuelles des zones les moins harmonieuses de l’image, ce qui permet `a l’utilisateur de retoucher en cons´equence la zone con-sid´er´ee `a l’aide de la palette de couleurs propos´ee (garantissant une am´elioration de l’harmonie globale). Le deuxi`eme outil b´en´eficie des am´eliorations que nous avons apport´ees `a l’algorithme d’harmonisation des couleurs et permet `a l’utilisa-teur d’homog´en´eiser le look de toutes ses images tout en garantissant l’harmonie de son image.
R´
esultats et conclusion
A partir des exp´eriences men´ees sur l’harmonie des couleurs, plusieurs hy-poth`eses sont valid´ees.
L’utilisation d’un protocole de tˆache avec un oculom`etre pour mesurer l’har-monie des couleurs a conduit `a une coh´erence inter-observateur acceptable (con-firm´ee par plusieurs m´etriques).
Il y a une influence non n´egligeable de la distribution couleur pour l’´evaluation de l’harmonie. Les images avec une large vari´et´e de couleurs se situent au bas de l’´echelle d’harmonie. Plutˆot que la diversit´e (nombre de teintes diff´erentes pr´esentes), l’agencement et l’aggregation spatiale dans l’image semblent ˆetre le facteur influant.
Les donn´ees collect´ees `a l’aide de l’exp´erience d’eye-tracking (`a savoir les mouvements oculaires sur les images et ceux sur la roue des teintes) nous ont permis de cr´eer une v´erit´e terrain, c’est-`a-dire des cartes avec les zones non-harmonieuses.
Nous concluons que le concept d’harmonie des couleurs est bien compris par les observateurs et homog`ene entre les utilisateurs. Ainsi, nous sommes conva-incus que le concept est assez universel pour envisager la conception de mod`eles num´eriques qui pourront pr´edire, jusqu’`a un certain degr´e, un comportement humain moyen.
Dans la partie analytique, un algorithme d’harmonisation automatique des couleurs, a ´et´e d´evelopp´e et valid´e. S’appuyant sur le travail de Cohen-Or et
al. [54], cette m´ethode propose trois contributions principales dont le but est de r´eduire les distortions, d’obtenir un r´esultat visuellement coh´erent et de favoriser la fid´elit´e au contenu original.
Premi`erement, une fonction de coˆut mesurant la distance statistique en-tre l’histogramme des teintes et tous les templates d’harmonie possibles a ´et´e chang´e et utilis´e conjointement avec l’information de saillance dans l’image. Par cons´equent, le template d’harmonie finalement s´electionn´e est mieux appareill´e `
a la distribution couleur de l’image originale.
Deuxi`emement, une nouvelle fonction permet de moins contracter les teintes lors celles-ci sont r´eajust´ees dans les zones dites harmonieuses du template. Ainsi, une plus grande vari´et´e de teintes est pr´eserv´ee compar´e `a l’utilisation de la fonction originale.
Troisi`emement, l’algorithme de segmentation couleur que nous utilisons per-met de g´en´erer une segmentation fine des zones avec de nombreux modes, ne n´ecessitant pas de param´etrage adhoc `a l’image consid´er´ee.
Egalement dans ce chapitre de la th`ese, nous avons tent´e de convaincre que cet algorithme obtient de bonnes performances en investiguant diff´erentes pistes de validation. Nous avons fourni des r´esultats qualitatifs qui permettent de visuellement appr´ecier l’apport de chaque ´etape de l’algorithme et de traiter des cas particuliers. Cela nous a permis de r´esoudre les probl`emes lev´es lors de l’exposition des limitations de ce genre d’algorithme fournie en d´ebut de chapitre. Une contribution majeure dans l’´evaluation de ce genre d’algorithme r´eside dans l’introduction du protocole d’annotation par paires. En effet, nous avons d´emontr´e que les images harmonis´ees avec notre algorithme ´etaient objec-tivement annot´ees plus harmonieuses que leur version originale sur une ´echelle commune d’harmonie (19 sur 23 stimuli).
Dans un autre chapitre de la partie algorithmique, une m´etrique de qualit´e perceptuelle guid´ee par l’harmonie a ´et´e con¸cue et propos´ee comme une nouvelle caract´eristique ou propri´et´e pour ´evaluer la qualit´e des images. Elle s’appuye `
a la fois sur les effets connus de masquage perceptuel qui sont des propri´et´es importantes du syst`eme visuel humain et sur les templates d’harmonie couleur. L’int´egration de ces deux concepts permet de g´en´erer, en sortie du mod`ele, une carte perceptuelle de zones non harmonieuses et un score associ´e par image. Les r´esultats qualitatifs montrent que les cartes d’harmonie refl`etent la perception des utilisateurs. En effet, l’impact de certaines zones initialement annot´ees non harmonieuses est minimis´e par la m´etrique lorsque l’on en prend en compte les effets de masquage de l’oeil humain. L’analyse quantitative a r´ev´el´e une corr´elation significative entre les sorties de ce mod`ele et deux v´erit´e terrain issues des exp´eriences men´ees dans l’approche exp´erimentale.
Finalement, dans la partie algorithmique, nous avons introduit deux outils d’´edition d’image. Ceux-ci ont rendu accessible aux utilisateurs la th´eorie et les r`egles d’harmonie des couleurs au travers d’une formulation intuitive et cach´ee de ce concept, tout en laissant une part importante de choix et de cr´eativit´e `a l’utilisateur.
Ceci nous permet d’examiner le concept d’harmonie des couleurs au travers d’un champ de recherche large: de l’exp´erimental vers des outils applicatifs.
Publications
This thesis reflects the work published in five papers during international confer-ences and workshops. Patents have also been filed and are currently examined by patent offices.
Peer-reviewed international conferences and workshops
• C. Chamaret, “Color impact in visual attention deployment consider-ing emotional images”, Proc. SPIE. 8291, Human Vision and Electronic Imaging XVII 82911T (February 9, 2012).
• C. Chamaret, F. Urban, J. Lepinel, “Creating experimental color harmony map”, Proc. SPIE 9014, Human Vision and Electronic Imaging XIX, 901410 (25 February 2014).
• Y. Baveye, F. Urban, C. Chamaret, V. Demoulin, P. Hellier, “Saliency-Guided Consistent Color Harmonization”, Computational Color Imaging Worshop, Lecture Notes in Computer Science, Springer p.105-118, 2012. • C. Chamaret, F. Urban, “No-reference Harmony-Guided Quality
Assess-ment”, Computer Vision and Pattern Recognition Workshops (CVPRW), 2013 IEEE Conference on , vol., no., pp.961-967, 23-28 June 2013. • C. Chamaret, F. Urban, and L. Oisel, “Harmony-guided image editing”,
in IEEE International Conference on Image Processing 2014 (ICIP 2014), Paris, France, Oct. 2014, pp. 2176-2178.
Remerciements
Cette page n’est sans doute pas la plus facile `a ´ecrire. Aussi sinueux fˆut-il, le chemin de la th`ese en formation continue (ou VAE) a heureusement une fin et de nombreux acteurs m’ont aid´e et ont particip´e `a cet ´episode important de ma vie. Je les en remercie aujourd’hui.
Tout d’abord, je remercie les membres de mon jury d’avoir accept´e, de rap-porter, Messieurs Alain Tr´emeau et Vincent Courboulay, sur ma th`ese et de participer `a mon jury, Messieurs Patrick Le Callet, Frederic Devinck et Madame Luce Morin.
Je salue aussi l’encadrement d’Olivier Le Meur, mon directeur de th`ese. Merci pour tes retours constructifs, ta patience et tes coups de pouce aux mo-ments cruciaux. Merci d’avoir accept´e d’encadrer ma th`ese en VAE, malgr´e les contraintes.
Un petit mot de remerciement `a Technicolor ainsi que les membres du bu-reau de formation continue et plus particuli`erement Florence Aubr´ee, qui m’a guid´e avec ses conseils pertinents dans la r´edaction du rapport de VAE sur mon parcours et mes comp´etences.
Une pens´ee pour mes ex-´etudiants et coll`egues, qui ont contribu´e `a mes travaux mais ´egalement `a me soutenir, m’encourager, me montrer la voix: Yoann, Fabrice, Lionel (et Simon), Philippe G., Pierre, Philippe B., tous les membres du TA, Patrick et Val´erie.
Enfin, il me reste `a aborder la dimension personnelle, qui n’en est pas la moins charg´ee ´emotionnellement. Cette th`ese, je l’ai fait en partie pour mes enfants, Glen et Olivia; pour leur montrer la valeur et la satisfaction li´ee au travail. Mˆeme s’ils sont encore jeunes, j’esp`ere qu’ils comprendront mieux mes motivations plus tard. Merci `a Julien et son soutien ind´efectible: ¸ca y est tu peux souffler, c’est fini ! Je ne serais pas arriv´ee au bout sans ton soutien logistique, mais surtout moral.
Une pens´ee pour mon p`ere, qui a failli ˆetre encore plus fier de ses filles; le temps et le destin sont des donn´ees impossibles `a contrˆoler. Mais je n’ai pas de regret, car tu as ´et´e l`a pour d’autres ´ev`enements beaucoup plus importants dans ma vie.
Mˆeme si c’est moi la grande soeur, je l’aurais pass´ee apr`es toi cette *** th`ese, tendresse `a C´ecile (Seb. et Romane). C’est plutˆot toi qui m’as toujours tir´e vers le haut.
toi qui fus mon mod`ele dans cette ´epop´ee. J’ai longtemps gard´e l’image de toi qui avait repris tes ´etudes `a plus de 30 ans avec tes deux enfants `a charge, pour donner un vrai tournant et du souffle `a ta carri`ere. Cette peine et cet effort, je les ai vus, enregistr´es et reproduits d’une certaine fa¸con. Ce fut le moteur de ce travail.
Contents
1 General Introduction 1
1.1 Context and Problem . . . 1
1.2 An Interdisciplinary Approach . . . 2
1.3 Organization and Contributions . . . 4
1.4 Beyond the scene . . . 6
I
Literature Review
7
2 Visual Attention 8 2.1 Introduction. . . 82.2 Mechanisms of Visual Attention. . . 10
2.2.1 Main concepts . . . 10
2.2.2 Biological concepts . . . 11
2.2.3 Color vision . . . 12
2.2.4 Processing the information . . . 13
2.3 Models of Visual Attention . . . 14
2.3.1 Approaches . . . 14
2.3.2 Cognitive models . . . 15
2.3.3 Simplified cognitive model . . . 18
2.4 Summary . . . 20
3 Eye-Tracking 21 3.1 Main Concept. . . 22
3.2 Material . . . 23
3.3 What is measured? . . . 25
3.4 How to exploit the data?. . . 27
3.5 Protocols . . . 29
3.6 Metrics . . . 32
3.6.1 Correlation Coefficient . . . 33
3.6.2 Kullback-Leibler Divergence . . . 33
3.6.3 Receiver Operating Characteristic Analysis . . . 34
3.6.4 Normalized Saliency Scanpaths . . . 35
3.7 Summary . . . 37
4 Color Harmony 38 4.1 The origins . . . 38
4.1.1 Definition(s) . . . 39
4.1.2 Theories and Color wheels. . . 40
4.2 Models of Color Harmony . . . 42
4.2.1 Geometric model . . . 43
4.2.2 Numerical model . . . 48
4.2.3 Contingent model . . . 51
4.3 Derived Applications of Color Harmony . . . 52
4.3.1 Color harmonization . . . 53
4.3.2 Color Harmony as an image feature . . . 57
4.4 Summary . . . 59
5 Discussion 61 5.1 Color Mechanisms . . . 61
5.2 Color Harmony at which stage? . . . 63
5.3 Model status . . . 64
5.4 Ground truth issue . . . 66
II
Experimental approach: attention, color and
har-mony
67
6 Introduction 68 6.1 The experimental perspective . . . 686.2 Color and Visual Attention . . . 70
6.3 Color and Eye-tracking. . . 71
6.4 Hypothesis and approach . . . 72
7 Experiment 1: Color Factor 74 7.1 Introduction. . . 74
7.2 Experiment . . . 76
7.2.1 Protocol . . . 76
7.2.2 Database relevancy . . . 77
7.3 Characterizing color influence in visual attention deployment . . 78
7.3.1 Visual and statistical similarity . . . 78
7.3.2 Oculometric appreciation . . . 79
7.4 Going further . . . 81
7.4.1 Saliency models. . . 81
7.4.2 Emotional factor . . . 82
8 Experiment 2: Color Harmony 87
8.1 Introduction. . . 87
8.2 Dataset Creation . . . 88
8.2.1 Distribution: qualitative appreciation . . . 90
8.2.2 Statistics: quantitative appreciation . . . 91
8.2.3 Particular stimuli. . . 92
8.3 Protocol . . . 92
8.4 Analysis of fixations and saccades. . . 94
8.4.1 Frequency and shape. . . 94
8.4.2 Task effect . . . 95
8.5 Analysis of Inter-observer Consistency . . . 96
8.5.1 Spatial data: Inter-observer NSS . . . 97
8.5.2 Temporal data: Eyenalysis c similarity. . . 97
8.5.3 Qualitative appreciation of fixation maps . . . 99
8.6 Analysis of Particular stimuli . . . 101
8.6.1 Harmonized set . . . 101
8.6.2 Large distribution set . . . 102
8.7 Summary . . . 103
9 Ground Truth Creation 105 9.1 Introduction. . . 105
9.2 Methodology . . . 106
9.3 Pictures Clustering based on Agreement . . . 107
9.4 Designing Color DisHarmony Maps . . . 109
9.4.1 Method . . . 110 9.4.2 Maps Appreciation . . . 111 9.5 Summary . . . 113 10 Discussion 114 10.1 Experiment 1 . . . 114 10.2 Experiment 2 . . . 116
10.3 Ground truth creation . . . 118
10.4 Conclusion . . . 118
III
Models and Applications
120
11 Introduction 121 11.1 The computational perspective . . . 12111.2 Color Harmony and Algorithms . . . 122
11.3 Harmony Formulation . . . 123
12 Saliency-guided Consistent Color Harmonization 126 12.1 Introduction. . . 126
12.2 Limitations of previous work . . . 127
12.2.2 Alteration of original content . . . 127
12.2.3 Spatial inconsistency . . . 128
12.3 Our Approach. . . 128
12.3.1 Template determination . . . 129
12.3.2 Pixel color mapping . . . 131
12.3.3 Color segmentation. . . 133
12.4 Validation . . . 134
12.4.1 Fixing state-of-the-art limitations. . . 134
12.4.2 User test . . . 138
12.4.3 Ranking Results . . . 141
12.4.4 Color Distribution Role . . . 142
12.4.5 Discussion . . . 145
12.5 Summary . . . 146
13 Harmony-guided Quality Assessment 148 13.1 Introduction. . . 149
13.2 Paradigm . . . 150
13.3 Proposed method . . . 152
13.3.1 Harmony distance . . . 153
13.3.2 Perceptual masking . . . 153
13.3.3 Pooling and rating . . . 155
13.4 Validation . . . 155
13.4.1 Qualitative appreciation . . . 156
13.4.2 Quantitative appreciation . . . 158
13.4.3 Discussion . . . 160
13.5 Summary . . . 161
14 Color Harmony for Editing 162 14.1 User-assisted color design: state-of-the-art . . . 162
14.2 Picture Retouching . . . 164
14.2.1 Introduction and motivations . . . 164
14.2.2 Implementation . . . 165
14.2.3 Method . . . 167
14.2.4 Use Case . . . 167
14.3 Biased Color Harmonization. . . 167
14.3.1 Introduction and motivations . . . 167
14.3.2 Implementation . . . 169 14.3.3 Method . . . 171 14.3.4 Use Case . . . 172 14.4 Summary . . . 172 15 General Conclusion 176 15.1 Achievements . . . 176 15.2 Perspectives . . . 179 15.2.1 Experimental perspectives . . . 179 15.2.2 Computational perspectives . . . 180
15.2.3 Industrial perspectives . . . 181 A Benchmark of the Technicolor’s Visual Attention Model 182
List of Figures
2.1 Spatial representation of attention by Posner [210]. . . 11
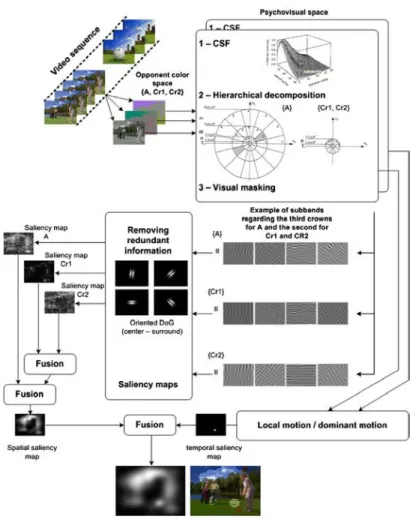
2.3 Architecture of the spatio-temporal model of visual attention by Le Meur et al.. . . 16
2.4 Architecture of the proposed simplified version of Le Meur’s model. 18 3.1 Commercial eye-trackers: a bench of solutions. . . 24
3.2 Two eye-tracking apparatus used in our experiments. . . 25
3.3 Illustration of saccade, fixation on image and visual angle. . . 26
3.4 Illustration of fixation maps created from eye movement patterns. 29 3.5 Illustration of the double mapping technique between two scan-paths. . . 36
4.1 Color wheels designed along centuries. . . 40
4.2 Moon and Spencer’s color harmony model.. . . 44
4.3 Matsuda’s color harmony model. . . 45
4.4 Tokumaru’ membership functions about the hue distribution for the Matsuda’s color schemes. . . 46
4.5 The harmonic model of Sauvaget and Boyer [227]. . . 47
4.6 Large dataset exploitation has introduced new color harmony schemes. . . 48
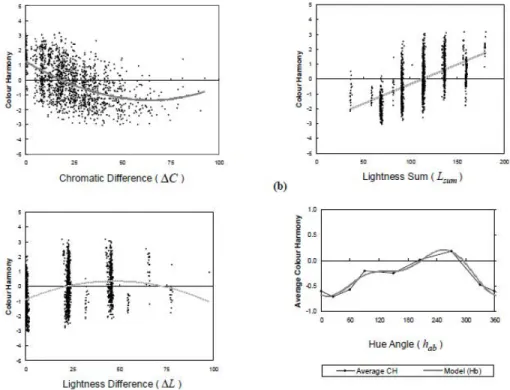
4.7 Ou’s color harmony model: estimated functions to predict fea-tures characterizing harmony. . . 49
4.8 Cohen-Or’s Color Harmonization.. . . 54
4.9 Visual appreciation for the Solli’s color harmony model. . . 59
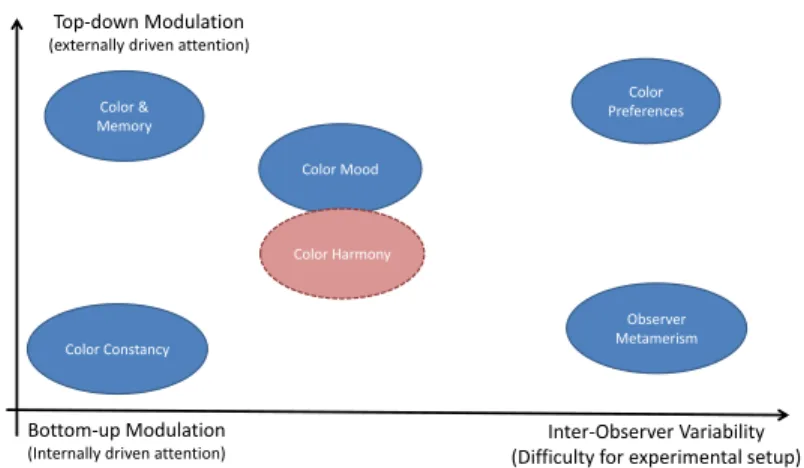
5.1 Color Harmony mechanisms: a tentative for positioning it.. . . . 64
7.1 Illustration of dataset selection based on pairs of (Colorfulness;Contrast). 78 7.2 Similarity metrics computed between the color pictures and their greyscale counterparts. . . 79
7.3 Color stimuli versus greyscale stimuli: fixation duration and sac-cade amplitude as a function of time viewing. . . 80
7.4 Color stimuli versus greyscale stimuli on spatial coordinates . . . 80 7.5 Color stimuli versus greyscale stimuli: Saliency models prediction. 82
7.6 Color stimuli versus greyscale stimuli: Examples of human and computational saliency maps (from [256]) and the associated NSS
values. . . 83
7.7 Color stimuli versus greyscale stimuli: Emotional factor. . . 84
7.8 Qualitative appreciation of human eye fixation maps. . . 86
8.1 Complete dataset created for the Experiment 2 on Color Harmony. 89 8.2 Experiment 2: Statistics on the dataset. . . 91
8.3 Experiment 2: Protocol. . . 94
8.4 Occurrence or frequency of fixation duration and saccade ampli-tude over the complete dataset. . . 95
8.5 Fixation duration and saccade amplitude as a function of ordinal number (appearance order). . . 96
8.6 Inter-observer Consistency measured with Inter-Observer NSS. . 97
8.7 Inter-observer Consistency: Scanpaths similarity including tem-poral information. . . 98
8.8 Harmony pass: Qualitative appreciation of fixation maps. . . 100
8.9 Statistics of the harmonized pictures. . . 102
8.10 Statistics of the large color distribution pictures. . . 103
9.1 Qualitative appreciation of observers’ fixation maps. . . 107
9.2 Dataset clustering into three categories reflecting the degree of agreement for color harmony assessment.. . . 108
9.3 Disharmony maps designed for the HA and LA categories from the eye fixation maps recorded on both hue wheel and original stimuli. . . 112
11.1 Effective color harmony templates used in our computational methods. . . 123
11.2 Color Harmony Formulation: Template annotation. . . 124
11.3 Color Harmony Formulation: Template distribution as a bump function. . . 125
12.1 Limitations of current methods: the issue about template deter-mination. . . 128
12.2 Limitations of current methods: alteration of the original content and spatial unconsistency. . . 129
12.3 Overview of the proposed Color Harmonization algorithm. . . 130
12.4 Illustration of the use of saliency for finding the final template. . 132
12.5 Harmonic mapping of hue depending on the initial hue value. (a) Chosen harmonic template with two sectors and their angles, (b) hue mapping examples . . . 133
12.6 Results of our method for the limitations of the state-of-the-art.. 135
12.7 Results of our method to illustrate the interest of our energy formulation. . . 136 12.8 Results of our method to illustrate the interest of the saliency map.136
12.9 Results of our method to illustrate the soft color mapping function.137 12.10Results of our method to illustrate the non-spatial segmentation. 137
12.11Ranking differences and statistics. . . 142
12.12Qualitative observation of the harmony ranking for all stimuli. . 144
12.13Discussion on fidelity criteria. . . 145
13.1 Is it possible to quantify the color harmony of a pixel in a picture?150 13.2 Illustration of the concept behind the harmony-guided quality assessment. . . 151
13.3 Overview of the Harmony-guided Quality Assessment: the com-plete system. . . 152
13.4 Visual appreciation of perceptual harmony-guided quality maps. 156 13.5 Qualitative appreciation of perceptual harmony maps and its as-sociated score. . . 157
13.6 Correlation between the fitting curve and the experimental data for the harmony score. . . 159
13.7 Validation of the computational and perceptual harmony maps. . 160
14.1 Examples of Color design tools. . . 164
14.2 Screenshot of the User interface. The numbers refer to Section 14.2.2 . . . 166
14.3 Color Palette Creation. It illustrates the case depicted in Figure 14.2. The user wants to retouch the purple skirt and choose the red color proposal. . . 168
14.4 Picture retouching Usecase. . . 168
14.5 Biased Harmonization: screenshot of the User Interface. . . 169
14.6 Biased Harmonization: one additional result. . . 170
14.7 Biased Harmonization Usecase. . . 174
A.1 Benchmark of the Technicolor’s visual attention model on the MIT dataset. . . 183
A.2 Benchmark of the Technicolor’s visual attention model on the MIT dataset: AUC Judd metric. . . 184
A.3 Benchmark of the Technicolor’s visual attention model on the MIT dataset: Similarity metric. . . 184
A.4 Benchmark of the Technicolor’s visual attention model on the MIT dataset: EMD metric. . . 185
A.5 Benchmark of the Technicolor’s visual attention model on the MIT dataset: AUC Borji metric. . . 185
A.6 Benchmark of the Technicolor’s visual attention model on the MIT dataset: sAUC metric. . . 186
A.7 Benchmark of the Technicolor’s visual attention model on the MIT dataset: Coefficent Correlation metric. . . 186
A.8 Benchmark of the Technicolor’s visual attention model on the MIT dataset: Normalized Saliency Scanpath metric. . . 187
List of Tables
12.1 Comparison of inter-observer agreement metrics. . . 140 13.1 Validation of the score computed from the metric. . . 158
Notations
1D, 2D 1, 2 Dimensions
AOI Area Of Interest
AUC Area Under the ROC Curve
CC Correlation Coefficient
CDF Cohen-Daubechies-Feauveau
CR Cornea reflex
CSF Contrast Sensitivity Function
DWT Discrete Wavelet Transform
EOG Electro-OculoGraphy
FIT Feature Integration Theory
FN False Negative
FP False Positiive
FPR False Positive Rate
FV, H conditions Free Viewing, Harmony conditions
HA High Agreement
HSV Hue, Saturation, Value
HVS Human Visual System
IR Infra Red
KLD Kullback-Leibler Divergence
KS test Kolmogorov-Smirnov test
LA Low Agreement
LGN Lateral Geniculate Nucleus
NSS Normalized Scanpath Saliency
RED Remote Eyetracking Device
RMS Root Mean Square
ROC Receiver Operating Characteristic
TN True Negative
TP True Positive
TPR True Positive Rate
Chapter 1
General Introduction
This thesis deals with the concept of Color Harmony . What a satisfying feeling to choose after several years the exploration of such an elegant notion.
Color is my day-long obsession, joy and torment.
Claude Monet
1.1
Context and Problem
Color is a dominant feature of human vision. Apart from the well-studied case of color blindness, most humans - thanks to their visual system - are able to decode and analyze their surrounding environment by interpreting the colors and its nuances. While some vegetables or animals develop camouflage properties to hide from other predators, humans are instinctively sensitive to color contrasts [238]. From the earliest days, the knowledge of the different colors composing our surrounding is transferred to virgin minds and the awareness of a colored world is acquired. For example, it is remarkably common that the adjectives related to colors are present in the first hundred words pronounced by a child [271].
Since the first Greek philosophers started to question their human environ-ment and its functions, color association and their connotative meaning be-came a major topic. Since it relates to the aesthetic and art domains, many fields investigated the study of color association, being later referenced as Color Harmony. Hence, physicians, painters, chemists, color theorists/scientists, de-signers, advertisers and so on showed an interest in the understanding of color harmony.
In 1704, Isaac Newton highlighted the circular properties of wavelengths and proposed the wheel arrangement of colors [181]. Following such precursory work, many key figures designed their own color wheels, leading to different characterization of what are the best color combinations or associations [52,
harmony. While the role and influence of artists remain fundamental in the 18th and 19th centuries, this topic was more supported by the color science community in the 20th century [267].
From the middle of the 20thcentury, the trend was to collect data through questionnaires about users’ opinion on the right color associations. Thus, exper-imental protocols, sometimes lasting years [168], were set up and the collected data built an empirical representation of color harmony, despite the potential limitations of such approach (cultural diversity, number of stimuli, processing time and so on). In the meantime, medical imaging improved to better un-derstand the brain mechanisms and more precisely the behavior of the human visual system. However, at the end of the 20th century, we were still far away
from measuring and explaining the notion of color harmony. Moreover, psychol-ogists strongly supported the theory that cultural differences, preferences, time, mood and other factors had a clear impact on color harmony assessment [193]. They argue that such concept should be carefully measured while controlling the preceding factors.
Since the beginning of the 21stcentury, the cause regain attention, due to the expansion of new computer-aided technology. New kind of artists appeared in the digital world of web design, photography, computer graphics and so on. As a matter of fact, they needed efficient and user-friendly tools to exploit the digital opportunities. In addition, the internet and social networks made possible large scale experiments with data collected quickly and from many places. Digital consumption is now becoming a mass market. Consequently, the production of digital media aims at charming as many people as possible or at least a specific community, identified by its age, culture or taste.
In such a context, we identified an opportunity to contribute to this emerging artistic world by reviving the topic of color harmony from a new perspective.
1.2
An Interdisciplinary Approach
Following the exposed legacy of color harmony approaches, we also come up to this topic with a cross-disciplinary view. We tackle the topic by proposing an experimental approach, as well as building computational models which bene-fit from experimentally collected data. Along this research, we keep in mind potential limitations of the current editing tools and propose new user-friendly usage of such tools.
Experimental approach
Following an experimental approach, we choose to set up two distinct protocols which were unexplored to measure the factor of Color Harmony.
First, we take up this experimental problem by involving visual attention mechanisms. Despite the fact that other senses may contribute to the evaluation of Harmony, we focused on the vision since color is processed at a very early stage in the brain (already along the retina) [97]. As developed later in the
manuscript, Color Harmony is often described as a subtle equilibrium, a balance, a visual interest or even a correct order... These terms may be linked to the vision field. Thus, we found reasonable to assume the human visual system being stakeholder in the evaluation of color harmony.
Since visual attention is mainly measured by eye-trackers, we propose to characterize color harmony by means of eye movements information measured with a task protocol. In simple words, what catches your attention is likely to determine or influence your opinion about the considered task [275,64,248,88]. However, we are aware that this is not enough to characterize completely a complex notion (so-called factor) as Color Harmony.
After concluding on the effects evaluated on the eye movements, we take advantage of the collected data to design a new dataset used to evaluate our computational models.
Second, we investigate globally Color Harmony, after exploring the local aspect of eye fixations. To do so, we set up a pairwise protocol, where partic-ipants were asked to express their opinion about the most harmonious picture over the two presented stimuli. Subsequently, all pair annotations were numer-ically ranked on a harmony scale. All involved stimuli could then be compared with each other. Once again, the collected data serve two purposes: they are employed to evaluate the factor of color harmony (the inter-rater consistency, the color distribution role...) and provide a ground truth for the benchmark of designed methods.
Computational approach
The second perspective, developed in this thesis, deals with the design of a computational model and a harmonization algorithm. We mainly investigate two different methods with some contributions positioned at different levels: an image processing algorithm for automatic color harmonization and a model for perceptual quality assessment. Those two will be referred to models or methods indistinctly.
Following the assumption that visual attention plays a role in the assessment of color harmony, we revisit a state-of-the-art architecture which automatically harmonizes the colors of any picture by ingesting a visual attention model, among other contributions. We undertake an exhaustive assessment of the dif-ferent steps of our method. In addition, we demonstrate objectively with the pairwise protocol the benefit of automatically harmonizing the pictures following such method.
In the second proposed method, we design an innovative quality metric in-volving the harmony precept. As far as we know, this is the first attempt at merging such concepts. We propose a preliminary validation of this metric by relying on the ground truth maps, designed from the eye movement data.
In a nutshell, these contributions aim at integrating visual perception into existing theory of color harmony.
Application and Use case
On top of these experimental and computational contributions, a supplemental effort has tead us to create a concrete framework that would benefit any user, whatever his/her expertise in image, color and artistic manipulation. The idea behind this approach is to make the theory and rules of color harmony more accessible through intuitive and user-friendly interface.
In such a context, two editing tools were created: the first simplifies and guides the user whilst retouching step-by-step the color areas of a picture, the second proposes to bias or influence the color harmonization processing using other user’s pictures. In the first tool, we display the computed harmony quality map as a guidance for disharmonious areas. The second tool benefits from the improvement we brought in the color harmonization process.
From artistic and expert to naive users which experienced and discussed the computational methods, we observe a common feeling about such research: the same frustration of not integrating a personal taste or touch. Hence, these editing tools also address the need to take into account creative intent.
1.3
Organization and Contributions
As a guideline for the reader, the remaining of this thesis is structured into three parts:
Part I: Literature Review.
Chapter 2 draws a picture of the main principles and mechanisms of visual at-tention. In addition, it also depicts the architecture of the visual attention model employed in the following contributions.
Chapter 3 depicts the main concept, material, data, protocols and metrics which are involved in eye-tracking.
Chapter 4 starts with an introduction to Color Harmony, its origin and defini-tions. Then, the theories and models, coming from the color science com-munity, are described deeply, as they are referenced exhaustively through-out this thesis. The chapter keeps developing in another section their different use and implementation in the context of image processing. Chapter 5 discusses the approaches presented in the literature. Also, it depicts
the different issues and limitations of previous work.
Part II: Experimental Approach: attention, color and harmony. Chapter 6 introduces the experimental approach. At the end, the hypothesis
Chapter 7 describes the first experiment which is a preamble to the central topic of color harmony developed in the next chapter. It studies the color factor with eye fixations, recorded on color stimuli and their grayscale counterpart. In addition, the prediction of two visual attention models and their performances regarding these two conditions are provided. Chapter 8 investigates the concept of Color Harmony by means of eye fixation
recording. More precisely, we present the gaze data statistics by propos-ing a qualitative and quantitative dataset analysis, some statistics on eye fixations and an analysis of the inter-observer agreement. As a second contribution, we carefully select the involved stimuli in order to study the behavior of specific color distributions.
Chapter 9 proposes to exploit pragmatically the collected data from the pre-vious chapter. We aims at creating a dataset by post-processing these previously and experimentally collected fixation data. Such dataset serves to the validation of computational methods developed in the part III of the manuscript.
Chapter 10 discusses the different findings of the three preceding chapters. The different hypothesis formulated in Introduction (Chapter 6) are chal-lenged to conclude on their validity.
Part III: Models and Applications.
Chapter 11 explains our approach by depicting the computational perspec-tive, such as done for the experimental part. Then, it draws a picture of the existing algorithms and finally describes the formulation used along the three remaining chapters.
Chapter 12 describes the design and implementation of a computational method for Color Harmonization. It brings two main contributions. First, it im-proves the visual rendering of such method, by introducing mainly the use of a visual attention model. Second, it proposes both a detailed evaluation of the different steps of the method and a global evaluation of the gain brought by harmonizing a picture.
Chapter 13 proposes a new approach for assessing what the quality of a pic-ture is. The proposed computational method relies on perceptual masking and color harmony models to output a no-reference perceptual harmony-guided quality map as well as a score of disharmony. An evaluation is proposed by means of collected data from Chapter 8.
Chapter 14 concludes the computational contributions of this thesis with two tools that directly implement the previously proposed computational meth-ods. These latter aim at guiding the end user and introduce some inter-activity in a task of image editing.
Chapter 15 concludes and summarizes the contributions of this thesis. It explores directions for future work.
1.4
Beyond the scene
In order to complete the introduction of this thesis, we would like to establish the context in which it took place. Even though this thesis focus on the topic of Color Harmony through a visual attention perspective, it takes advantage of the expertise I built for several years on different topics, related to Perception. I started working on visual attention models aiming at measuring [48], im-proving performances of prediction on 2D content [45,23] and simplifying the biological architecture [256] to ensure real-time industrial application [48, 44]. Then, I studied also the modeling and potential application of visual attention models for stereoscopic content [47]. In such context, I developed an expertise and a real taste for experimental protocols, always performing both the experi-ments and algorithms in accordance. I attempted to apply this philosophy when I addressed the topic of Color Harmony in this thesis.
Afterward, I got interested in the prediction of induced emotion through the supervision of a phd student around this topic. Once again, the experimen-tal approach serves the computational work and each component was equally balanced and developed by the student in his thesis [18,22,20,21,19,151].
Then, I also worked on image processing algorithms, more precisely color mapping [76], such as:
• Inverse Tone Mapping of legacy content to produce High Dynamic Range video content [212,221,222],
• Colorization of black and white pictures from a reference picture [135], I am currently investigating new promising and difficult ways about percep-tual model. Through a large campaign of different experiments, we attempt to characterize the concept of interestingness. What makes an image interesting? We define the notions of intra- and inter-interestingness to study more precisely the local and global aspects of such concept. Our first experimental conclusions [46] conduct us to model such concept for an average observer in upcoming publications.
In such rich context of experiments and algorithms, I developed the topic of Color Harmony while relying on my expertise in visual attention.
Part I
Chapter 2
Visual Attention
This chapter reviews the main principles of visual attention. We have not the ambition to develop an exhaustive explanation of the literature, but we prefer focusing on key mechanisms that are the foundations of visual attention. The mentioned principles are a preamble to the visual attention modeling which contributes to two proposed computational methods (Chapter12and 13).
2.1
Introduction
The surrounding world is evolving exponentially in terms of technology. While the breakthrough related to the color introduction in television standard dates back to 1960, in fifteen years many new revolutions, related to screens, devices, portability, content, accessibility, have changed our consumption habits. This is not untypical to observe either a person watching several screens at a time or another one reading the news or playing a game while walking in the street. The cognitive activity involved in daily digital consumption is getting more and more important. Thus, we can easily imagine that the brain, the cells, the mechanisms involved in such daily “fight” are evolving and adapting to survive. The visual attention is challenged every day by an environment more and more complex and a bigger offer for digital entertainment. The competition seems unequal and the visual attention system has no other choice that being selec-tive. Also, no doubt the visual attention is also influenced by other modalities that only visual stimuli: the audio signal obviously plays a role in attentional mechanisms that can not be neglected [29, 80], also internal human status or mood as well as other senses (smell, touch, taste) are relevant [258]. The human is full of specialized sensory receptors that transmit to the brain the sensation of the environment. Those are influencing our perception and our attention. In this Chapter, we will not tackle the broad and complex topic of sensation and perception. Only the field of attention related to the visual modality is investigated and discussed.
By essence, the attention word sounds as the discrimination of contrasted phe-nomena. The stimuli is partially treated by the brain that pre-processed the most relevant features, activity or meaning to be used for the global context understanding. The visual attention suggests the analysis of the perceived en-vironment with or without the instruction of a specific task. Despite the main involvement of psychologists for promoting visual attention (Section3.5), there is an intensive research activity where different communities has brought some considerable contributions:
• biology: identification and role of cells (Section2.2.2),
• neuroscience: sophisticated neuroimaging technology for measuring stim-uli impact and identifying involved parts of the brain (Section2.2), • physic and optic: for providing apparatus such as eye-tracking that
mea-sure eye movements (Chapter3),
• signal processing: for having proposed and implemented modeling of visual attention (Section2.3).
The scientific work on visual attention exploded from the 1980’s consistently with the maturity and accuracy of measurement apparatus. The advances in functional magnetic resonance imaging (fMRI), event-related potentials (ERP) and magnetoencephalography (MEG) lead to significant breakthroughs in the characterization of visual attention. In addition, the progress made in the ac-curacy and reliability of the eye-tracking apparatus also contributed largely to the understanding of visual attention deployment by studying eye movements. Another factor favored the expansion of the research in this field: the compu-tational modeling takes advantage of biologically-plausible brain mechanisms. Indeed, the findings of neuroscience experiments have been purposely reused for building biological-inspired models [42].
Many remarkable psychologists participated early to the coming of visual at-tention theory. While William James (1842-1910) promoted the voluntary and active features of visual attention controlled by a purpose [118], earlier Hermann Von Helmholtz (1821-1894) rather believed in a fine and detailed observation of objects or a precise area [97]. Both psychologists laid the foundations of con-temporary modeling of visual attention.
Following this introduction, we introduce the main principles of visual attention (Section2.2) where we develop the main concepts (Section2.2.1), the biological concepts (Section2.2.2), the color vision theory (Section2.2.3) and the process-ing inferred in the brain (Section2.2.4). Thus, in a section dedicated to visual attention modeling (Section2.3), we describe the different approaches (Section 2.3.1) then we focus on cognitive models (Section 2.3.2) and finally we depict a simplified model (Section 2.3.3) which is later used in the contributions of this thesis. The last section summarizes the different notions presented in this chapter (Section2.4).
2.2
Mechanisms of Visual Attention
2.2.1
Main concepts
The field of visual attention received a lot of attention and substantial efforts have been made the last decades by the researchers of different communities to understand and characterize its mechanisms. However, there is no consensus on how visual attention works precisely. Despite that, we are introducing the most commonly adopted principles related to visual attention.
First, the visual attention is selective. This is clearly due to the limited ca-pacities of the human cells to process complex stimuli and information. The visual attention selection consist of two stages: a pre-attentive and an attentive processing [257]. Both stages are considered independent from each other and have a different role. The pre-attentive stage has unlimited capacity and oper-ates simultaneously or in parallel in the visual field. On contrary, the attentive processing with limited capacity focus on one item for a better inspection of its features. More specifically, we can say that the pre-attentive stage detects low-level features or characteristics of the scene (such as color, edges, orientation, motion...), that are integrated afterward in the attentive stage for a complete understanding and awareness of the scene. Such concept referred to the Fea-ture Integration Theory (FIT) developed in 1980 by Anne Treisman [254] and will play a fundamental role in the computational modeling of visual attention (Section2.3).
In the literature, the spatial aspect of attention is also often discussed. Two well-known models, conceptually similar, evoke a delimited spatial region where the processing is located. The spotlight model of Posner et al. [210] describes three areas: the focus, the fringe and the margin (Figure2.1). Typically, in the focus area the processing is performed at a high resolution, while in the fringe section less receptors are involved leading to a low resolution analysis. Beyond the margin area, the processing is not engaged. The zoom lens model from Eriksen and Yeh [73] also relies on the same metaphor and spatial organization (focus, fringe and margin). Their new contribution deals with the adaptation of the region size or radius. Following the idea of a camera and having the atten-tional resources fixed, the size of the focus area directly influences the quality of the processing (meaning the resolution available for analysis). Then, if the focus radius is large, the processing is likely to be less efficient. This theory has to be linked with the notion of fixation measured by eye-tracker and discussed in Chapter3.
The concept of overt versus covert visual attention has to be specified, es-pecially because eye movements data are manipulated along this manuscript. Covert visual attention does not involve eye movements. Typically, the subject focus on one area and monitors the surroundings in order to search for an object, to guide its movement in space [207]. Once the covert visual attention has
ful-focus
margin
fringe
Figure 2.1: Spatial representation of attention by Posner [210]. Three spatial areas are identified: focus (high resolution), fringe (low resolution) and margin (not visible).
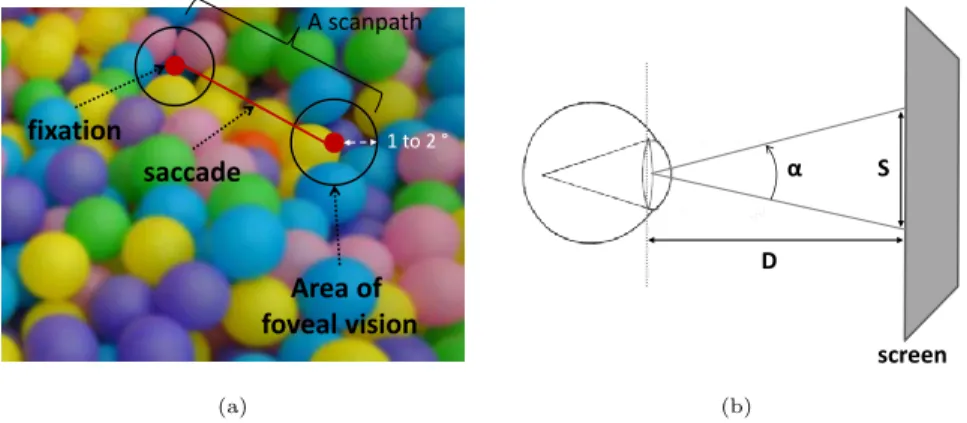
filled its function, it engages the eye movements in the scanning of a particular target, this is the overt visual attention [74,211]. This latter is characterized by the different varieties of eye movements (fixations, saccades, smooth pursuit) [41] and remains the center of this manuscript. A set of fixations (area which is fixated) and saccades (amplitude of displacement between two fixations) cre-ates a scanpath [188]. Note that these notions are discussed and illustrated in Chapter3.
Pioneer work of Yarbus [275] is well-known from the community: he showed the evidence of task-related scanpaths for identical stimuli. Even if the experiment condition as well as the conclusion have been recently revisited [64, 248, 88], he introduced the notion of task dependency later investigated under different conditions. From these observations, visual attention can be categorized once again. Bottom-up (or exogenous) attention is assimilated to a reflex, an invol-untary and unconscious movement. Usually, it is a very fast phenomena not motivated by a task. At the opposite, the top-down (or endogenous) attention is deployed voluntary and consciously. It is a slow action originally following a dedicated task.
There are other categories of visual attention depicting other conditions, environment (e.g. multi-tasks), stimuli (e.g. aesthetic pictures) or processing in the brain (e.g. memory). However, we will not discussed these different notions which are not related to the proposed work.
2.2.2
Biological concepts
Along the wide electromagnetic spectrum, only few wavelengths are perceptible and translatable by the eye. These visible wavelengths are the light and the colors as we may described them; they are spread only from 380 to 760 nanome-ters (10−9), while at the boundary, gamma rays are around 1.10−14 and long
waves around 1.104meters. This short visible band is only what the specialized receptor cells in our eye are capable to transform into a neural signal into the brain.
At this stage, it is interesting to make the link between the physical signal and color science. As mentioned previously, different values of wavelength de-pict a perceived color or a hue, e.g. a wavelength around 430-460 nm is a blue light. The amplitude of this wavelength represents the brightness, high wave amplitude means a brighter color. Also, the noise or the interference in the waveform shows the color purity, or its saturation. Hue, saturation and bright-ness are directly linked to the visible spectrum of wavelengths.
The eye demonstrates some properties due to its physiological organization. We do not detail the complete structure of the eye, since all elements are not participating to the visual attention. However, it is interesting to focus and notice the key role of the retina and fovea. The retina, located at the back of the eye, is a multilayer surface that records the wavelengths entering through the pupil. Such energy is stored and transformed on the retina into a neural signal or response for immediate processing in the brain. By means of the mil-lions of photoreceptors constituting its surface, the retina is able to achieve this fundamental task.
The rods and cones are the two kinds of photoreceptors that are processing the input wavelengths. They have complementary properties and sensitivity to the signal. Coarsely, rods are specialized to process light and respond to low illumination while cones are rather dedicated to color vision and respond to high illumination. A small area, named fovea, on the retina plays a key role for the vision. This is the place where the vision is the best and which enclose only the cones. The rods are spread all along the retina except on the fovea (Figure 2.2). Once the transduction step has been performed by the two specialized photoreceptors, the produced signal is transmitted to the bipolar cells and after to the ganglion cells through the optic nerve which carries it to the brain.
2.2.3
Color vision
As mentioned in section2.2.2, the specialized photoreceptors named cones are in charge of translating the wavelengths into neural information related to color vision. The explanation about the way they operate has opposed two theories that reveal to be both valid and complementary: the trichromatic theory and the opponent-process theory.
Color vision has a long history of psychological experiments to characterize color perception at the eye level. Originally, the trichromatic theory has been introduced by Thomas Young in 1802 and refined in 1852 by Hermann von Helmholtz [97] (already mentioned in section 2.1 for his work on visual atten-tion). They found out that there exist three classes of cone: red, green and blue. They experienced the human capability to recreate an unique color wavelength from three others and derived the conclusion about the existence of three vari-eties of cones. However, such findings was not strong enough to explain some
responses of people having color abnormalities. Later in 1892, Hewald Hering [101] proposed the opponent-process theory that could answer some questions raised by the trichromatic theory. He believed in four kinds of cone that work by complementarity (red-green and blue-yellow). Thus, each cone is excited by the color 1 and inhibited by the color 2, both forming the considered pair.
The community gave support to both theories that turned out to be correct and complementary. Three varieties of cones - red, green and blue - (trichro-matic theory) respond to a color difference following a three opponent mecha-nism (opponent-process theory). Thus, the first kind measures the differences in the response of the red and green, the second kind measures also the differences between the blue cones and the sum of the red and green (yellow) cones and the third kind measures the differences in luminance due to its achromatic nature.
This theory has been naturally translated in the computational models of visual attention.
2.2.4
Processing the information
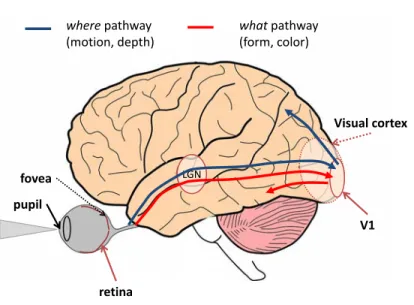
Once the light information captured from the eye has been translated into a neuronal information, the brain role becomes predominant. A dedicated area for visual processing has been identified at the back of skull, the visual cor-tex. Through different areas, this latter analyzes some specific characteristics of the visual information. These visual signal being so rich and complex, the brain owns specialized cells, areas to decompose the signal characteristics (color, shape, motion, face and so on). However, such processing cannot be sequen-tial to consider a fast response and understanding of human. The processing of information is designed in parallel, with different pathways. The two main categories of pathways refer to the what and where pathways [231,85,169], also known as the ventral stream and the dorsal stream, respectively. As their name suggests, the what pathway deals with the stimulus features (e.g shape, color) and the identity of an object, while the where pathway has more concerns about the spatial information of an object (e.g motion and depth). This concept is illustrated in Figure2.2.
The optic nerve projects the neuronal signal to the dorsal lateral geniculate nucleus (LGN). Mainly, this area gathers the information coming from each eye and push them to the visual cortex and more specifically to the primary visual cortex (also called area V1). The visual cortex is made of six layers, whose the most well-known and studied is the area V1. This area proceeds as detecting edge and encoding them in spatial frequencies rather than encoding the complete received image. This is an efficient and natural compression of the information. The area V4 has been identified to provide a high attentional activity [175]. It deals with the following features: orientation, spatial frequen-cies and form recognition. Additionally, it is suspected to play a key role for color processing [83]. The cells present in V5 deal with the speed and direction of moving stimuli. Globally, this is not obvious to split the role of each area according to the addressed features.
pupil retina fovea LGN V1 Visual cortex where pathway (motion, depth) what pathway (form, color)
Figure 2.2: Eye and brain anatomy. what and where pathways in the brain dealing with the processing of different features
2.3
Models of Visual Attention
2.3.1
Approaches
The computational modeling of visual attention has been widely explored in the literature. The approaches are almost as vast as the number of techniques used in image processing. Also, computer graphics, computer vision, machine learning have brought their contribution in the detection of region-of-interest. A visual attention model is an algorithm that inputs a visual stimulus, as an image or a video sequence, and outputs a saliency map (one per frame if considering a video source). The saliency map concept has been introduced by Koch and Ullman in the context of their feed-forward model [131]. It describes if a pixel is conspicuous (visually relevant) with regards to its neighborhood. In other words, a greyscale map, having values from 0 to 255 (low to high interest) for each pixel, is estimated. This is the prediction map computationally estimated by the model. Note that human-made map (with homogeneous dimensions) are usually created experimentally in order to confront the model to a ground truth (Section3.4).
In a complete review, Borji and Itti [30] provided to the community an exhaus-tive classification and benchmark of the different approaches. They discussed the prediction quality through an exhaustive list of dataset and the employed metrics. We can differentiate the models that have a biological architecture (meaning inspired from the findings of psychologists) from those purely compu-tational. However, it does not mean that the “non-biological” models perform
worse than their biological homologue. They are also based on acceptable and intuitive arguments that statistically are good enough to compete with the sim-plified or adapted architecture derived from biological concepts.
In [30], different two-by-two comparisons are discussed to compare the dif-ferent approaches, e.g. the pixel- versus object-based models or the bottom-up versus top-down approaches. Finally, the authors went for a classification re-lated to the architecture or methods employed and pointed out eight clusters: cognitive models, bayesian models, decision theoretic models, pattern classifica-tion models, spectral analysis models, graphical models, informaclassifica-tion theoretic models and a miscellaneous category. In the next section, we will focus on the cognitive models and more specifically on Le Meur’s model [170,144].
Despite the different methods used for predicting the salient areas, all are moti-vated from the same theory already mentioned in section2.2: the Feature Inte-gration Theory [254]. In her theory, Anne Treisman distinguised two stages, the feature search and the conjunction search that also confirm the idea of a preat-tentive stage and an atpreat-tentive stage. During the early feature search, the object characteristics, such as color, shape, orientation and movement are detailed in-dividually in different areas of the brain (section2.2.4). In the late conjunction search, the previous information are combined to make a complete perception of the considered object through a master map of locations. This latter includes all locations in which features have been detected. These locations point to the multiple feature maps.
All visual attention models are based upon this theory, because they usually proceed in two steps:
• First, they detect, extract image features. These cues may be directly linked to the FIT: shape, color, orientation, movement...or they may be more intuitive and high levels: face, scene classification, gist...
• Second, they integrate in a specific manner these features; e.g. either by combining linearly independent feature maps, by learning from a dataset and inferring a suitable feature combination or by using probabilistic model to estimate the likelihood of a feature usability.
In the next section, we are focusing on cognitive models and more particularly on the architecture of pioneer models that integrates only the visual modality. However, some work also evaluated the sound influence in eye movements [59] and introduced the audio modality as a key feature in the modeling of visual attention [58].
2.3.2
Cognitive models
Itti et al. [113] were pioneer in implementing a complete version of the feed-forward model designed by Koch and Ullman [131]. Moreover, this first imple-mentation was made available to the community, then it assured his popularity for the two following purposes: to benchmark any new implementations and
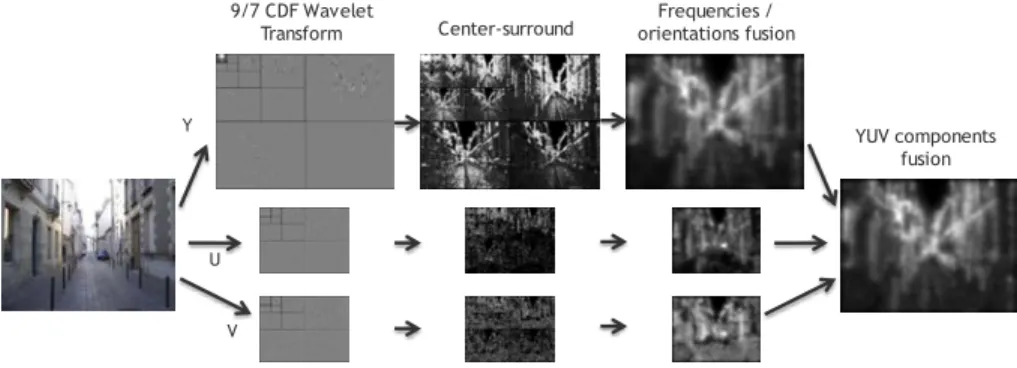


![Figure 4.5: The harmonic model of Sauvaget and Boyer [227]. The main idea is to tend to ideal hue proportions (left-hand side wheel)](https://thumb-eu.123doks.com/thumbv2/123doknet/11496499.293346/69.918.216.694.190.449/figure-harmonic-model-sauvaget-boyer-ideal-proportions-wheel.webp)