HAL Id: hal-02887222
https://hal.archives-ouvertes.fr/hal-02887222
Submitted on 23 Feb 2021HAL is a multi-disciplinary open access archive for the deposit and dissemination of sci-entific research documents, whether they are pub-lished or not. The documents may come from teaching and research institutions in France or abroad, or from public or private research centers.
L’archive ouverte pluridisciplinaire HAL, est destinée au dépôt et à la diffusion de documents scientifiques de niveau recherche, publiés ou non, émanant des établissements d’enseignement et de recherche français ou étrangers, des laboratoires publics ou privés.
Microstructures for High Density Lithium-ion Batteries
Guided by the Specificities of Their Electronic and Ionic
Transport Mechanisms
F. Cadiou, T. Douillard, N. Besnard, B. Lestriez, E. Maire
To cite this version:
F. Cadiou, T. Douillard, N. Besnard, B. Lestriez, E. Maire. Multiscale Characterization of Composite Electrode Microstructures for High Density Lithium-ion Batteries Guided by the Specificities of Their Electronic and Ionic Transport Mechanisms. Journal of The Electrochemical Society, Electrochemical Society, 2020, 167 (10), pp.100521. �10.1149/1945-7111/ab975a�. �hal-02887222�
Multiscale characterisation of composite electrode microstructures for
high density lithium-ion batteries guided by the specificities of their
electronic and ionic transport mechanisms
F. Cadiou1, T. Douillard1, N. Besnard3, B. Lestriez2, and E. Maire1 1
MATEIS, INSA Lyon, Villeurbanne, France
2Université de Nantes, CNRS, Institut des Matériaux Jean Rouxel, IMN, F-44000 Nantes, France 3Renault Technocentre, DEA-IR, 78084 Guyancourt, France
Abstract
The microstructures of Li-ion positive composite electrodes designed for EVs have been characterised at different scales and in particular by FIB/SEM nanotomography. These electrodes are composed of Li(Ni0
.5Mn0.3Co0.2)O2, carbon black (CB), and polyvinylidene fluoride (PVdF). The component
propor-tions in the electrodes and the electrode densities were varied. Specific image analysis tools have been developed to quantify the microstructure parameters that will influence the transport and exchange prop-erties of ionic and electronic charges during battery operation. Different porosities have been highlighted, in particular the micrometric porosity which appears to be the most effective for the ion diffusion in the liquid electrolyte due to its low tortuosity and large intra-connectiviy. Different parallel paths for the transport of electrons in solid phases such as the CB/PVdF percolating network and a hybrid one consisting of CB/PVdF islands distributed on the NMC cluster surface and the NMC grains pertaining to these clusters. This last network can be effective when the CB/PVdF islands allow the electrons to
short-circuit the resistive NMC grain boundaries.
Keywords — Lithium-ion batteries, FIB/SEM, nanotomography, 3D, microstructure, morphological
analysis
Introduction
To increase battery performance, current research focuses as much on the electrode formulation and man-ufacturing and the understanding of the functioning of complete cells, as on the search for new materials. Optimizing the electrode formulation and manufacture is indeed essential to increase the energy density and
power density of the batteries as well as their lifespan [1]. To reach this goal, there are two approaches. The first, experimental, which consists of measuring the electrode properties and their electrochemical per-formance, trying to interpret them in the light of their composition and morphology, then by rationalising the results with analytical models based on the understanding of the most significant physical or chemical phenomena that govern these properties or performance [2, 3]. This first approach allows rapid diagnosis of the quality of the electrode formulation and manufacture, and is a tool for their optimisation [4, 5, 6]. The second approach, which is intended to be more complete, makes use of numerical simulation while seeking to take into account all of the phenomena and properties [7]. The advantage and the interest of numerical simulation is the multiplicity of scenarios that they can consider and thus the hindsight that they enable to take with the general trends that they release. However, in order to carry out relevant simula-tions, it is necessary to rely on very fine and accurate descriptions of the real properties and microstructures.
The X-Ray (XR) and FIB/SEM tomography techniques are very useful for qualifying the distribution of the electrode constituents and translating the electrode microstructure at its different scales into quan-titative parameters which can be used to feed the two approaches mentioned above. A crucial question is that of the porosity distribution at the different electrode scales as well as of the mixture formed by the binder and the conductive carbon, which plays a primordial role on the transport and the charge transfer, and therefore on electrochemical performance [8, 9]. XR tomography makes it possible to characterise large volumes but its resolution is limited and its sensitivity reduced to the active material more absorbent than the carbon phase, which thus cannot be discriminated from the pores [10, 11]. It is impossible to confine oneself to XR tomography because the electrodes contain small materials, such as carbon nanoparticles (size ∼150nm) or active material grains (primary particles, size ∼250nm), which requires the use of the FIB/SEM technique. Only its resolution allows access to this mesostructure [12, 13]. However, this technique can only capture small electrode volumes. In addition, the representative volumes can be larger than that of the accessible volumes with FIB/SEM [14, 15]. It is therefore useful to multiply the acquisitions for better representativeness. Unfortunately, image acquisition and processing, which may require manual operations, is very time consuming. An alternative approach is to use XR tomography, which allows access to the morphology of the active material phase on a larger scale, and to create virtually in the empty spaces of this macrostructure the mesostructure by using mathematical models [16] or FIB/SEM data [14, 17]. From these digital microstructures, effective conductivities or diffusivities are calculated which can be compared to measurements [15], or be used to draw up a figure of merit for the transport properties of an electrode. The transport properties and electrochemical performance simulations can be carried out directly on the digital volumes of microstructures imaged in 3D [15, 18, 19].
The electrode microstructures are highly dependent on the electrode composition, and vary with the nature of the active material, the additives (electronic conductor and binder), as well as the manufacturing conditions [2, 20, 21]. Thus, the results previously acquired on the graphite, LiCoO2, or LiFePO4 electrodes
cannot be systematically generalized to the LiNixMnyCo1−x−yO2 (NMC) electrodes, which now replace
LiCoO2 and LiFePO4 at the positive electrode [1]. NMCs are generally in the form of secondary particles
(called clusters) of moderately sintered primary particles (grains). The clusters are fragmented by cracks at the grain boundaries during the electrode calendering. This results in a profound mesostructure modification with the electrode compaction which has not yet been exhaustively characterised. However, a significant dependence on electrochemical performance is expected with the size distribution of NMC particles [22]. Recent work has studied the fragmentation of this active material during electrochemical cycling [23, 24, 25].
Finally, the microstructure analysis from the point of view of transport properties must take into ac-count the transport mechanisms. To be relevant, with regard to electronic transport, it appears necessary to take into account variations in conductivity at different scales of the active material [26, 27]. In the case of LiNi0.5Mn0.3Co0.2O2, the primary particles or grains have a high conductivity, which can approach the
conductivity of the mixture made from conductive carbon and polymer, while the secondary particles have a very low conductivity. It is therefore necessary to go further than the conventional approach which is only interested in the conductive binder percolation in the electrode [2]. For ion transport, the conventional approach consists in quantifying the total porosity and its tortuosity, which can be determined in different ways [11, 14, 20, 28]. Electrode microstructure analysis shows, however, that there are several porosities: macropores that are the cavities between the NMC clusters, mesopores or nanopores inside the additive do-mains, and at the interstices between primary grains in the fragmented NMC clusters. Several experimental works suggest that the physicochemical interactions at the interfaces between the electrolyte and the active material or the conductive mixture influence the ion transport in the electrolyte [29, 30]. Another study in-dicates that the constrictions (bottlenecks) in the pore network must be taken into account [11]. It therefore appears necessary to discriminate the different porosity types, which requires the FIB/SEM resolution.
In this paper, we used different techniques to characterise the microstructure at different scales in posi-tive electrodes based on LiNi0.5Mn0.3Co0.2O2. The formulation and high compaction of these electrodes are
typical of electric vehicle applications. The microstructure 3D images were then processed and anal-ysed (in 3D) to quantify the features of interest and their morphology. Particular attention was paid to the NMC cluster fragmentation state, to the characterisation of the different porosities and to the distribution
of the polymer and carbon mixture on the NMC cluster surfaces. New image analysis tools have been de-veloped to take into account the specificity of the electronic and ion transport mechanisms in such electrodes.
1
Electrode microstructure digitalisation at multiple scales
The electrodes are made of Li(Ni0.5Mn0.3Co0.2)O2 (NMC) as active material (AM) and a mixture of PVdF,
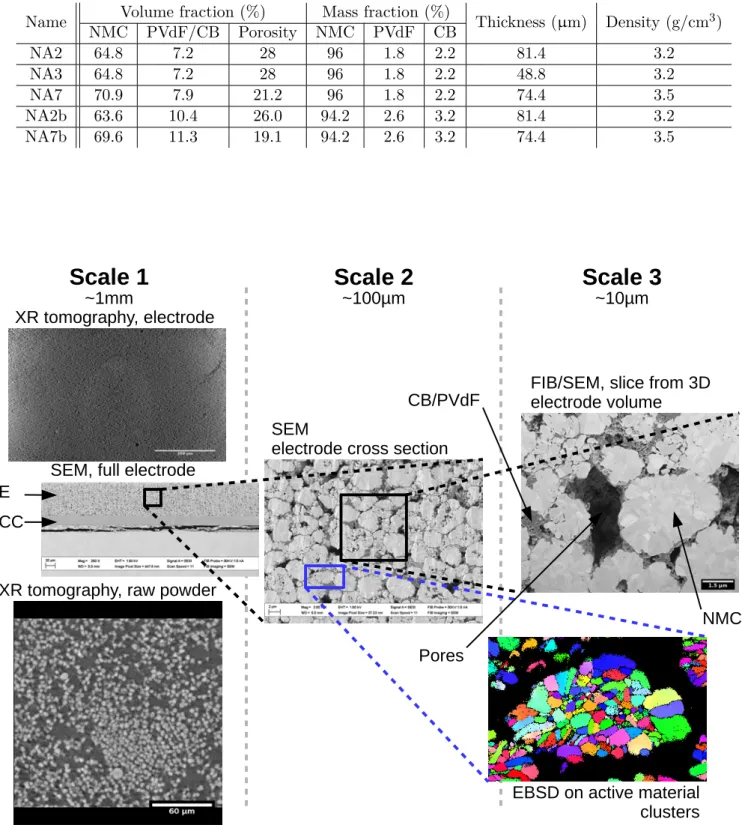
poly(vinylidene fluoride), with Carbon Black nanoparticles as conductive binder (PVdF/CB). These elec-trodes were calendered (compressed) to adjust their porosity. The Table 1 summarises their targeted mass and volume composition, thickness and density. NA3 and NA2 electrodes have similar composition and density (porosity) at the electrode scale as they only differ by their thickness. NA7 has a higher density and thus lower porosity than NA3 and NA2. NA2b and NA7b contain more CB/PVdF than NA3, NA2 and NA7. NA7b has a higher density and thus lower porosity than NA2b. The NMC volume fractions are close for NA3, NA2 and NA2b on the one hand, and for NA7 and NA7b on the other hand. As a consequence of their higher CB/PVdF content, NA2b has lower porosity than NA3 and NA2, and NA7b than NA7. Figure 1 gives an example of these electrode microstructures at different scales. XR tomography volumes where acquired with a voxel size of 0.3µm using a laboratory device (EasyTom) for the electrode and a synchrotron source (SLS) for the raw powders. SEM images were made at various pixel sizes depending on the area size (from 0.45µm for entire cross-sections to 10nm for FIB/SEM nanotomography, Zeiss SUPRA or NVISION40). The EBSD (Electron Backscatter Diffraction) map was acquired with a 19nm step (Ziess SUPRA). Table S1 compares the size of the interrogated volumes by the various techniques and the mean size of the “Element of Interest” (EI), such as the NMC clusters or grains in the microstructure. The ratio between the analysed volume size and the EI one and the number of EI is always higher than 100 for the SEM, EBSD, and XR techniques. The sampled volumes are thus representative with respect to the sizes of the NMC clusters or grains. The question of the representativeness of FIB/SEM volumes is more complex and discussed later. The FIB/SEM volumes (Zeiss NVISION40) were segmented following a method and algorithm based on [10, 31], which are summarised in SI with Figure S2 displaying the segmented volumes. Before electrode manufacturing, the AM is in the shape of a micrometric powder. In the SEM electrode cross sections, it appears as a light grey phase that has the shape of large polycrystalline aggregates, some of them being hollow and/or fractured. Their size is typically of a few micrometers in diameter. The conductive binder is the darker grey phase. It occupies a fraction of the volume left vacant by the active material clusters and particles packing. It usually comes in the shape of more or less percolated aggregates from a few tenth of nanometers to around a micron thick. The last phase is the porosity itself. It displays a
wide range of size from very large areas (micron wide in between a few AM clusters typically) to very small ones (generally inside the PVdF/CB phase or within cracks in the NMC clusters).
In each one of the following sections, the methodology and image analysis tools used to analyse the electrode microstructures are described before reporting and discussing the results.
2
Macrodefects XR tomography analysis at the electrode sheet scale
In this study, we will mainly focus on the microstructure characterisation at a scale where the PVdF/CB mixture can be resolved in 3D by FIB/SEM nanotomography. XR tomography could have provided a wider view with larger imaged volumes but, unfortunately, the resolution we could achieve (0.3µm voxel size), although one of the best available, was not enough to properly quantify the microstructure. Moreover, the PVdF/CB phase could not be resolved due to absorption contrast issues. The NMC is too much of an absorbent for the XR, so the PVdF/CB mixture (mainly made of carbon) cannot be distinguished from the porosity. As a consequence, the only semi quantitative data we could extract from XR volumes was an estimation of the size and position of the biggest heterogeneities within the electrode (see Figure S1). These ones can be large NMC clusters or large porosities or PVdF/CB aggregates, possibly combined as both last features cannot be distinguished from each other. It appears that their disposition is mostly at random and that the volume fraction of these heterogeneities is always under 1%.
3
Microstructure overall analysis
This section is focusing on the overall analysis that are commonly carried out after an electrode FIB/SEM volume acquisition in the battery field [32, 12, 33, 34]. It will consists in: (i) comparing the phase volume fractions in the segmented FIB/SEM volumes with the corresponding macroscale values provided by the manufacturer; (ii) determining the intraconnectivity and mean geometrical tortuosity of the different phases. Most of the raw numerical values extracted from the FIB/SEM volumes, shown in Figure S2, are gathered in Tables 2 to 5.
The local composition in the FIB/SEM volumes deviates more or less from the manufacturer targeted ones (Table 2). We strongly believe this is due to local variation in composition as the 10nm voxel size is much lower than the typical size of the objects of interest, in particular the NMC grains/clusters, the CB/PVdF domains, and the pores. An error is nevertheless clearly possible concerning the nanopores in the CB/PVdF domains and at the cracked NMC grains
boundaries. We believe that we can access pore sizes above 20nm given our 10nm voxel size. Considering the work by Vierrath et al. [13] and our previous work [15] we estimate that we should have access to around 75% of the nanopores. It results in an uncertainty in the calculated volume fractions that is given in the corresponding Tables 2 and 4, which is the highest for the nanoporosity (confined porosity) and the CB/PVdF volume fractions (∼15% and ∼7.5%, respectively, except for NA3 that is less well resolved: ∼50% and ∼15%, respec-tively).
For all samples, the CB/PVdF phase volume fraction is 20 to 50% lower than what is measured in the entire electrode. This can be related to the existence of large CB/PVdF agglomerates as described in section 2 (cf. Figure S1). Moreover, for NA2 and NA2b, the volume fraction in NMC is higher while the porosity is lower in the FIB/SEM volume than in the entire electrode. NA3 shows an opposite trend. For NA7b the local NMC volume fraction and porosity are higher than in the entire electrode, which is the consequence of the large CB/PVdF depletion. For NA7, local and mean NMC volume fractions are close, so the lack in CB/PVdF is locally compensated by a higher porosity at the local scale.
The intraconnectivity is defined as the volume of the biggest connected subvolume (geo-metric feature) over the volume of the whole phase. Intraconnectivity values are indicators of how well a phase is connected and hence sheds some light on its percolation state. In order to identify the separated aggregates within the CB/PVdF phase we performed a 3D labelling computation. It consists in scanning the volume to identify each distinct geometrical feature in a phase and labelling them by giving a personalised grey level to each one. This analysis is however dependent on the connectedness that is used to define if two neighbouring voxels are considered as touching or not. The first, and more restrictive, connectedness is to consider only what are called the 6 first neighbours, i.e. only the voxels that connect via their faces. The second choice is to use the 18 first neighbours, i.e. the voxels that are connected through their faces and edges. The last option is to use all the 26 neighbours by also taking into account the voxels that are touching via their summits. Here, we mainly used the 6 neighbours criterion for large features, like NMC clusters that are several tens of voxels wide, and 26 neighbours for the more finely ramified ones, such as the CB/PVdF agglomerates or porosity that exhibit ramifications that have a thickness of a few voxels. This choice is supported by the good results that could be obtained in previous numerical simulations of the electronic conductivity done on similar type of electrodes segmented in this way [15].
observed (Table 3). These phases are thus strongly percolated within the FIB/SEM volumes. Values for the PVdF/CB phases however show more variation (as a function of binder volume fraction). NA3 has an intraconnectivity for this phase of 31% which indicates a non percolated state. NA2 and NA7 have an intraconnectivity of respectively 71 and 63% which can be analysed as a percolation state near the threshold. This means that some cluster in this phase are not connected. NA2b and NA7b both have an intraconnectivity above 95% indicating a very good percolation of the PVdF/CB phase.
Concerning mean geometric tortuosity, (calculation method is developed in section 6) NMC and porosity phases displays a very low value between 1 and 1.06, indicating that most of the phase can be crossed in a quasi straight line. Tortuosity values for the PVdF/CB phase are ranging from 1.21 to 1.31, which is quite high for geometric values. This indicates that the PVdF/CB phase has a complex intricate shape. It seems consistent with the FIB/SEM volume eye inspections showing a “spider web” like shape and preferential location at contact zones between NMC clusters as well as with low volume fraction of this phase.
4
Fabrication and calendering effect on NMC cluster fragmentation
This section is focusing on the relationship between electrode density and the extent of fragmentation of the AM clusters. To characterise the effect of fabrication or calendaring on the active material morphology, the first parameter to look at is the size distribution. For connected features, this can be done with a sequence of erosion/dilation operations like in [35] or by using a sphere inscription algorithm [36, 37, 38]. These methods however have their drawbacks and are not really accurate to render the AM cluster fragmentation which is a quite common phenomenon, as illustrated in [20, 21, 22]. EBSD is a convenient technique to image a grain cluster internal structure [39].
In order to assess the size of the NMC clusters, we used an XR tomography volume (raw NMC powder). Then, a simple segmentation threshold, and the use of a 3D watershed algorithm to separate each cluster followed by the computation of an equivalent diameter, allowed us to obtain a 3D characterisation of the cluster size distribution before any electrode fabrication step.
As we saw in section 2, XR tomography was unfortunately not resolved enough to characterise finely the NMC cluster size distribution in the manufactured electrodes. Thus, we have used several SEM images (from each electrode cross-sections) and 2D characterisation methods to: (i) compute an equivalent diame-ter (corrected by 4
π to account for the 2D underestimation) and (ii) manually count the fragmented
and non fragmented NMC clusters. The extent of NMC fragmentation was also addressed by calculating its specific surface area. Finally, the unit grain size and distribution in the NMC clusters, was extracted from
an EBSD map.
From the synchrotron tomography data, one can measure an average NMC cluster diameter of 5µm with a maximum size of about 16µm (Figure S3a). This maximum size cluster is to be related to the hetero-geneities mentioned in section 2 and Figure S1. The particle size distribution can be appreciated by the d10-d90 interval equal to 3.2 to 14.5µm.
The EBSD analysis (see Figure 1) allowed to determine the grain size within the NMC clusters. The re-sulting computed distribution is displayed in Figure S3b and gives a mean equivalent diameter of 0.26µm (d10-d90 interval equal to 0.15 to 1.0µm). This data will be useful to interpret the results detailed in
the following sections.
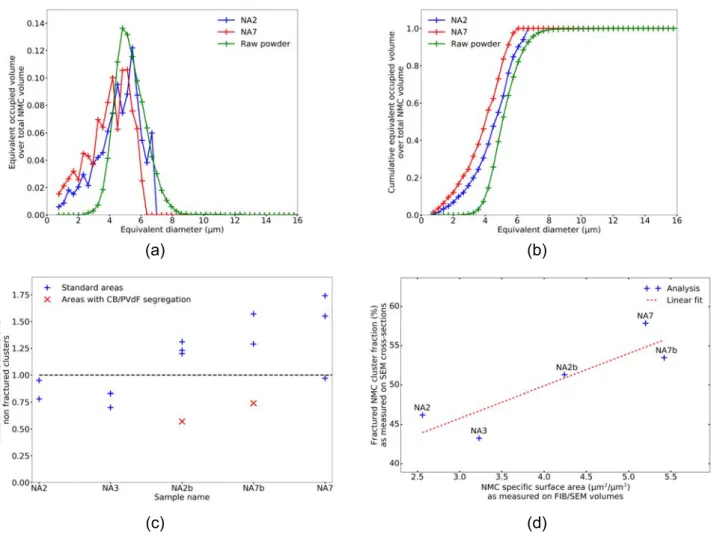
Micrographs of several sample cross-sections are shown in Figure S4. Automated cross-section segmen-tation labelling unfortunately suffers some drawbacks like the introduction of small artificial particles as a side effect of the labelling algorithm and tortured morphology of the fractured NMC clusters. Thus, fil-tering these small particles is important to retrieve more accurate and quantifiable data. Figure 2a-b shows the equivalent volume distribution according to the equivalent cluster diameter after label cleaning for two volumes (NA2 and NA7). This cleaning threshold, set to an equivalent diameter of 0.76µm and controlled by eye verification, emphasised no clear demarcation between artificial splinters and actual particles so that it is very difficult to perform a systematic separation. With this cleaning threshold determined, we checked the total NMC surface percentage lost. It ranged from 2.2% to 6.5% respectively for NA2 and NA7 sample in the selected results. This corresponds to a small part of the NMC volume (from 3 to 8%) and this has no significant consequence on the estimation of the mean equivalent diameter. This however cuts off the distribution presented in Figure 2a below 0.76µm. A more restrictive threshold, representative of the equivalent minimum diameter measured on the raw powder sample, could have been used to extract the unaltered or quasi unaltered, clusters. One clear observation nevertheless is the NMC cluster fragmentation as seen through the mean equivalent diameter reduction when compared to the raw powder.
The ratio of fractured clusters over non fractured ones for each electrode is given in Figure 2c. One can note as a general trend that the more calendered the electrode (NA7 and NA7b case), the more fractured the clusters. There is however a certain result distribution for a given electrode. For NA2b and NA7b, red symbols materialise areas where a large PVdF/CB agglomerate could be observed (cf. Figure S4f and g and section 2). These areas feature less fragmented clusters than the others (Figure S4a to e), which is likely due to the fact that the huge and plastic PVdF/CB agglomerates must accommodate the mechanical
constraints occurring around them during calendering.
In addition, the NMC cluster fragmentation at the macro and local scales can be compared by looking at the fragmented cluster fractions, as observed on the electrodes cross-sections, and the NMC phase specific surface area (total available area) determined from the FIB/SEM volumes. Both parameters are plotted in Figure 2d and appear correlated to the first order with a reasonable dispersion. This indicates that the size of the FIB/SEM volumes is representative of the morphological characteristics of the studied electrodes, such as the degree of fragmentation of the NMC phase, even if the local volume fractions exhibit a variation of ±10% relative to the macroscopic scale.
Some recent simulation works on NMC based electrodes [40] have predicted an important modification of the NMC specific surface area with calendering. However, this modification concurs with a decrease of the NMC specific surface area with calendering, which is the exact opposite trend of the results obtained here on real electrodes. This can be explained by the fact that the simulation results are originating from discrete elements models using perfectly spherical and non porous particles to model NMC clusters. These simulated clusters will then not be mechanically weakened by a hollow structure and cannot be fractured to create some more free surface as it is observed here or in [41].
5
Microstructure characterisation related to ionic wiring
The most common method for connecting the microstructure of an electrode with its ion transport properties is to determine its tortuosity factor T defined by one of the following equations:
Kef f = K0ε
T and Def f = D0 ε
T (1)
with Def f and Kef f the effective diffusivity and conductivity of the electrode, K0 and D0 the bulk
conductivity and diffusivity of the liquid electrolyte, and ε the electrode porosity, which must be in practice wetted by the electrolyte. The tortuosity factor accounts for both the additional (geometrical) length and its change in the velocity of a species when migrating through a porous structure. There are two approaches to determine the tortuosity factor from digitised electrode volumes [28]. The first consists in calculating the geometric tortuosity τ as detailed in [2]. The tortuosity coefficient and the geometric tortuosity are linked by [42]:
T = τ2 (2)
mass transport calculation according to a diffusional process of Fick’s law type [14, 28]. The effective properties are directly given by this numerical simulation and then translated into a tortuosity coefficient. It is commonly accepted that geometric tortuosity underestimates the restrictions on the diffusion of species in the porosity of the electrodes [14, 28]. The approach which mimic mass transport and diffusion behaviour has also its limitations as it does not consider the non uniform electrochemical reaction that occurs during battery operation across the active material / electrolyte interface and ion accumulation or depletion. The geometrical approach provides more insights about the relationships between the tortuosity and the microstructure porosity [2].
This section is focusing on how the different porosities are determined and on the analysis of their vol-ume fractions, percolation (or intraconnectivity) and tortuosities. The contact interfaces between the NMC phase and these different porosities will also be quantified. All these parameters influence the ionic transfers in an electrode.
We identified visually several p orosity t ypes: (i) one made of large micrometric cavities within the pack of NMC clusters; (ii) one occluded in non-fragmented hollow NMC clusters; (iii) one made of nanometric pores within the PVdF/CB mixture and (iv) one made of the cracked grain boundaries within fragmented NMC clusters. Their separation is mainly based, in this study, on the use of the local thickness measurements we have already talked about in section 2. The successive steps are graphically summarised in Figure 3. The first step consists in extracting the enclosed p orosity. To that extent, we used a 3D labelling algorithm, and by excluding the largest label we could assume that we have captured the remaining enclosed porosities. The second step is to compute a local thickness map on the inverse of the NMC phase, i.e. the merge of the porosity and the PVdF/CB mixture. From that, we extracted, with a simple threshold based on a distance/size criterion of 60nm, the regions with the smallest sizes representing the areas where the porosity is confined by the NMC m orphology: NMC cracked grain b oundaries and NMC cluster c ontacts. Enclosed porosities were also subtracted. The third step was to compute another local thickness map, this time on the porosity phase alone. The same 60nm threshold allowed us to extract confined a reas. B y subtracting results from the two previous steps we could extract the porosity confined by the PVdF/CB m ixture. The fourth and last step is to withdraw the results of the previous steps from the total porosity phase to extract the micrometric porosity.
Contact interfaces between NMC and these different porosities were determined as follows. First the NMC phase was extracted and dilated over a 1 voxel distance. Then, the shared voxels between the dilated NMC and one of the porosity types were selected with a boolean operation which gave their interfaces. Fi-nally, a 3D labelling step (using 26 neighbour) was performed to identify them. A marching cube algorithm
allowed to compute each one of these interface areas. This protocol was then repeated for each porosity type.
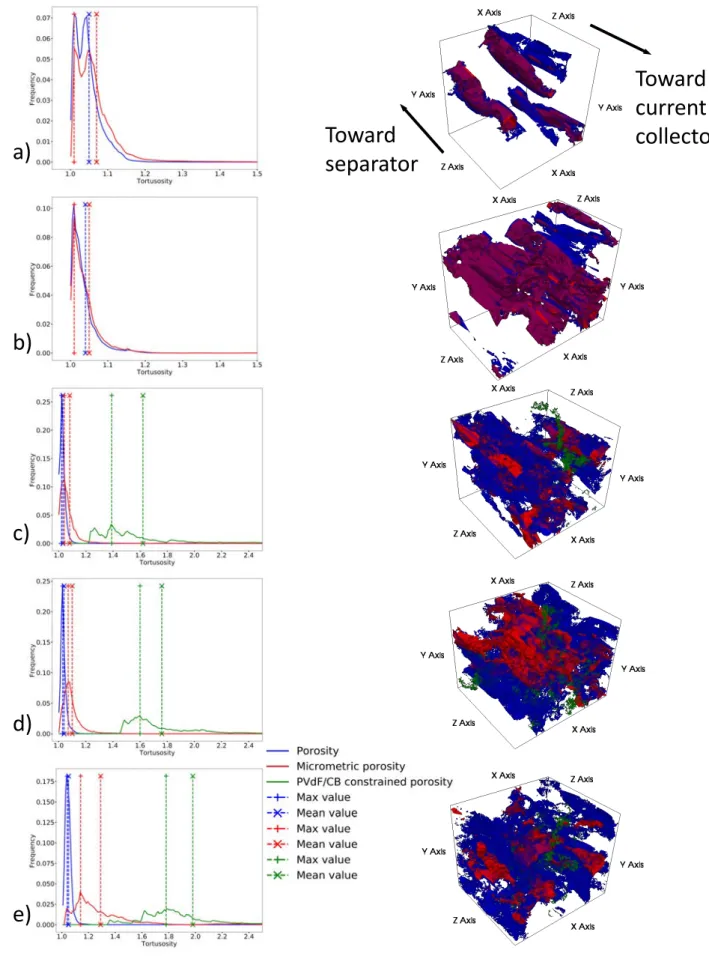
To finish, the intraconnectivity and tortuosity of each porosity type were determined. By definition, the geometric tortuosity is the length of the shortest path between two locations, going only through the phase considered, divided by the straight distance between these two locations. It is then always greater than 1. In this work, two approaches were used. In the first one, like in a previous work [15], the tortuosity was calculated by a front propagation in one direction starting from a seed plane situated in the middle of the volume. The front is only propagated in the phase of interest. For each plane, parallel to the initial one, in the volume the mean distance from the seed plane was calculated. Then, with respect to the straight distance from the initial plane, a linear interpolation allowed us to calculate a mean tortuosity in the phase of interest. Contrarily to what we did in [15] though, we here did not use a voxelised distance but directly an euclidean distance map, obtaining then a better estimation of the tortuosity. This first approach only allows to compute an averaged value of the tortuosity over the whole volume. The second approach enables to characterise a local tortuosity and to find a tortuosity distribution within the volume allowing to highlight the shortest paths (or the more represented ones). This second approach also consists in front propagations. A first front starts from one of the volume faces while the second starts from the opposite one. It results then in two distance maps. By summing the two and dividing the result by the volume length we obtain a map where each voxel of the considered phase is allocated with the tortuosity value of the shortest path that goes through it. We have then a 3D map of the local tortuosity in the volume for one direction, from which we can extract a distribution and a geometric localisation. For both approaches, we choose the propagation direction across the electrode thickness as it is the main direction along which the electrolyte species must diffuse during battery operation. Results concerning this section are gathered in Tables 3 to 5 and Figure 4 and 5.
The micrometric porosity represents the major part of the porosity. It varies from 96% (NA2) to 78% (NA7b) of the total porosity volume fraction and is here always percolated (intraconnectivity above 90%, cf. Table 4). It is also interesting to notice that the more calendered the electrodes, the lower the micro-metric porosity intraconnectivity, hence likely the more curbed the ion diffusion. Closed porosity, for its part, is negligible in all samples. It is interesting to note that the percolated (intraconnected) micrometric porosity varies linearly with the total porosity (see Figure 4).
The porosity confined by the CB/PVdF phase or at cracked grain boundaries within the fragmented NMC clusters and at contact spots between them is logically higher for the
elec-trodes that contain a larger amount of the conductive mixture (NA2b and NA7b) and for the denser electrodes (NA7 and NA7b), reaching more than 15% of the total porosity for NA2b, NA7 and NA7b. The micrometric porosity thus decreases when the electrode density increases as well as when the PVdF/CB content increases. Noteworthy, the open micrometric porosity is slightly overestimated because the algorithms did not allow to separate the micrometric pores at interstices between the NMC clusters from those contained within the fractured NMC clusters, see for example the fractured hollow NMC cluster in Figure 3. This micrometric pore is accessible, in this 2D slice at least, only through narrow chan-nels formed by the cracked grain boundaries. The micrometric porosity intraconnectivity (cf. Table 4) gives nevertheless a good estimation of the open microporosity as by definition micrometric pores, only accessible through nanometric pores, will not be considered as connected to the main feature, i.e. porosity located outside fragmented NMC clusters. The participation of the percolated micrometric porosity to the total porosity varies from 95% for NA3 to 72% for NA7b. It is clear that the micrometric porosity estimation is a function of the threshold value. Here, we considered 60nm as a rea-sonable value, in particular because it excludes all the pores confined in CB/PVdF mixture as well as the pores confined in the fractured boundaries between the NMC grains. The validity of this threshold and of the reported values will be evaluated quantitatively in a future article which will present numerical simulations of the ionic conductivity.
Figure 5, shows all tortuosity histograms for the total, micrometric and CB/PVdF confined porosities with the corresponding 3D local tortuosity maps thresholded in order to extract only the tortuosities around (±1%) the most frequent value, which correspond to the histogram maximum. This representation high-lights the most represented tortuosities and thus the areas that will mainly impact diffusion of electrolyte species. In the microstructures studied here, the micrometric porosity network is, in all cases, percolated. This means that the micrometric porosity is the most efficient and important area for electrolyte species diffusion as it represents the majority of the porosity, percolates and has a low tortuosity. The porosity confined within the PVdF/CB mixture was observed to be fully intraconnected in each PVdF/CB aggregate and thus percolates within the whole sample when this mixture also percolates. This type of porosity dis-plays high and distributed tortuosity values. As it is a minor contributor in volume to the total porosity, it is likely that, contrarily to the micrometric porosity, this CB/PVdF confined porosity has negligible influence on the electrolyte species diffusion at long range across the whole electrode. For samples NA2 and NA3, total (blue curve) and micrometric porosity (red curve) tortuosity histograms are really similar while for the other samples a shift towards lower tortuosity is observed for the total porosity. In addition, one can see in the 3D visualisations Figure 5 that the area extracted for the total porosity (in blue) covers a wider
zone than for the micrometric one (in red). This illustrates the fact that the more confined porosities are widely branched onto the micrometric one, then creating geometrical shortcuts between areas of micromet-ric porosity. However, these “shortcuts” are likely to be inefficient for the transport properties due to their small size and high tortuosity in case of the CB/PVdF areas. Moreover, the larger the confined porosity contribution to the total porosity, the higher the difference between the tortuosity mean value and the tor-tuosity most represented value. This indicates that depending on the morphology and the distribution of the local tortuosity values, a mean tortuosity value may not be enough to finely characterise the transport phenomenon and that it is important to distinguish between the different porosity types when characterising more finely the transport properties in battery electrodes. Overall, this suggests that for ion transport during battery functioning, the electrode effective porosity could be reduced to the percolated micrometric porosity.
Table 5 gathers interconnectivity values between NMC and the other phases. It shows the variety of interfaces the active material may have with its surroundings. Its proportion of exposed surface area to the micrometric porosity, which is where the electrolyte species (and in particular Li+
ions) will be the more available to insertion or deinsertion, varies from 77% to 36%. It naturally has its lower values for the more calendered (more fragmented) and richer in CB/PVdF electrodes. This points out that in such electrodes only less than half of the active mass surface could effectively participate to the electrochemical reaction.
6
Microstructure characterisation related to electronic wiring
There are several approaches to link the electrode effective electronic conductivity to its microstructure and composition. If the active material conductivity is much lower than that of the carbon / polymer mixture, then a conventional percolation approach is applicable [42, 43, 44]. It is then necessary to quantify the con-ductive mixture intra-connectivity in the digitised FIB/SEM volumes which can be analysed by considering the electrode processing conditions, and the active material particles size distribution influence [2, 28]. The active material conductivity is however not systematically negligible [45, 46, 47]. The effective electronic conductivity is then related to the volume fraction and to the active material phase and conductive mixture tortuosities, and to their bulk conductivity [33]. The electrode volumes digitised by X-ray and/or FIB/SEM tomography can be used to determine the effective conductivity with numerical simulations by considering each phase conductivity [15, 48]. This method however neglects the contact resistances between phases, which is problematic [49]. Whether the mixture of carbon with the polymeric binder is percolating or not, the active material connectivity with this electronic conductive mixture considerably influences the perfor-mance [2, 9, 50]. It is therefore interesting to study the conductive mixture distribution in the electrode and
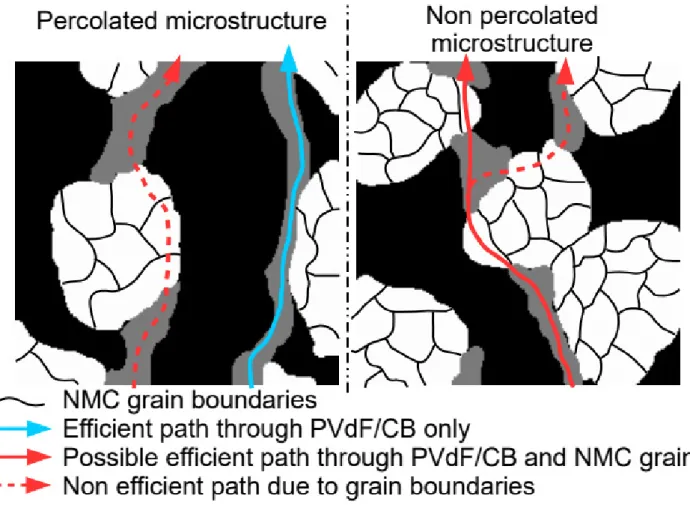
on the active material surface. The PVdF/CB mixture is more conductive by several orders of magnitude than the NMC clusters [15]. Their repartition and extent of percolation will thus greatly impact the effec-tive electronic conductivity. The low conductivity of the NMC clusters is however due to the resiseffec-tive grain boundaries [26]. The NMC grains may have high electronic conductivity the same order of magnitude as the CB/PVdF one. Figure 6 sketches the different conductive paths that can be encountered depending on the CB/PVdF percolation state. The more conductive path is the one that is going only through the CB/PVdF phase, which is enabled when this mixture is percolated, as in NA2b and NA7b. The less conductive path is the one going through both CB/PVdF and NMC clusters (in series), which is expected in non percolated electrodes (NA2, NA3 and NA7). A third path of intermediate conductivity can be postulated that is going through CB/PVdF and NMC grains (in series). If the latter have high electronic conductivity they could operate as conductive bridges between the highly conductive CB/PVdF aggregates to allow for an electronic percolation even if the CB/PVdF mixture is not geometrically percolated. The occurrence of such a path depends on the distribution of the CB/PVdF agglomerates on the NMC cluster surfaces.
Once the different geometric features are properly labelled in a phase, it is possible to extract the min-imal distances between the neighbouring ones. This analysis makes use of a sequential growing of each label also used sometimes to define its influence zone. This label growth can be constrained to only occur in the porosity phase, i.e. the NMC phase is considered as an unalterable one in which the other phases cannot grow. From that, the touching labels are considered as neighbours and the separation distance is extracted from the position of the border between the two labels. Both the growth and separation distance are computed from an euclidean-type distance map and thus the computation does not depend on a con-nectedness parameter as for the 3D labelling. Coupling these calculations to the phase intraconnectivity can provide a deeper/more accurate understanding of the microstructure state concerning percolation. This technique can be used as well to compute the separation distances along the NMC surface. To do so, we computed an euclidean distance map in the porosity to add a new phase in the porosity, with the inalterable properties of the NMC one, leaving only a thin available layer (3 voxels) of porosity along the NMC and CB/PVdF surface. Then, the label growth can be performed and constrained into this thin layer leading to the computation of the shortest distances between two neighbouring PVdF/CB aggregates along the NMC surface. This technique can in some circumstances be unable to separate properly two distinct labels that are very close across porosity. But this specific case is not so common and we believe that it does not impact significantly the results. However, for microstructures with aggregates very finely separated in term of voxel number (similar to the available layer), this method would still need to be improved to be fully quantitative.
By looking at the values in Table 5, it is possible to compare the global interface areas (per unit volumes of NMC) between NMC and CB/PVdF. As expected, increasing the CB/PVdF weight fraction in NAXb electrodes compared to NAX ones leads to an interconnectivity increase between this mixture and the NMC phase. But, this is only true when this parameter is expressed as the ratio of contact surface area (in µm2
) to the volume of NMC (in µm3
). As the CB/PVdF weight fraction is multiplied by 1.5 (from NAX to NAXb) the intraconnectivity in µm2/µm3 is also multiplied on average by 1.4 (comparing NA2 and NA3
with NA2b, and NA7 with NA7b). However, when the interconnectivity is expressed as the fraction of the NMC surface covered by the PVdF/CB mixture, it appears fairly more independent of the PVdF/CB content. This apparent contradiction results to some extent from the different NMC cluster fragmentation state. It was shown previously that, for NMC-based electrodes, an interconnectivity critical value between the NMC phase and the CB/PVdF mixture exists below which the electrochemical performance is limited by an insufficient supply of electrons to the active material. This critical value was determined to be between 3 and 8%. For the electrodes studied here, this interconnectivity is always above 9%, which means their electrochemical performance should not be limited by this aspect.
By taking a closer look at Figure 7a, one can see that each topographic feature on the NMC surface matches a single NMC grain. Interfaces between CB/PVdF aggregates and NMC appear usually separated by one NMC grain. Figure 7b and c displays the distance distribution between neighbouring PVdF/CB aggregates along the NMC cluster surface. The grain size in the NMC clusters determined earlier by EBSD is equal to 258nm (cf. section 4). From the histogram in Figure 7c, we can see that, for NA2 and NA7, respectively, 74% and 57% of the interfaces are separated by this distance or less. This means that electrons could likely be able to transfer through only one NMC grain between two separated NMC and PVdF/CB interfaces. For electrodes NA2b and NA7b respectively 63% and 55% distances are under the NMC grain size. As the PVdF/CB network is percolated in these electrodes it might act as a secondary way-through for the electron depending on the NMC grain conductivity.
An example of 3D visualisation of the interfaces on a single NMC cluster can be seen in Figure 7a with, in red, the interfaces between NMC and CB/PVdF and, in green, the interfaces with other NMC clusters. The remaining surface is then in contact with porosity. These interfaces were identified following the methodology introduced in subsection 5.
7
Discussion
It is common for compositions, measured from images, at a small scale (such as FIB/SEM) to deviate from the overall composition (such as the full electrode one) due to statistical
varia-tions and representativeness [11, 54]. NA2 and NA3 illustrate this pretty well and can be seen like zooms at different locations from the same electrode. Their local NMC composition is indeed richer for NA2 and poorer for NA3 (respectively 70.4% and 61%) than their targeted ones at global scale (64.8%, cf. Table 1). It goes in a similar inverse way for porosity with 24.9% for NA2 and 35% for NA3 against 28% at the overall scale. SEM cross-sections are also highlighting local dispersions in the NMC cluster fragmentation state (cf. Figure 2c). This relates to dispersion in the NMC specific surface area which is higher for NA3 than for NA2 (respectively 3.2 against 2.5µm2/µm3 in FIB/SEM volumes, cf. Table 3). Both volumes
have similar CB/PVdF volume fraction (4.6% for NA2 and 4.1% for NA3). CB/PVdF phase is de facto distributed at the NMC cluster surface, particularly around contact points, which is probably a consequence of the electrode drying mechanism [51]. The consequences of the larger NMC specific surface area in NA3 than in NA2 are that, firstly, the CB/PVdF intracon-nectivity (percolation) is weaker in NA3 (31% against 71% for NA2) and that, secondly, NMC interconnectivity with CB/PVdF is also lower for NA3 (9% against 16% of the specific area for NA2, cf. Table 5. However, the NMC interconnectivity with the percolated micrometric porosity is higher in NA3 than in NA2 as a consequence of the higher porosity in NA3 than in NA2. It can be concluded from this comparison between NA3 and NA2 that the FIB/SEM volumes which have been analysed are not large enough for the values of the microstructural parameters which have been calculated from these volumes to be fully transposable to the whole electrodes from which they are extracted. However, as we saw in the previous sections, they give trends that are representative of the morphological characteristics of the electrodes studied, in relationships with their calendering state and CB/PVdF content.
Conclusion
In this work, we defined a physically driven toolbox to analyse 3D FIB/SEM volumes of electrodes for lithium ion batteries to explore the influence of electrode composition and compaction on the important microstructural parameters for effective electrical properties and electrochemical performance.
The first development focused on particle size distribution and how calendering can affect it. In the high density electrodes more than half of the NMC clusters were fractured by calendering. This results in an increase of about 2 in the NMC specific surface area.
porosity types were highlighted and quantified to characterise in details areas where the ion diffusion should be fast, in the large and connected pores of the micrometric porosity, and where it should be slow and restricted, in the nanometric pores of the confined porosity. An important result is that for long range and fast diffusion of electrolyte species, which is required for fast charging and discharging batteries, the effective electrode porosity may reduce to only the low tortuosity percolated micrometric porosity. Its con-tribution to the total porosity, as well as its intraconnectivity, decrease when the electrode compaction increases (when the total porosity decreases), as a consequence of both the pore closing and the NMC cluster fragmentation, and when the CB/PVdF content increases. The interconnectivity between this micrometric porosity and the NMC phase decreases similarly.
The third development was done to analyse the electronic conductive paths and transfer areas. Atten-tion has been paid on assessing the percolaAtten-tion of the conductive binder throughout the electrode. The CB/PVdF mixture intraconnectivity is naturally increased when increasing its volume frac-tion in the electrode. For these electrodes, the CB/PVdF percolafrac-tion threshold is situated between 7.9 and 10.4% (these volume fractions correspond to NA7 and NA2b respectively). Ways to explore alternative conducting paths when this mixture is not percolated were developed, in par-ticular by looking at the distance separating the CB/PVdF aggregates along the NMC surface. Because the resistive junctions within the NMC phase are the cluster contacts and the grain boundaries, conduction between patches of conductive binders throughout one single NMC grain in a cluster was assessed as it could compensate for the lack of percolation in case of high intrinsic conductivity at the NMC grain level.
This work is focused on LiB electrode microstructures but can easily be extended also to various sets of random multiphase media, whether they are porous or not, depending on conduction phenomena. Other imaging techniques than FIB/SEM can be used too, provided they give sufficient resolution and details on the studied microstructure.
Acknowledgement
We are grateful to the Agence Nationale de la Recherche to the funding of the Pepite project (ANR-15-CE05-0001) and for Zeon’s support during the project.
Table 1: Electrode comparison in volumes, thickness and density from manufacturer data
Name Volume fraction (%) Mass fraction (%) Thickness (µm) Density (g/cm3
) NMC PVdF/CB Porosity NMC PVdF CB NA2 64.8 7.2 28 96 1.8 2.2 81.4 3.2 NA3 64.8 7.2 28 96 1.8 2.2 48.8 3.2 NA7 70.9 7.9 21.2 96 1.8 2.2 74.4 3.5 NA2b 63.6 10.4 26.0 94.2 2.6 3.2 81.4 3.2 NA7b 69.6 11.3 19.1 94.2 2.6 3.2 74.4 3.5
Figure 1: General view for the different scales studied here. Scale 1 is the most global field of view, it can capture the entire electrode thickness and macroscopic elements. In the SEM image, E stands for the electrode and CC for the current collector. Scale 2 is a mesometric field of view accessible from SEM cross-sections allowing a more detailed imaging of the electrode complex microstructure. Scale 3 is the finest scale is this study with the FIB/SEM volumes and EBSD map of the unit grains inside active material clusters (only a zoomed area around one cluster is shown here).
Table 2: Comparison between phase volume fractions measured from FIB/SEM and from manufacturer data. Name Volume fraction (%) Density (gcm−3) NMC CB/PVdF Porosity FIB/SEM Relative variation∗ (%) FIB/SEM Relative variation∗ (%) FIB/SEM Relative varaition∗ (%) NA2 70.4 ±0.1 9 4.6 ±0.2 -35 ±2 24.9 ±0.3 -10 ±2 3.4 NA3 61 ±0.1 -6 4.1 ±0.6 -43 ±7 35 ±0.6 25 ±2 3.0 NA7 68.8 ±0.3 -3 4.6 ±0.3 -41 ±5 26.5 ±0.7 25 ±3 3.4 NA2b 68.4 ±0.2 8 8 ±0.4 -24 ±4 23.7 ±0.5 -9 ±2 3.4 NA7b 72.4 ±0.1 4.0 7.6 ±0.3 -32 ±2 20.1 ±0.4 5 ±2 3.6
∗ Relative to manufacturer data
Table 3: Intraconnectivity values, NMC phase specific surface and mean geometric tortuosity in each studied sample for each phase of interest.
Name Intraconnectivity (%) Mean geometric tortuosity NMC specific surface area (µm2 /µm3 )∗ NMC PVdF/CB Porosity NMC PVdF/CB Porosity NA2 100 71 97 1.06 1.21 1.06 2.6 NA3 96 31 98 1.04 1.26 1.05 3.2 NA7 100 63 98 1.02 1.22 1.04 5.2 NA2b 100 97 98 1.03 1.29 1.04 4.2 NA7b 100 95 99 1.00 1.31 1.05 5.4
∗ Specific surface area includes contacts with the PVdF/CB and all porosities except the closed porosity
(embedded within the clusters)
Table 4: Different porosity types distribution in the whole phase for all samples. The microporosity intra-connectivity was established by considering the size criterion of 60nm. In the 3D volume, a microporosity domain which is connected to the other microporosity domains only by nanoporosity is counted not intra-connected with these.
Sample Total porosity Micrometric porosity (participa-tion to total) (%) Closed porosity (%) Confined porosity (participation to total) (%) Micrometric porosity intraconnectivity (%) Percolated micrometric porosity (participation to total) (%) NA2 24.9 ±0.3 22.7 (92) <1 1.6 ±0.2 (8) 98 22.2 (90) NA3 35.0 ±0.6 33.2 (96) 1.1 ±0.6 (4) 99 32.9 (95) NA7 26.5 ±0.7 21.6 (83) 4.4 ±0.7 (17) 95 20.5 (79) NA2b 23.7 ±0.5 19.6 (84) 3.6 ±0.5 (16) 96 18.8 (81) NA7b 20.1 ±0.4 15.5 (78) 2.6 ±0.4 (22) 92 14.3 (72)
Figure 2: (a) NMC cluster volume distributions as a function of the equivalent cluster diameter (raw powder and NA2 and NA7 electrodes). Distributions are normalised by the sample total cluster volume. (b) Cumulative distributions. (c) Ratio of NMC fractured clusters over non-fractured ones. (d) Fraction of fragmented clusters, from MEB cross sections, as a function of the NMC specific surface (in µm2
/µm3
of NMC) measured from FIB/SEM volumes.
Table 5: Interconnectivity values between NMC and the different contacting elements (porosities or CB/PVdF) for all samples.
Name Interconnectivity (µm
2
/µm3
) Participation to the NMC free surface (%)
Micrometric porosity Porosity confined by NMC / CB/PVdF CB/PVdF Micrometric porosity Porosity confined by NMC / CB/PVdF CB/PVdF NA2 1.4 0.2 / 0.5 0.4 56 10 / 18 16 NA3 2.5 0.1 / 0.3 0.3 77 4 / 10 9 NA7 2.2 1.7 / 0.8 0.5 42 33 / 16 9 NA2b 2.1 0.9 / 0.7 0.5 50 22 / 16 12 NA7b 1.9 2.1 / 0.8 0.6 36 38 / 15 12
Figure 3: Charts explaining the process used to separate the different porosity types. Arrow colours are referring to the porosity type in the final result (image on the right of the top section). Green is for the open/micrometric porosity, blue for the one confined by PVdF/CB and the red phase stands for the porosity
Figure 5: Local tortuosity histograms (left) for total porosity, micrometric porosity and CB/PVdF con-strained one with the corresponding 3D view (regions with values around ±1% of peak value) on the right. a) NA2, b) NA3, c) NA7, d) NA2b et e) NA7b. For 3D view, current collector is on the front face and separator on the back face (cf. arrows). CB/PVdF confined porosity is not represented on NA2 and NA3 volumes as it does not percolate here.
Figure 6: Schematic view of the different electronic conduction path types that can be found in Lithium-ion positive electrodes. White phase stands for the NMC (active material), grey is for PVdF/CB and black represents porosity.
Figure 7: (a) 3D view of one NMC cluster, red patches are interfaces with the CB/PVdF mixture and green ones interfaces with other NMC clusters, the remaining surface is connected to porosity. Scale is in voxel (1voxel = 10x10x10nm3
). Data are from NA2b. (b, c) Minimal distances distribution computed be-tween neighbouring CB/PVdF aggregates along NMC cluster surface (distances bebe-tween NMC / CB/PVdF interfaces).
References
[1] J. Kim, H. Lee, H. Cha, M. Yoon, M. Park, and J. Cho, “Prospect and reality of Ni-rich cathode for commercialization,” Advanced Energy Materials, 8, 1702028 (2018).
[2] N. Besnard, A. Etiemble, T. Douillard, O. Dubrunfaut, P. Tran-Van, L. Gautier, S. Franger, J.-C. Badot, E. Maire, and B. Lestriez, “Multiscale Morphological and electrical characteriza-tion of charge transport limitacharacteriza-tions to the power performance of positive electrode blends for lithium-ion batteries,” Advanced Energy Materials, 7, 1602239 (2017).
[3] C. Heubner, M. Schneider, and A. Michaelis, “Diffusion-limited C-rate: A fundamental princi-ple quantifying the intrinsic limits of Li-ion batteries,” Advanced Energy Materials, 10, 1902523 (2020).
[4] K. G. Gallagher, S. E. Trask, C. Bauer, T. Woehrle, S. F. Lux, M. Tschech, P. Lamp, B. J. Polzin, S. Ha, B. Long, Q. Wu, W. Lu, D. W. Dees, and A. N. Jansen, “Optimizing areal capacities through understanding the limitations of lithium-ion electrodes,” Journal of The Electrochemical Society, 163, A138 (2015).
[5] C. Fongy, A.-C. Gaillot, S. Jouanneau, D. Guyomard, and B. Lestriez, “Ionic vs electronic power limitations and analysis of the fraction of wired grains in LiFePo4 composite electrodes,”
Journal of The Electrochemical Society, 157, A885 (2010).
[6] C. Fongy, S. Jouanneau, D. Guyomard, and B. Lestriez, “Carbon nanofibers improve both the electronic and ionic contributions of the electrochemical performance of composite electrodes,” Journal of Power Sources, 196, 8494 (2011).
[7] A. A. Franco, “Multiscale modelling and numerical simulation of rechargeable lithium ion batteries: concepts, methods and challenges,” RSC Advances, 3, 13027 (2013).
[8] D. Robert, T. Douillard, A. Boulineau, G. Brunetti, P. Nowakowski, D. Venet, P. Bayle-Guillemaud, and C. Cayron, “Multiscale Phase Mapping of LiFePO4-Based Electrodes by
Transmission Electron Microscopy and Electron Forward Scattering Diffraction,” ACS Nano, 7, 10887 (2013).
[9] S. L. Morelly, N. J. Alvarez, and M. H. Tang, “Short-range contacts govern the performance of industry-relevant battery cathodes,” Journal of Power Sources, 387, 49 (2018).
[10] A. Etiemble, N. Besnard, A. Bonnin, J. Adrien, T. Douillard, P. Tran-Van, L. Gautier, J.-C. Badot, E. Maire, and B. Lestriez, “Multiscale morphological characterization of process
induced heterogeneities in blended positive electrodes for lithium–ion batteries,” Journal of Materials Science, 52, 3576 (2017).
[11] D. Kehrwald, P. R. Shearing, N. P. Brandon, P. K. Sinha, and S. J. Harris, “Local tortuosity inhomogeneities in a lithium battery composite electrode,” Journal of The Electrochemical Society, 158, A1393 (2011).
[12] H. Liu, J. M. Foster, A. Gully, S. Krachkovskiy, M. Jiang, Y. Wu, X. Yang, B. Protas, G. R. Goward, and G. A. Botton, “Three-dimensional investigation of cycling-induced microstruc-tural changes in lithium-ion battery cathodes using focused ion beam/scanning electron mi-croscopy,” Journal of Power Sources, 306, 300 (2016).
[13] S. Vierrath, L. Zielke, R. Moroni, A. Mondon, D. Wheeler, R. Zengerle, and S. Thiele, “Mor-phology of nanoporous carbon binder domains in Li-ion batteries – a FIB-SEM study,” Elec-trochemistry Communications, 60, 176 (2015).
[14] F. L. E. Usseglio-Viretta, A. Colclasure, A. N. Mistry, K. P. Y. Claver, F. Pouraghajan, D. P. Finegan, T. M. M. Heenan, D. Abraham, P. P. Mukherjee, D. Wheeler, P. Shearing, S. J. Cooper, and K. Smith, “Resolving the discrepancy in tortuosity factor estimation for Li-ion battery electrodes through micro-macro modeling and experiment,” Journal of The Electrochemical Society, 165, A3403 (2018).
[15] F. Cadiou, A. Etiemble, T. Douillard, F. Willot, O. Valentin, J.-C. Badot, B. Lestriez, and E. Maire, “Numerical prediction of multiscale electronic conductivity of lithium-ion battery positive electrodes,” Journal of The Electrochemical Society, 166, A1692 (2019).
[16] B. L. Trembacki, A. N. Mistry, D. R. Noble, M. E. Ferraro, P. P. Mukherjee, and S. A. Roberts, “Editors’ choice—Mesoscale analysis of conductive binder domain morphology in lithium-ion battery electrodes,” Journal of The Electrochemical Society, 165, 13, E725 (2018).
[17] L. Zielke, T. Hutzenlaub, D. R. Wheeler, C.-W. Chao, I. Manke, A. Hilger, N. Paust, R. Zengerle, and S. Thiele, “Three-phase multiscale modeling of a LiCoO2cathode: Combining
the advantages of FIB-SEM imaging and X-ray tomography,” Advanced Energy Materials, 5, 1401612 (2015).
[18] T. Hutzenlaub, S. Thiele, N. Paust, R. Spotnitz, R. Zengerle, and C. Walchshofer, “Three-dimensional electrochemical Li-ion battery modelling featuring a focused ion-beam/scanning electron microscopy based three-phase reconstruction of a LiCoO2 cathode,” Electrochimica
[19] M. E. Ferraro, B. L. Trembacki, V. E. Brunini, D. R. Noble, and S. A. Roberts, “Electrode mesoscale as a collection of particles: Coupled electrochemical and mechanical analysis of NMC cathodes,” Journal of The Electrochemical Society, 167, 013543 (2020).
[20] M. Ebner, D.-W. Chung, R. E. García, and V. Wood, “Tortuosity anisotropy in lithium-ion battery electrodes,” Advanced Energy Materials, 4, 1301278 (2014).
[21] T. Rajendra, A. N. Mistry, P. Patel, L. J. Ausderau, X. Xiao, P. P. Mukherjee, and G. J. Nelson, “Quantifying transport, geometrical, and morphological parameters in li-ion cathode phases using X-ray microtomography,” ACS Applied Materials & Interfaces, 11, 19933 (2019).
[22] G. Nelson, L. Ausderau, S. Shin, J. Buckley, A. Mistry, P. Mukherjee, and V. De Andrade, “Transport-geometry interactions in Li-ion cathode materials imaged using X-ray nanotomog-raphy,” Journal of The Electrochemical Society, 164, A1412 (2017).
[23] B. Song, T. Sui, S. Ying, L. Li, L. Lu, and A. M. Korsunsky, “Nano-structural changes in Li-ion battery cathodes during cycling revealed by FIB-SEM serial sectioning tomography,” Journal of Materials Chemistry A, 3, 18171 (2015).
[24] S. Xia, L. Mu, Z. Xu, J. Wang, C. Wei, L. Liu, P. Pianetta, K. Zhao, X. Yu, F. Lin, and Y. Liu, “Chemomechanical interplay of layered cathode materials undergoing fast charging in lithium batteries,” Nano Energy, 53, 753 (2018).
[25] Y. Yang, R. Xu, K. Zhang, S.-J. Lee, L. Mu, P. Liu, C. K. Waters, S. Spence, Z. Xu, C. Wei, D. J. Kautz, Q. Yuan, Y. Dong, Y.-S. Yu, X. Xiao, H.-K. Lee, P. Pianetta, P. Cloetens, J.-S. Lee, K. Zhao, F. Lin, and Y. Liu, “Quantification of heterogeneous degradation in Li-ion batteries,” Advanced Energy Materials, 9, 1900674 (2019).
[26] K. A. Seid, J. C. Badot, O. Dubrunfaut, M. T. Caldes, N. Stephant, L. Gautier, D. Guy-omard, and B. Lestriez, “Multiscale electronic transport in Li1+xNi1/3−uCo1/3−vMn1/3−wO2:
a broadband dielectric study from 40 Hz to 10 GHz,” Physical Chemistry Chemical Physics, 15, 19790, (2013).
[27] P.-E. Cabelguen, D. Peralta, M. Cugnet, J.-C. Badot, O. Dubrunfaut, and P. Mailley, “Rational analysis of layered oxide power performance limitations in a lithium battery application,” Advanced Sustainable Systems, 1, 1700078 (2017).
[28] B. Tjaden, D. J. L. Brett, and P. R. Shearing, “Tortuosity in electrochemical devices: a review of calculation approaches,” International Materials Reviews, 63, 47 (2018).
[29] D. E. Stephenson, B. C. Walker, C. B. Skelton, E. P. Gorzkowski, D. J. Rowenhorst, and D. R. Wheeler, “Modeling 3d microstructure and ion transport in porous li-ion battery electrodes,” Journal of The Electrochemical Society, 158, A781 (2011).
[30] E. Panabière, J.-C. Badot, O. Dubrunfaut, A. Etiemble, and B. Lestriez, “Electronic and ionic dynamics coupled at solid–liquid electrolyte interfaces in porous nanocomposites of carbon black, poly(vinylidene fluoride), and gamma-alumina,” The Journal of Physical Chemistry C, 121, 8364 (2017).
[31] T. Prill, K. Schladitz, D. Jeulin, M. Faessel, and C. Wieser, “Morphological segmentation of FIB-SEM data of highly porous media,” Journal of Microscopy, 250, 77 (2013).
[32] Z. Liu, J. Scott Cronin, Y.-c. K. Chen-Wiegart, J. R. Wilson, K. J. Yakal-Kremski, J. Wang, K. T. Faber, and S. A. Barnett, “Three-dimensional morphological measurements of LiCoO2
and LiCoO2/Li(Ni1/3Mn1/3Co1/3)O2lithium-ion battery cathodes,” Journal of Power Sources,
227, 267 (2013).
[33] G. Inoue and M. Kawase, “Numerical and experimental evaluation of the relationship be-tween porous electrode structure and effective conductivity of ions and electrons in lithium-ion batteries,” Journal of Power Sources, 342, 476 (2017).
[34] S. Cooper, D. Eastwood, J. Gelb, G. Damblanc, D. Brett, R. Bradley, P. Withers, P. Lee, A. Marquis, N. Brandon, and P. Shearing, “Image based modelling of microstructural het-erogeneity in LiFePo4 electrodes for Li-ion batteries,” Journal of Power Sources, 247, 1033
(2014).
[35] E. Maire, P. Colombo, J. Adrien, L. Babout, and L. Biasetto, “Characterization of the mor-phology of cellular ceramics by 3d image processing of X-ray tomography,” Journal of the European Ceramic Society, 27, 1973 (2007).
[36] S. Thiele, R. Zengerle, and C. Ziegler, “Nano-morphology of a polymer electrolyte fuel cell catalyst layer—imaging, reconstruction and analysis,” Nano Research, 4, 849 (2011).
[37] L. Holzer, D. Wiedenmann, B. Münch, L. Keller, M. Prestat, P. Gasser, I. Robertson, and B. Grobéty, “The influence of constrictivity on the effective transport properties of porous layers in electrolysis and fuel cells,” Journal of Materials Science, 48, 2934 (2013).
[38] R. Scipioni, P. S. Jørgensen, D.-T. Ngo, S. B. Simonsen, Z. Liu, K. J. Yakal-Kremski, H. Wang, J. Hjelm, P. Norby, S. A. Barnett, and S. H. Jensen, “Electron microscopy investigations of
changes in morphology and conductivity of LiFePO4/C electrodes,” Journal of Power Sources,
307, 259 (2016).
[39] J. R. Wilson, J. S. Cronin, S. A. Barnett, and S. J. Harris, “Measurement of three-dimensional microstructure in a LiCoO2 positive electrode,” Journal of Power Sources, 196, 3443 (2011).
[40] C. Sangrós Giménez, B. Finke, C. Schilde, L. Froböse, and A. Kwade, “Numerical simulation of the behavior of lithium-ion battery electrodes during the calendaring process via the discrete element method,” Powder Technology, 349, 1 (2019).
[41] M. Ebner, F. Geldmacher, F. Marone, M. Stampanoni, and V. Wood, “X-ray tomography of porous, transition metal oxide based lithium ion battery electrodes,” Advanced Energy Materials, 3, 845 (2013).
[42] N. Epstein, “On tortuosity and the tortuosity factor in flow and diffusion through porous media,” Chemical Engineering Science, 44, 777 (1989).
[43] J.-C. Badot, E. Ligneel, O. Dubrunfaut, D. Guyomard, and B. Lestriez, “A multiscale descrip-tion of the electronic transport within the hierarchical architecture of a composite electrode for lithium batteries,” Advanced Functional Materials, 19, 2749 (2009).
[44] D. Guy, B. Lestriez, R. Bouchet, and D. Guyomard, “Critical role of polymeric binders on the electronic transport properties of composites electrode,” Journal of The Electrochemical Society, 153, A679 (2006).
[45] D. R. Nevers, S. W. Peterson, L. Robertson, C. Chubbuck, J. Flygare, K. Cole, and D. R. Wheeler, “The effect of carbon additives on the microstructure and conductivity of alkaline battery cathodes,” Journal of the Electrochemical Society, 161, A1691 (2014).
[46] H. Kondo, H. Sawada, C. Okuda, and T. Sasaki, “Influence of the active material on the electronic conductivity of the positive electrode in lithium-ion batteries,” Journal of The Elec-trochemical Society, 166, A1285 (2019).
[47] S. W. Peterson and D. R. Wheeler, “Direct measurements of effective electronic transport in porous li-ion electrodes,” Journal of The Electrochemical Society, 161, A2175 (2014).
[48] A. M. Grillet, T. Humplik, E. K. Stirrup, S. A. Roberts, D. A. Barringer, C. M. Snyder, M. R. Janvrin, and C. A. Apblett, “Conductivity degradation of polyvinylidene fluoride composite binder during cycling: Measurements and simulations for lithium-ion batteries,” Journal of The Electrochemical Society, 163, A1859 (2016).
[49] H. Kikukawa, K. Honkura, and M. Koyama, “Influence of inter-particle resistance between ac-tive materials on the discharge characteristics of the posiac-tive electrode of lithium ion batteries,” Electrochimica Acta, 278, 385 (2018).
[50] S. Hein, T. Danner, D. Westhoff, B. Prifling, R. Scurtu, L. Kremer, A. Hoffmann, A. Hilger, M. Osenberg, I. Manke, M. Wohlfahrt-Mehrens, V. Schmidt, and A. Latz, “Influence of con-ductive additives and binder on the impedance of lithium-ion battery electrodes: Effect of morphology,” Journal of The Electrochemical Society, 167, 013546 (2020).
[51] M. Dadkhah and E. Tsotsas, “Study of the morphology of solidified binder in spray fluidized bed agglomerates by X-ray tomography,” Powder Technology, 264, 256 (2014).
[52] W. Bauer and D. Nötzel, “Rheological properties and stability of NMP based cathode slurries for lithium ion batteries,” Ceramics International, 40, 4591 (2014).
[53] Y.-S. Park, E.-S. Oh, and S.-M. Lee, “Effect of polymeric binder type on the thermal stability and tolerance to roll-pressing of spherical natural graphite anodes for li-ion batteries,” Journal of Power Sources, 248, 1191 (2014).
[54] S. J. Haris and P. Lu, “Effects of inhomogeneities—nanoscale to mesoscale—on the durability of Li-ion batteries,” The Journal of Physical Chemistry C, 117, 6481 (2013).