HAL Id: hal-02170550
https://hal.archives-ouvertes.fr/hal-02170550
Submitted on 2 Jul 2019
HAL is a multi-disciplinary open access
archive for the deposit and dissemination of
sci-entific research documents, whether they are
pub-lished or not. The documents may come from
L’archive ouverte pluridisciplinaire HAL, est
destinée au dépôt et à la diffusion de documents
scientifiques de niveau recherche, publiés ou non,
émanant des établissements d’enseignement et de
Romina Eramo, Florent Marchand de Kerchove, Maximilien Colange, Michele
Tucci, Julien Ouy, Hugo Bruneliere, Davide Ruscio
To cite this version:
Romina Eramo, Florent Marchand de Kerchove, Maximilien Colange, Michele Tucci, Julien Ouy, et
al.. Model-driven Design-Runtime Interaction in Safety Critical System Development: an Experience
Report. The Journal of Object Technology, Chair of Software Engineering, 2019, The 15th European
Conference on Modelling Foundations and Applications, 18 (2), pp.1:1-22. �10.5381/jot.2019.18.2.a1�.
�hal-02170550�
Model-driven Design-Runtime
Interaction in Safety Critical System
Development: an Experience Report
Romina Eramo
3Florent Marchand de Kerchove
1Maximilien Colange
2Michele Tucci
3Julien Ouy
2Hugo Bruneliere
1Davide Di Ruscio
31. IMT Atlantique, LS2N (CNRS) & ARMINES, France
{hugo.bruneliere,florent.marchand-de-kerchove}@imt-atlantique.fr 2. CLEARSY, France
{maximilien.colange,julien.ouy}@clearsy.com 3. University of L’Aquila, Italy
{davide.diruscio,romina.eramo,michele.tucci}@univaq.it
Abstract Automotive, aerospace, industrial control, and railway systems are examples of application domains which are particularly characterized by the need for developing and managing critical systems. Model-driven engineering is recognized as an effective solution to leverage abstraction and automation while developing complex systems. One of the major and key challenges in the model-driven engineering of critical software systems is the integration of design and runtime aspects. Even though several methods and tools are available for performing measurements of runtime properties, the ability to trace them with design models is still limited. In the context of a real railway system, this paper presents a model-based approach that has been conceived to analyze runtime data (coming from different sensors), to produce corresponding traceability models and to automatically infer from them potential design issues that might need to be fixed in order to solve detected system malfunctionings.
Keywords Model-Driven Engineering; Critical Systems; Design; Runtime; Interactions; Traceability
1
Introduction
Nowadays complex systems are predominant in several domains, such as automotive, health-care, aerospace, industrial control and automation [Boc04]. In this context, Model-Driven Engineering (MDE) has emerged as an effective solution to leverage
abstraction and automation [Sch06]. Among other things, it notably provides auto-mated transformation and generation techniques which allow increasing productivity and reducing time to market. It also provides analysis, validation and simulation techniques that increase the overall quality of the developed system. However, most of the current model-based solutions still need to be further developed to 1) scale-up for real-life industrial projects and 2) provide significant benefits at execution time.
Indeed, one of the major open challenges is to achieve an efficient integration between the design and runtime aspects of the concerned systems: the system behavior at runtime has to be better matched with the original system design in order to understand critical situations that may occur, as well as corresponding potential failures in design [BEG+18]. Methods and tools already exist for monitoring system execution and performing measurements of some runtime properties. However, many of them do not rely on models and, usually, do not allow a relevant integration with corresponding design models.
The European MegaM@Rt2 project1notably intends to address such issues. As part of its continuous system engineering approach [ABD+18], the project aims at
providing a runtime-design time feedback loop that could be deployed and used in different industrial domains. Among other benefits, such a feedback from runtime-level to (architectural) design-level allows software engineers to control and manipulate elements they would not be able to access otherwise.
This paper reports on a practical experience of using a model-based approach and related techniques to deal with the interactions between design time and runtime in the development of a safety-critical software system. Notably, the novelty resides in the combination of different complementary solutions for model traceability and model views in order to provide support for such a practical use case. Using the proposed approach, we also show how we can automatically infer some design deviations, and identify elements affected by these deviations, from a possibly large spectrum of runtime system configurations or conditions.
The reported model-based experiment is based on an real industrial use case, a Railway system developed by CLEARSY2, one of the industrial partners of the MegaM@Rt2 project. In this context, CLEARSY aims at improving the robustness of its system by integrating the use of model-based techniques in its development cycle. Their goal is 1) to determine whether environmental conditions are met, and 2) to detect variations in the behaviour of the system in order to anticipate on possible failures.
In this paper, we propose both a conceptual model-based approach and an imple-menting solution that relies on Eclipse and EMF3-based tools. The core components
of our solution are 1) the definition of correspondences between design and runtime elements (as traceability models), and 2) the building of related views aggregating design and runtime models in a transparent way. To this intent, our implementation leverages the existing JTL [CDREP10] and EMF Views [BPWC15] tools.
This paper is structured as follows: Section 2 describes the platform screen doors control case study, as the main motivation for this work. Then, Section 3 introduces the general model-based approach we propose to address the issue of design-runtime traceability for improving such a system. Section 4 presents our Eclipse/EMF-based implementation of this approach, and how we applied this solution to the case study.
1MegaM@Rt2 project: https://megamart2-ecsel.eu/ 2https://www.clearsy.com/en/
Section 5 discusses the benefits and current limitations of the proposed solution. Section 6 describes related work while Section 7 concludes the paper.
2
The Platform Screen Doors Control Case Study
The work is motivated by a practical use case proposed by CLEARSY in the context of the MegaM@Rt2 project. The Coppilot system4 is a controller for platform screen
doors that has been deployed on several subway lines across the world. It is a typical example of a complex life-critical system and its role is to ensure that platform screen doors never open at a time when passengers’ lives may be at risk (e.g., absence of train, moving train, etc.).
A Coppilot system usually manages a metro, tram or train station. It uses a pair of lidars (Laser Imaging Detection and Ranging) at each extremity of the platform to measure the position and speed of trains entering the station, and one lidar over each door of the vehicle that detects the movement of the doors. On top of the lidars, several computation units are dispatched, one for each lidar that runs image processing algorithms and a central one that calculates the safety critical outputs, i.e. opening authorization for each platform doors.
Although certification authorities often require the use of formal methods to develop such critical systems, there are both economical and technical issues reducing the possibilities to formally validate all the components of the system. As a consequence, one common strategy to develop such critical systems is to structure them around 1) a safety core component that is formally validated and that provides the outputs of the system, and 2) a set of satellite components for which formal methods are not (or barely) used. The safety core must consider all the other components as unreliable (i.e. without any assumption that they will behave as expected). In Coppilot, the safety core is run by the central calculator and the lidar computation units are the satellite components.
This strategy allows to decouple the safety analysis from the software development. The safety analysis identifies both the nominal (intended and expected) behavior of the system and the defective behavior caused by the unsafe components. As a result, a list of safety requirements is obtained and have to be implemented into the safety core. The formal methods used to develop the software then provide a formal proof that of the correct implementation of those safety requirements. In Coppilot, the safety core has been developed and certified by using the B method5, formally ensuring that the final implementation satisfies all the safety requirements. According to the safety analysis, the system is required to take a fallback position as soon as a life-endangering situation becomes possible. Examples of situations that require entering (or moving to) a fallback position may be sensor inconsistencies, failures, or data/message corruption. Different fallback position situations require different kinds of intervention (e.g. the system could be manually restarted or it could automatically restore its previous state) In order to obtain a balanced trade-off between safety and availability, we aim at reducing fallback position occurrences. Some occurrences are legitimate and are part of the nominal operation of the system. Although unavoidable, they are rare enough to have little impact on the overall availability of the system (e.g. hardware failures or exceptional temporary conditions). Moreover, other fallback situations may be caused by design defects. For instance, a recurring fallback situation may be the result of an
4Coppilot system:https://www.coppilot.fr/en/coppilot-system/ 5B method:https://www.methode-b.com/en/
overly conservative safety analysis and significantly reduce the system availability. In order to detect and resolve such defects, the system need to be tested in operational conditions. In this context, the information collected at runtime play a key role. In fact, linking (runtime) logs that point out fallback situations back to the corresponding (design) safety requirements can help engineers in taking the appropriate corrective
actions (e.g., maintenance, bug tracking or safety analysis review).
2.1
Current log analysis practice
CLEARSY collected hundreds of gigabytes of logs over several months of system operation. The monitoring infrastructure had access to the messages exchanged in the system and to the components’ states. Logs are stored in comma-separated values files and are manually analyzed in a spreadsheet processor.
The logs analysis is performed by initially identifying all the occurrences of fallback. The cause of fallback is analyzed by considering that one of the last events has usually triggered a transition that led the automaton in a wrong position. Discovering such events may require to track back to a huge number of log items to find an explanation to the defect. To this intent, system engineers require some support in order to facilitate their exploitation work.
2.2
A concrete example
As show in Listing 1, logs are composed of a set of events with a timestamp. Each event refers to a specific automaton and reports the value of variables from sensors.
1 [...] 2 20161017_231136106;u;dbg;192.168.10.101;1;0;M11.LogiqueSecu.Algo_DonneesUtiles__Position_M21;33139 3 20161017_231136106;u;dbg;192.168.10.101;1;0;M11.LogiqueSecu.Algo_DonneesUtiles__Position_M24;33116 4 20161017_231136106;u;dbg;192.168.10.101;1;0;M11.LogiqueSecu.Algo_DonneesUtiles__Vitesse_M21;6 5 20161017_231136106;u;dbg;192.168.10.101;1;0;M11.LogiqueSecu.Algo_DonneesUtiles__Vitesse_M24;2 6 [...] 7 20161017_231136377;u;dbg;192.168.10.101;1;0;M11.LogiqueSecu.Algo_DonneesUtiles__Position_M24;32766 8 20161017_231136377;u;dbg;192.168.10.101;1;0;M11.LogiqueSecu.Algo_DonneesUtiles__Vitesse_M21;0 9 20161017_231136377;u;dbg;192.168.10.101;1;0;M11.LogiqueSecu.Algo_DonneesUtiles__Vitesse_M24;1 10 [...] 11 20161017_231136480;u;dbg;192.168.10.101;1;0;M11.LogiqueSecu.Algo_DonneesUtiles__Position_M24;33117 12 20161017_231136480;u;dbg;192.168.10.101;1;0;M11.LogiqueSecu.Algo_DonneesUtiles__Vitesse_M24;65535 13 20161017_231136480;u;dbg;192.168.10.101;1;0;M11.LogiqueSecu.Algo_DonneesUtiles__fallback_M11;inconsistent_position 14 [...]
Listing 1 – A sample of raw log
Checking position consistency is one of the functions provided by the safety core to ensure that sensors report correct values. When a train has stopped at the right position, each sensor should report its position as zero. In real cases, sensors may not correctly report the real position of the train; this may be caused by slow buffer, delay in the communication network, or a displacement of the laser. The system tolerates such inconsistency within a specified threshold limit value.
The raw logs in this Listing 1 show a fallback due to inconsistent position data that occurs at timestamp 231136480 (see Line 13). This inconsistency is caused by the sensors reporting positions that differ more than a specified threshold (in the current model it is 372 millimeters). The positions that have to be considered are the ones that precede the fallback events; in fact, Sensor M21 reports a position of 33139 (timestamp 231136106, Line 2) and Sensor M24 reports a position of 32766 (timestamp 231136377, Line 7).
Currently, this fallback would be analyzed by hand by looking at the last position data communicated by the sensors. Those positions can be located a few lines above
the fallback (as for position of M24) or dozens of lines above. Having the ability to automatically detect the fallback and associate the values reported by the sensors causing it, as well as their timestamps, would considerably simplify the log analysis process. System engineers would be oriented more quickly towards the appropriate corrective actions, such as maintenance, bug tracking, or safety analysis review.
3
Exploiting Design-Runtime Model-driven Traceability for
Sys-tem Improvement
As an answer to the problem described in the previous section, we propose a model-based approach that facilitates the establishment and exploitation of correspondences between design and runtime elements of a system. In particular, the system behavior at runtime is monitored, logged and then related to the initial system design whenever appropriate. The final objective is to connect fallback critical situations (at runtime) with their corresponding potential causes (in the system design and runtime). We specify design-runtime correspondences by means of a traceability model that links design and runtime information. These correspondences, along with the design and runtime models, are used as input to an integrated view that transparently relates the runtime logs with the initial system design. Navigating and querying this view can help the system engineer to discover fallback situations, identify their causes without manually analyzing very verbose logs, and navigate back to related safety requirements.
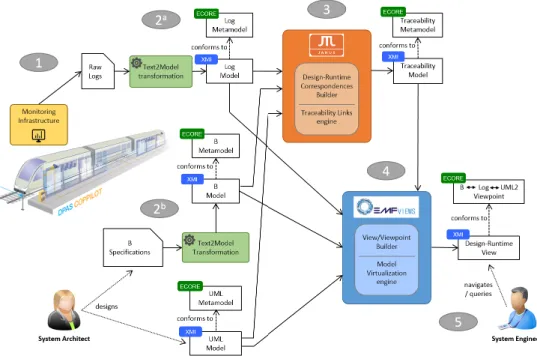
Figure 1 – Our Overall Model-based Approach (full-line arrows for the data/model flow)
Figure 1 depicts the overall approach proposed as an answer to our motivating case study from Section 2. Components developed specifically for this experiment, and existing solutions that had to be extended, are underlined in the figure. Note that the proposed approach can be considered as a model-based instantiation (relying
on traceability models as a "knowledge base") of the well-known MAPE-K loop, that is frequently used in the context of self-adaptive systems for instance [ARS15]. The main steps of our approach are the following:
1. Monitoring. The considered system first has to be correctly instrumented in order to generate usable traces of its runtime execution. In practice, execution traces are often serialized in specific and (semi-)structured textual formats (e.g. comma-separated values). However, for large volumes of data, a binary format may be more efficient (e.g. the Common Trace Format (CTF) standard [CTF]). In any case, the runtime traces must contain the relevant information required to later relate the runtime events with design elements. Moreover, we considered UML diagrams 6describing a static view of the system.
2. Discovering design and runtime models. When not already stored as models that conform to an explicit metamodel, the design and runtime artefacts (requirements specification, runtime traces, etc.) should be converted to models. This may require specifying corresponding metamodels if not available. In our approach, we specified both the Log Metamodel that describes the runtime traces and the B Metamodel that covers B specifications (see Log Model and B Model in Figure 1, respectively). To convert runtime traces and B specifications into models, we use metamodel-driven model discoverers [BCDM14].
3. Computing design-runtime traceability links. Once the design and run-time models are available, they can be linked together in several ways. We use traceability relationships [PDK+11] which have been designed to help users understand associations and dependencies of heterogeneous models. In MDE, a traceability link is a relationship between one or more source model elements and one or more target model elements, whereas a trace model is a structured set of traceability links, e.g., between source and target models. For some previously-identified cases, this can be performed automatically thanks to the definition of a list of patterns (using an appropriate formalism or language) to be detected from the analyzing the runtime data. Thus, the generated traceability model relates together the previously obtained runtime and design models according to these defined patterns [ACD+19].
4. Building the design-runtime view. In order to provide a transparent and integrated access to the runtime-design traceability information, we build a model view [BBCW17] based on the previously obtained runtime, design and traceability models. This view acts as a “virtual” model that refers to these input models and connects them together according to the traceability information computed in the previous step. It has to be able to handle possibly large input models (e.g. verbose runtime traces) [BMdKDC18]. Moreover, it is important to note that this view conforms to a viewpoint that specifies how the different corresponding metamodels (B, Log and UML in our present case) are interconnected together. Such a viewpoint can also filter the element types that are not required by the users/engineers for the targeted engineering activities.
5. Navigating and querying the design-runtime view. The view is an in-tegrated interface provided to the system engineer in charge of analyzing and diagnosing the system. It offers a single entry point to the engineer, thus hiding
Figure 2 – Implementation of our Model-based Approach from Figure 1
the unnecessary complexity of the individual models (including the Traceability one) contributing to the view. From the view, the engineer can transparently navigate and query all the information relevant to the system, its runtime behav-ior and design specification. She/he can notably specify her/his own particular queries, and also rely on predefined libraries of queries that are adaptable in the context of her/his scenario. This way, the view can be used to diagnose the system and conduct its evolution (in collaboration with the system architect for example).
In this approach, when the system engineer wants to build a view on another runtime trace, only two steps need to be run again: first building a model from the new trace (2a), then recomputing the traceability links (3). The view can then be navigated and queried accordingly.
If the engineer wants to analyze a new fallback situation, then the only change required is to add a pattern for this fallback in the traceability link computation step (3). If the view should contain more information, e.g. specific to this new fallback situation, then the view configuration should be altered, or a new view should be created to reflect the updated situation (step 4).
4
Experiences on Building and Using a Model-based Solution
An overview of our technical solution, implementing the approach from Section 3, is depicted in Figure 2. The large orange and blue boxes represent the model-driven frameworks that have been used to build the traceability links and related model views. They are:
- JTL (Janus Transformation Language) [CDREP10], an Eclipse EMF-based tool realized to maintain consistency between software artifacts. Its constraint-based
and relational model transformation engine is specifically tailored to support bidirectionality, change propagation and traceability between software artefacts. - EMF Views [BPWC15], an Eclipse plugin allowing to aggregate several (hetero-geneous) models together in a view. A view can contain virtual associations that do not exist in any input model, and that can be used to link elements coming from different related models. Elements from input models can also be filtered out, making views useful for presenting information to the end user.
The Monitoring Infrastructure that has been used to monitor the system under analysis is represented by the yellow box in the left part of the figure. Both the design artifacts and the runtime data need to be mapped in their corresponding model-based representation (in Ecore format). Thus, Log models and B models have been automatically obtained by means of model discoverers implemented as Text2Model Transformations (as represented by the green boxes in the figure). Whereas, the UML component diagram that we used in the experiments has been directly modeled by the system architect within EMF. The main steps of our approach, as previously introduced in Section 3, have been implemented as follows7.
4.1
Monitoring the considered system
The CLEARSY monitoring infrastructure is realized by means of a specific monitoring system connected to Coppilot. The monitoring system is able to collect messages exchanged by components as well as memory dumps of the safety core. In particular, such raw logs represent the output data produced by the safety core and consist of concatenations of binary messages, time-stamped by the sensors, and arrays of internal variables of the safety core.
For the purpose of this collaboration, a simplified public version of the safety core specification has been produced by CLEARSY engineers, still in the B language. This specification is voluntarily simpler than the original one and implements fewer safety properties. CLEARSY collected the raw logs used in this experiment by animating this new version of the B specification of the safety core and using the previously described monitoring infrastructure.
4.2
Discovering design and runtime models
The collected runtime information and the system design need to be integrated in the EMF-based environment and translated into EMF artifacts. In this step, we describe how raw logs and the B specification are automatically transformed into EMF-compatible models that conform to metamodels specified in Ecore. Once it is set up a first time with our support, this process can be run again by CLEARSY as many times as needed. We also describe how we manually created the UML component diagram from an informal architecture design provided by CLEARSY.
4.2.1 From raw logs to Log models
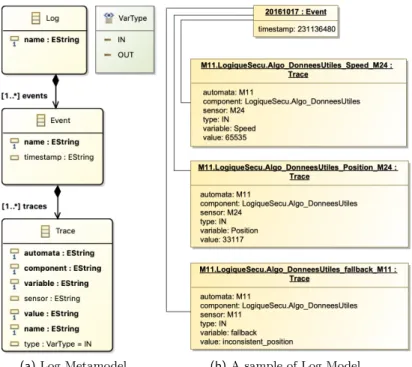
The raw logs obtained from the infrastructure described in the previous section have to be specified by means of a model-based representation. To this aim, we have defined a dedicated metamodel, as depicted in Fig. 3a. It starts with Log, which is the root element of a log model. A Log stores Event s that are characterized by a name and the timestamp. Each Event contains a set of Trace elements that stores the following
(a) Log Metamodel (b) A sample of Log Model
Figure 3 – Model-based representation of logs
information: automata name, component name, sensor name, variable name and its value, and type that can be input IN or output OUT.
Figure 3b depicts a sample of a Log Model that represents the original logs shown in Listing 1. For instance, the Event (with name 20161017 ) represents one of the event in Listing 1 and is composed of three Traces that refer to the automata M11. In particular, the first one refers to the sensor M24 and to the variable Speed, the second one refers to the sensor M24 and to the variable Position, whereas the last one refers to the variable fallback with value inconsistent_position.
The Log model (in XMI format) that conform to the Log Metamodel is auto-matically generated from the original raw log by an automatic Java text to model transformation.
4.2.2 From the B specification to B models
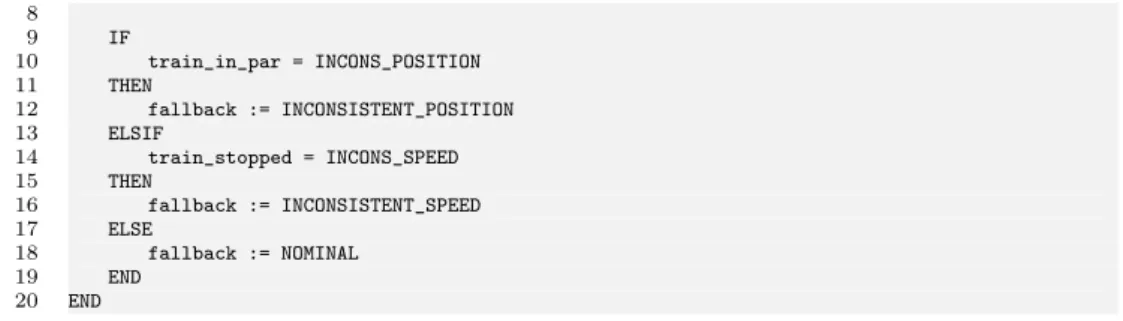
The safety core of the Coppilot system, which contains the logic for detecting and triggering fallback situations, is written in the B language [Abr05]. For this experiment, we focused on a simplified version of this safety core, which comprises 640 lines of B specification across 11 files, while retaining the ability to trigger fallback situations that we are interested in. The excerpt in Listing 2 shows a simple operation that can trigger different fallback situations (inconsistent position or speed) depending on the state of other components.
1 fallback <-- aopp_authorization = 2 VAR
3 train_in_par, train_stopped, doors_opening 4 IN
5 train_in_par <-- is_train_in_par; 6 train_stopped <-- is_train_stopped; 7 doors_opening <-- are_doors_opening;
8 9 IF 10 train_in_par = INCONS_POSITION 11 THEN 12 fallback := INCONSISTENT_POSITION 13 ELSIF 14 train_stopped = INCONS_SPEED 15 THEN 16 fallback := INCONSISTENT_SPEED 17 ELSE 18 fallback := NOMINAL 19 END 20 END
Listing 2 – Excerpt of B specification from the simplified safety core.
In order to include the B specification in the view intended for the system engineer, we need to turn this B specification into an EMF-compatible model. To that end, we used a model2text framework. In particular, we wrote an Xtext [EB10] grammar for the subset of the B language that was used by the simplified safety core. Starting from such a grammar consisting of 382 lines of code and 71 rules, the Xtext supporting tools generated an Ecore metamodel and all the related plugins allowing one to open any B file of the simplified safety core as an EMF-compatible model. The B specification could now be navigated and queried and, more importantly, it can be used as an input for building the traceability links.
4.2.3 UML modeling
Starting from the informal architecture design provided by CLEARSY, we designed a UML component diagram within EMF-Eclipse as shown in Figure 4. The diagram describes the components involved in the simplified Coppilot system: the M11 Com-puting Unit represents the main component that exploits the information obtained by the sensors. Sensors are represented by further components, called M21 Positioning LCU1, M22 Door LCU1, M24 Positioning LCU1, and M23 Door LCU1.
Figure 4 – UML Component Diagram of the simplified Coppilot system
4.3
Computing design-runtime traceability links
Starting from the runtime and design models, a Traceability Model is automatically generated by means of JTL [CDREP10]. In order to do this, we initiated the solution by specifying required inter-model correspondences based on the inputs from CLEARSY. This can be run again and/or extended by CLEARSY in the future if needed to consider more traceability scenarios.
Figure 5 – Traceability Metamodel
In order to represent the traceability information between design and runtime arti-facts, the simple traceability metamodel depicted in Fig. 5 is considered. It facilitates the definition of trace links with multiple sources and targets while considering different types of links, artifacts and additional information as the development context of the trace links. This traceability metamodel defines a TraceabilityModel, which is the root element of a traceability model. A trace model stores all the traceability data regarding the mapping of a set of source artifacts into a set of target artifacts, i.e. two sets of traceable artifacts. For instance, trace links can be defined between a design model and a model containing corresponding run-time information. A TraceabilityModel stores TraceabilityLink s between artifacts. A TraceabilityLink relates one or more elements belonging to the left domain (leftLinkEnd ) and the correspondent (one or more) elements belonging to the right domain (rightLinkEnd ). It also associates to a number of contexts through which it can capture custom information. TraceabilityLinkEnds represents an end of a traceability link and it represents a specific TraceableArtefact. These TraceableArtefact will normally be references to actual artifacts that live in some kind of source or target model. In our experiment, artifacts refer to an object of type EObject (org.eclipse.emf.ecore.EObject) that represents a specific object in the source or target domain. The metaclass TraceabilityContext enables designers to attach custom information about the context to traceability links. Each context defines a number of TraceabilityContextData that captures additional information. TraceabilityContextData can be specialized on the base of specific needs. Such data
may be relevant inference information calculated from the runtime models (eg., related to the source of fallback and its measurements) that may be then further used at the system/design model-level.
1 transformationLog2B (log:Log, b:B) { 2 top relationTrace2Variable { 3 v, s : String;
4 checkonly domainlog trace: Log::Trace { 5 variable = v,
6 sensor = s 7 };
8 checkonly domainb var: B::Variable { 9 name = s + "_" + v
10 }; 11 }
12 top relationTrace2Ref { 13 v, s : String;
14 checkonly domainlog trace: Log::Trace { 15 variable = v,
17 };
18 checkonly domainb ref: B::Ref { 19 var = var: B::Variable { 20 name = s + "_" + v 21 }
22 }; 23 }
24 top relationTrace2Print { 25 v, s, i : String;
26 checkonly domainlog trace: Log::Trace { 27 variable = v,
28 sensor = s, 29 value = i 30 };
31 checkonly domainb ref: B::Call {
32 op = op: B::Operation { name = "print" }, 33 args = a1: B::StringLiteral { value = s }, 34 args = a2: B::StringLiteral { value = v }, 35 args = a2: B::StringLiteral { value = i } 36 };
37 } 38 }
Listing 3 – Specification of Log2B correspondences
Within the JTL framework [EPT18], the correspondences between the design and runtime concepts are specified between the corresponding metamodels. In Listing 3, a fragment of the correspondence specification between Log models and B models is reported. The specification is defined by means of relations between elements of the two involved domains. In particular, at Line 1 of Listing 3, variables log and b are declared to match models conforming to the Log and B metamodels, respectively. The specified relations are described as follows:
- The top relation Trace2Variable (Lines 2-11) maps an element of type Trace in the Log domain and an element of type Variable in the B domain. Thus, each event that involves a sensor s and a variable v is mapped to the correspondent portion of the B specification where the variable is declared;
- The top relation Trace2Ref (Lines 12-23) maps an element of type Trace in the Log domain and an element of type Ref that represents a reference to a Variable element in the B domain. Thus, each event that involves a sensor s and a variable v is mapped to the correspondent portion of the B specification where the variable is called;
- The top relation Trace2Print (Lines 24-37) maps an element of type Trace in the Log domain and an element of type Operation with name print in the B domain. Thus, each event that involves a sensor s and a variable v is mapped to the operation that prints it, to establish the origin of the event.
The described mapping assumes that models are consistent with the formal specifi-cation. In this case study, models and code are also consistent in terms of the adopted naming convention. However, JTL allows specifying also complex relationships between elements, e.g., elements that do not trivially match by names, or model elements that do not map one-to-one to the code [CDREP10].
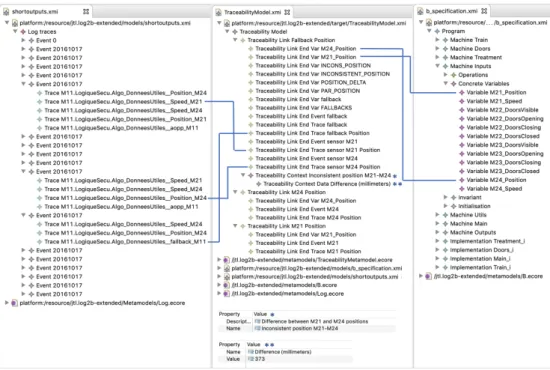
The execution of the Log2B transformation takes as input the Log model and the B model (as shown in the left and right part of Figure 6) and generates the corresponding Traceability Model (as shown in the middle of Figure 6). In particular, the arrows connect trace links with the source and target model elements they refer to. Furthermore, a Context Data containing the difference between the positions reported by the sensors M21 and M22 is created by means of a procedure able to navigate the log models and detect the last values from sensors (as explained in Section 2).
Figure 6 – Traceability Model between the Log and B models
1 transformationLog2UML (log:Log, uml:UML) { 2 top relationSensor2Component { 3 s : String;
4 checkonly domainlog trace: Log::Trace { 5 sensor = s
6 };
7 checkonly domainuml comp: UML::Component { 8 name = s
9 }; 10 }
11 top relationAutomata2Component { 12 a : String;
13 checkonly domainlog trace: Log::Trace { 14 automata = a
15 };
16 checkonly domainuml comp: UML::Component { 17 name = a
18 }; 19 }
Listing 4 – Specification of Log2UML correspondences
In Listing 4, a fragment of the correspondences specification between Log models and UML models is reported. In Line 1, variables log and uml are declared to match models conforming to the Log and UML metamodels, respectively. The specified relations are described as follows:
- The top relation Sensor2Component (Lines 2-10) maps an element of type Trace in the Log domain and an element of type Component in the UML domain. Thus, each event that involves a sensor a is mapped to the corresponding component named a;
- The top relation Automata2Component (Lines 11-19) maps an element of type Trace in the Log domain and an element of type Component in the UML domain.
Thus, each event that involves a sensor a is mapped to the corresponding component named a.
The execution of the Log2UML transformation takes as input the Log and UML models (as shown in the left and right part of Fig. 7) and generates the corresponding Traceability Model (as shown in the middle of Fig. 7). In particular, the arrows connect trace links with the source and target model elements they refer to.
Figure 7 – Traceability model between the Log model and the UML component diagram
4.4
Building the design-runtime traceability view
While the traceability links computed in the previous section provide enough informa-tion to help localize and diagnose fallbacks, they are not intended to be used directly by the system engineer. Instead, we propose to build a view that aggregates together all the models seen so far. This allows the system engineer to transparently point to the relevant information (spread in different models) while also allowing him/her to have a better vision of the full picture. We initiated such a view for our use case with the help of CLEARSY engineers. However, they are now able to refine this view and eventually define new ones for supporting different scenarios.
Technically, we built the view using EMF Views [BPWC15] by using four different artifacts:
1. A viewpoint description, in which we list the metamodels the view requires. In our case, the metamodels are: the B metamodel, the Log metamodel, the Traceability metamodel, and the UML metamodel.
2. A viewpoint weaving model, which describes the new (virtual) features enriching the view. We add a new bidirectional association designComponent, between Trace and Component, which allows the system engineer to navigate from a runtime trace back to the component that emitted it, and from a component to all its emitted traces.
We also rename the features leftLinkEnd (which holds references to B variables) and rightLinkEnd (references to events and traces) to specification and events, making the view more useful to the engineer. We perform such a renaming by filtering the existing features and creating new associations; the matching model described below then simply carries their content over.
3. A view description, where we list the models contributing to the view: the model of B specification, an excerpt of logs, the traceability links computed in 4.3,
and the components model. The view description also points to the viewpoint description above, and to the matching model.
4. A matching model, where we describe how the virtual features should be pop-ulated. When loading the view in a model browser, EMF Views will use the matching model to compute an internal view weaving model (analogous to the viewpoint weaving model), and populate the virtual features accordingly. Different languages can be used for the matching model. In the present case, we use the Epsilon Compare Language (ECL) [Kol09]. Listing 5 shows the ECL rule for populating the designComponent feature: if the name of the component (e.g., M21 Position LCU ) starts with the sensor property of the trace (e.g. M21 ), the two are virtually linked in the view.
1 rule designComponent 2 matcht : log!Trace 3 with c : uml!Component { 4 compare{ 5 return c.name.startsWith(t.sensor); 6 } 7 }
Listing 5 – ECL matching model
With these four artifacts, the system engineer can open the view description in a model browser. This causes EMF Views to first build the corresponding viewpoint, by loading the contributing metamodels and the viewpoint weaving model in order to build the virtual features. Then, EMF Views builds the actual view by loading the contributing models, executing the matching model, and populating the virtual features by collecting the matches. In this case, the process of building the view takes less than a second, because the virtualization engine of EMF Views does not copy elements of the contributing models into the view, but rather creates proxies to access to them on-demand.
While four files are required to build the view, building a new view on another runtime trace only requires to modify the view description by pointing out to the new runtime trace model.
4.5
Navigation and querying the design-runtime view
The resulting model view can be navigated using the different types of available user interfaces. In our Eclipse context, opening the view description file with a standard model browser yields all the information the CLEARSY system engineer needs in order to analyze the fallback situations. However, for a more complete user experience, view navigation capabilities could also be integrated directly within the editors of the various contributing models (cf. Section 5.3).
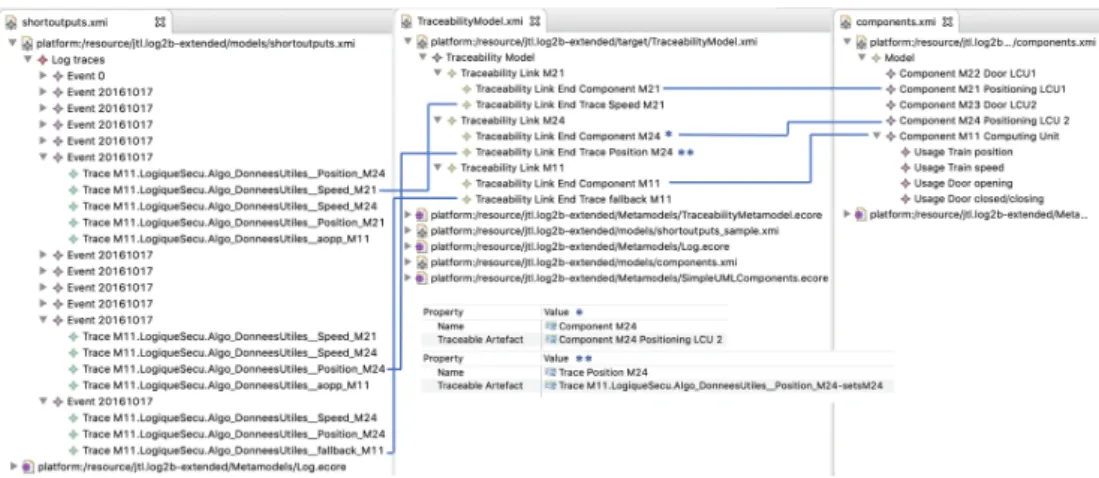
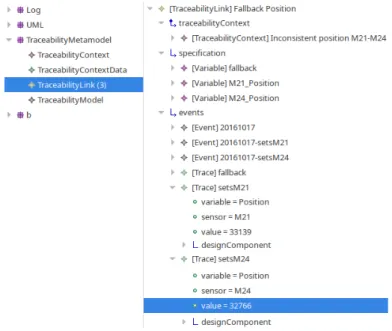
Figure 8 gives an example of such a view on a trace where an inconsistent position fallback was triggered (still on the example from Section 2.2). On the left-hand side are the four models: the Log model containing all the output traces, the UML component model containing the design components, the Traceability model containing interesting traces (here there are three), and the B model containing the B specification. On the right-hand side, one traceability link is expanded so that its child feature are visible: traceabilityContext summarizes the situation of the fallback in plain text, specification points to B variables that are related to the fallback situation, and events contains the events and traces that are causes for the fallback, as well as the trace in which the fallback actually happened. One can furthermore consult the actual values of the
involved sensors M21 and M24 and see that their difference is 373, which is above the threshold required to trigger a fallback situation (the threshold of 300 is displayed when expanding the traceability context). From the traces, the engineer can also follow the designComponent link to navigate to the UML component of the corresponding sensor.
Figure 8 – View showing an inconsistent position between the two sensors M21 and M24.
In addition to navigating the model view manually, the system engineer can also query this view by using either dedicated query languages or more general-purpose languages she/he is familiar with. Queries can be useful notably for automating workflows, i.e. to support collecting data that will be processed by other tools, or to create useful summaries. In particular domains or for given purposes (cf. our case study for instance), it is possible to define some reusable sets of such queries. However, this cannot be systematically performed in the general case and the engineers expertise is still fundamental in order to write down more complex queries.
As a concrete simple example, the OCL query of Listing 6 will list all fallback situations by date alongside with a one-line summary of this fallback (e.g. “Inconsistent position M21-M24”). Note that we have only experimented with queries defined in OCL so far, but other languages could also be used to the same intent (cf. Section 5.3).
1 TraceabilityLink.allInstances()->select(t | t.name.startsWith('Fallback'))
2 ->collect(t | t.events->asSequence()->first().timestamp + ' : ' + t.traceabilityContext.name)
Listing 6 – Example OCL query to summarize fallback situations from a view.
As another example, the query self.traces.values can be used to extract all the sensor values for a given design component (the value of self). These values could then be further analyzed by the system engineer to diagnose hardware failures. Recall that traces is a virtual association that links UML components to Trace element of the log model. The fact that the view aggregates all models into one makes such queries easy to write and execute.
2 .select(t | t.name = 'Fallback Position')
3 .collect(t | t.events.first().timestamp + ': ' + t.traceabilityContext.name + ' : ' + 4 t.events.select(e | e.isTypeOf(Trace)).select(t | t.name.indexOf('setsM') > 0) 5 .collect(t | t.designComponent.name + ' : ' + t.value).concat(', ')).println();
Listing 7 – Epsilon query to analyze fallbacks due to inconsistent sensor positions.
Listing 7 is a last example, this time using the Epsilon Object Language [PKR+09]. We output one line for each fallback situation created by an inconsistent position between sensors, along with the event timestamp and last known sensor values. When run against the log of Listing 1, we get the line below
231136106: Inconsistent position M21-M24: M21 Positioning LCU1: 33139, M24 Positioning LCU2: 32766
providing all the information that was previously manually extracted.
5
Discussion
The experiment has been conducted in two complementary phases. According to the CLEARSY interest in adopting model-based solutions, the first phase of the experiment was devoted to 1) the study of their practices as currently operating in the company and 2) the understanding of how their needs could be possibly supported by our technologies. From this first phase, it was evident that a significant effort would be required to integrate model-based methodologies directly within the existing internal development processes at CLEARSY (as already strictly structured) .
After collecting the required experiment material, the second phase has been dedicated to the design of the conceptual approach and the implementation of the corresponding technical solution (as described in Section 4). Thanks to the performed experiments, we have been able to integrate various existing artifacts from CLEARSY within the EMF Eclipse platform. This way, we contributed to the apparition of a new model-based process at CLEARSY complementary to the existing ones. This one is specifically dedicated to the analysis of runtime information internally collected by the company, and can be possibly generalized to other critical systems they have to model (in B) for their different customers.
We now highlight the strengths and the limitations of the proposed approach. This is motivated by the feedback received from CLEARSY, based on the usage they have been able to make so far of our technical solution.
5.1
Benefits of the approach
Our initial experiment indicates that the use of traceability links between runtime and design/architectural aspects is promising. CLEARSY has observed that providing accessible correlations between situations of failures and the corresponding design elements can help their system engineers to better understand critical issues occurring at runtime. In fact, our approach has the potential for faster turnaround when analyzing fallback situations: provided traceability links highlight such situations and link directly to their root cause. Since system engineers can also jump from a fallback trace to the related variables in the B specification, and also to the corresponding element in the component diagram, the provided view can help them understanding if fallback situations are actually caused by specification bugs or rather by involved hardware components.
As a side benefit of discovering models from the raw (log) data, the structured information aggregated in the view can be directly reused by model-based tools for dif-ferent complementary engineering activities (e.g. for automated system documentation or execution reports).
5.2
Limitations of the approach
One technical limitation of our current implementation is that the discovery of the log model needs to be done manually. The transformation of raw logs into Log models is automatic, but the creation of Log models need to be triggered separately from other steps of the process. In contrast, the B code is discovered automatically as a model by the Xtext plugins when loading them as EMF resources. The same principle could be applied to Log models, but currently requires a separate step.
Another limitation of our current solution is that the final view is not yet deeply integrated with some tools the system engineer may be familiar with. For instance, while the view lets you browse the B specification as a model (somehow equivalent to an AST), the system engineer may be more comfortable working directly with the B source code. The view also currently lets you see UML components and their usage relations, but not in a dedicated UML graphical editor. In other words, the view exposes a model representation of the aggregated design-runtime information, while the system engineer may be more used to deal with corresponding concrete (textual or graphical) syntax. How to integrate the model view elements seamlessly in order to enhance existing concrete syntax remains an open scientific and technical challenge. Similarly to what has been done in [ACLP17], we plan to overcome such limitations by employing bidirectional model transformations to define and implement the relationships among the concepts belonging to the different concrete syntaxes of the modeling artifacts at hand.
5.3
Planned technical improvements
In the context of this first experiment, we focused on detecting one specific cause of fallback situations: when two sensors report inconsistent values. However, a fallback may also be caused by faulty sensors or other types of conditions. To detect these other causes in our current solution, we need to specify more general patterns that can then be used by JTL when computing the traceability links. Supporting CLEARSY in this process, we plan to study how to (semi-)automatically discover such patterns based on the raw runtime data.
As far as the model view navigation is concerned, more work could be done on improving the integration with the different already available editors (cf. also Section 5.2). For example, in our use case, it would be interesting to be able to navigate directly from an entry in the Log model back to actual corresponding textual elements in the B source code (without having to actually open and browse the view itself).
Concerning the model view querying aspects, an interesting continuation of our work could be to test the support for other languages than OCL to define the needed queries. In the context of our use case, we can work in close collaboration with the CLEARSY system engineers in order to identify the language(s) (existing or to be specified) which are possibly better-suited for them to write and maintain such queries on the long run.
6
Related Work
As introduced in Section 1, the presented work directly belongs to the area of design-runtime interactions in complex systems, as already prominent in the context of CPSs notably [DLV12]. Among the different underlying challenges [BEG+18], our proposed
approach and related experiments are mostly related to the following main topics in this area: 1) the discovery and representation (as models) of runtime information and 2) the creation and use of correspondences between runtime and design models.
The idea of extracting relevant information out of execution logs is not new and has already been used quite a lot in other domains, such as in databases [AGL98]. As far as software execution logs are concerned, it appears that there is not any standard representation that emerged even if some common formats have been proposed quite recently (e.g. the Common Trace Format - CTF [CTF]). As a consequence, and also due to the relatively simple structure of the raw logs we were able to collect from the studied system, we decided to opt in our approach for a simple custom Log metamodel we designed ourselves.
Complementary to log modeling, some existing approaches intend to represent system runtime behaviors with more details, either in the general case [LBTA10] or by means of common notations such as dataflow diagrams for instance [MSS06]. Similar approaches are also used when the final goal of the runtime analysis process is to perform more formal verification activities, based on UML statecharts for example [Dru11]. However, in the present case and practical scenario, we have been more interested in studying the produced runtime logs than in defining the system behavior in a more general and abstract way.
Model traceability in general has been studied quite deeply in the past, as one of the key features of MDE providing capabilities for establishing and using traceability information [ARNRSG06]. There has been a few attempts to specify a common and generic traceability metamodel [WJSA06]. However, up to our current knowledge, we have not been able to identify a particular one actually used as a reference or standard. On the contrary, there have been other types of approaches targeting the definition of custom traceability metamodels according to the needs of given scenarios [DKPF08]. In the present work, we decided to go this way by defining our own custom traceability metamodel (obviously inspired by the work above-mentioned) according to the requirements from the CLEARSY scenario.
Concerning the definition and representation of the inter-model correspondences themselves, there has already been a significant work in the community on supporting model-based principles and techniques such as model weaving (for instance in the context of model transformation [DFV09] or language interoperability [JVB+10]) or
model comparison [Kol09]. In the present work, we are actually making good use of model weaving internally in our EMF Views model view solution, notably in order to represent the view-specific information.
Finally, formal methods are widely used at CLEARSY especially using the B language, notably at the design time, for specification of models or systems [LDPM17]. Some techniques are also applied at runtime, such as formal validation [LBL12]: Rules or properties are defined over a model and large data sets are validated against this model. For example, this allows to detect inconsistencies or design flaws in sets of software parameters.
7
Conclusion and Future Work
The approach proposed in this paper globally aimed at helping CLEARSY system engineers to analyze more easily their running critical systems and thus ultimately improve their availability on the long run. To this end, it collects all the relevant runtime-design information and transparently exposes it to the engineers as an all-encompassing view. Our model-driven solution is composed of five steps: monitoring the runtime activity, discovering models from the activity and design specification, computing traceability links between the activity and specification, building a view from the available/retrieved information, and finally navigating and querying the view. Our implementation of this approach leverages EMF-based technologies like Xtext, JTL and EMF Views, and produces a resulting view that aggregates all the information needed by the system engineers.
As future work, we plan to extend the proposed approach and supporting tools in different directions. Firstly, we are interested in investigating on how the proposed approach can be enhanced in order to characterize more precisely the failures, detect more types of failures and (automatically) identify specific actions to prevent them. For example, our approach could be combined with the use of analysis or simulation tools able to consume the traceability information we produce. Moreover, we plan to improve the proposed approach to deal with large number of traceability links and contexts. To this end, we expect to extend the currently developed tools by investigating the applicability of existing stream processing platforms (e.g., Apache Flink8, and Apache Kafka9). We also intend to improve the proposed supporting tools
for enabling an as smooth as possible adoption of the proposed approach. Finally, a user study is also planned to actually assess to what extent the proposed approach is accepted by different kinds of practitioners.
References
[ABD+18] W. Afzal, H. Bruneliere, D. Di Ruscio, A. Sadovykh, S. Mazzini,
E. Cariou, D. Truscan, J. Cabot, A. Gómez, J. Gorroñogoitia, L. Po-mante, and P. Smrz. The MegaM@Rt2 ECSEL project: MegaMod-elling at Runtime - Scalable model-based framework for continuous development and runtime validation of complex systems. MICPRO, 61:86–95, 2018.
[Abr05] J. Abrial. The B-book - assigning programs to meanings. Cambridge University Press, 2005.
[ACD+19] D. Arcelli, V. Cortellessa, D. Di Pompeo, R. Eramo, and M. Tucci.
Exploiting Architecture/Runtime Model-driven Traceability for Per-formance Improvement. In ICSA, 2019. to appear.
[ACLP17] L. Addazi, F. Ciccozzi, P. Langer, and E. Posse. Towards seamless hybrid graphical–textual modelling for uml and profiles. In A. Anjorin and H. Espinoza, editors, Modelling Foundations and Applications, pages 20–33, Cham, 2017. Springer International Publishing.
[AGL98] R. Agrawal, D. Gunopulos, and F. Leymann. Mining Process Models from Workflow logs. In EDBT, pages 467–483, 1998.
8https://flink.apache.org/ 9https://kafka.apache.org/
[ARNRSG06] N. Aizenbud-Reshef, B. T. Nolan, J. Rubin, and Y. Shaham-Gafni. Model Traceability. IBM Systems Journal, 45(3):515–526, 2006. [ARS15] P. Arcaini, E. Riccobene, and P. Scandurra. Modeling and Analyzing
MAPE-K Feedback Loops for Self-Adaptation. In Proceedings of the 10th International Symposium on Software Engineering for Adaptive and Self-Managing Systems, pages 13–23. IEEE Press, 2015.
[BBCW17] H. Bruneliere, E. Burger, J. Cabot, and M. Wimmer. A Feature-based Survey of Model View Approaches. SoSyM, pages 1–22, 2017.
[BCDM14] H. Bruneliere, J. Cabot, G. Dupé, and F. Madiot. MoDisco: A Model Driven Reverse Engineering Framework. JIST, 56(8):1012–1032, 2014. [BEG+18] H. Bruneliere, R. Eramo, A. Gomez, V. Besnard, J. M. Bruel,
M. Gogolla, A. Kastner, and A. Rutle. Model-Driven Engineering for Design-Runtime Interaction in Complex Systems: Scientific Chal-lenges and Roadmap - Report on the MDE@DeRun 2018 workshop. In Proc. of STAF 2018 Collocated Workshops, 2018.
[BMdKDC18] H. Bruneliere, F. Marchand de Kerchove, G. Daniel, and J. Cabot. Towards Scalable Model Views on Heterogeneous Model Resources. In MODELS, pages 334–344. Springer, 2018.
[Boc04] N. Boccara. Modeling Complex Systems. Graduate Texts in Comtem-porary Physics. Springer, 2004.
[BPWC15] H. Bruneliere, J. G. Perez, M. Wimmer, and J. Cabot. EMF Views: A View Mechanism for Integrating Heterogeneous Models. In ER, pages 317–325. Springer, 2015.
[CDREP10] A. Cicchetti, D. Di Ruscio, R. Eramo, and A. Pierantonio. JTL: A bidirectional and change propagating transformation language. In SLE Proc., pages 183–202, 2010.
[CTF] Common Trace Format. https://diamon.org/ctf/.
[DFV09] M. D. Del Fabro and P. Valduriez. Towards the Efficient Develop-ment of Model Transformations Using Model Weaving and Matching Transformations. SoSyM, 8(3):305–324, 2009.
[DKPF08] N. Drivalos, D. S. Kolovos, R. F. Paige, and K. J. Fernandes. Engi-neering a DSL for Software Traceability. In SLE Proc., pages 151–167. Springer, 2008.
[DLV12] P. Derler, E. A. Lee, and A. S. Vincentelli. Modeling Cyber–Physical Systems. Proc. of the IEEE, 100(1):13–28, 2012.
[Dru11] D. Drusinsky. Modeling and Verification using UML Statecharts: a Working Guide to Reactive System Design, Runtime Monitoring and
Execution-based Model Checking. Elsevier, 2011.
[EB10] M. Eysholdt and H. Behrens. Xtext: implement your language faster than the quick and dirty way. In SPLASH/OOPSLA, pages 307–309, 2010.
[EPT18] R. Eramo, A. Pierantonio, and M. Tucci. Enhancing the JTL tool for bidirectional transformations. In Conf. Companion of Programming, pages 36–41, 2018.
[JVB+10] F. Jouault, B. Vanhooff, H. Bruneliere, G. Doux, Y. Berbers, and
J. Bézivin. Inter-DSL Coordination Support by Combining Megamod-eling and Model Weaving. In SIGAPP, pages 2011–2018, 2010. [Kol09] D. S. Kolovos. Establishing Correspondences between Models with
the Epsilon Comparison Language. In ECMDA-FA, pages 146–157. Springer, 2009.
[LBL12] T. Lecomte, L. Burdy, and M. Leuschel. Formally checking large data sets in the railways. In DS-Event-B Workshop (ICFME 2012), 2012. [LBTA10] G. Lehmann, M. Blumendorf, F. Trollmann, and S. Albayrak.
Meta-modeling Runtime Models. In MODELS, pages 209–223, 2010. [LDPM17] T. Lecomte, D. Déharbe, É. Prun, and E. Mottin. Applying a formal
method in industry: A 25-year trajectory. In SBMF, pages 70–87, 2017.
[MSS06] N. Mitchell, G. Sevitsky, and H. Srinivasan. Modeling Runtime Behavior in Framework-based Applications. In ECOOP, pages 429– 451. Springer, 2006.
[PDK+11] R. F. Paige, N. Drivalos, D. S. Kolovos, K. J. Fernandes, C. Power,
G. K. Olsen, and S. Zschaler. Rigorous identification and encoding of trace-links in model-driven engineering. SOSYM, 10(4):469–487, 2011. [PKR+09] R. F. Paige, D. S. Kolovos, L. M. Rose, N. Drivalos, and F. A.
Po-lack. The Design of a Conceptual Framework and Technical Infrastruc-ture for Model Management Language Engineering. In IEEE ICECCS 2009, pages 162–171. IEEE, 2009.
[Sch06] D. Schmidt. Guest Editor’s Introduction: Model-Driven Engineering. Computer, 39(2):25–31, 2006.
[WJSA06] S. Walderhaug, U. Johansen, E. Stav, and J. Aagedal. Towards a Generic Solution for Traceability in MDD. In ECMDA Traceability Workshop (ECMDA-TW), pages 41–50, 2006.
Acknowledgments This work has received funding from the ECSEL Joint Un-dertaking under grant agreement No. 737494 (MegaM@Rt2 project). This Joint Undertaking receives support from the European Union’s Horizon 2020 research and innovation program and from Sweden, France, Spain, Italy, Finland & Czech Republic.