HAL Id: hal-02946592
https://hal.archives-ouvertes.fr/hal-02946592
Submitted on 23 Sep 2020
HAL is a multi-disciplinary open access
archive for the deposit and dissemination of
sci-entific research documents, whether they are
pub-lished or not. The documents may come from
teaching and research institutions in France or
abroad, or from public or private research centers.
L’archive ouverte pluridisciplinaire HAL, est
destinée au dépôt et à la diffusion de documents
scientifiques de niveau recherche, publiés ou non,
émanant des établissements d’enseignement et de
recherche français ou étrangers, des laboratoires
publics ou privés.
Heterodyne detection for the measurement of
electro-optical frequency combs generated with a silicon
Mach-Zehnder modulator
Lucas Deniel, Erwan Weckenmann, Diego Galacho, Laurent Bramerie, Charles
Baudot, Margaux Barbier, Mathilde Gay, Frédéric Boeuf, Laurent Vivien,
Christophe Peucheret, et al.
To cite this version:
Lucas Deniel, Erwan Weckenmann, Diego Galacho, Laurent Bramerie, Charles Baudot, et al..
Het-erodyne detection for the measurement of electro-optical frequency combs generated with a silicon
Mach-Zehnder modulator. SPIE Photonics West - OPTO 2020, Feb 2020, San Francisco, United
States. pp.1128516, �10.1117/12.2543962�. �hal-02946592�
Heterodyne detection for the measurement of electro-optical frequency
combs generated with a silicon Mach-Zehnder modulator
Lucas Deniel*
a, Erwan Weckenmann
b, Diego Pérez Galacho
a,+, Laurent Bramerie
b, Charles Baudot
c,
Margaux Barbier
b, Mathilde Gay
b, Frédéric Boeuf
c, Laurent Vivien
a, Christophe Peucheret
b,
Delphine Marris-Morini
aa
Centre de Nanosciences et de Nanotechnologies, CNRS, Univ. Paris-Sud, Université Paris-Saclay,
91120 Palaiseau, France;
bUniv Rennes, CNRS, FOTON - UMR 6082, F-22305 Lannion, France;
c
ST Microelectronics, 850 rue Jean Monnet, 38920 Crolles, France;
+Now at ITEAM research
institute, Universitat Politècnica de València, Camino de Vera s/n, 46022, Valencia, Spain
ABSTRACT
Optical frequency combs (OFCs) are involved in a large diversity of applications such as metrology, telecommunication or spectroscopy. Different techniques have been explored during the last years for their generation. Using an electro-optical modulator (EOM), it is possible to generate a fully tunable OFC for which the electro-optical repetition rate is set by the frequency of the applied electrical radio frequency (RF) signal. In order to realize on-chip OFC generators, silicon photonics is a well-suited technology, benefiting from large scale fabrication facilities and the possibility to integrate the electronics with the EOM. However, observing OFCs with a repetition rate lower than 10 GHz can be challenging since such spacings are smaller than the typical resolution of grating-based optical spectrum analyzers. To overcome this issue, two alternative solutions based on heterodyne detection techniques are used to image the OFC on the electrical RF domain. The first technique consists in applying two frequencies close to each other simultaneously on the modulator, and observing the beating between the resulting two combs. Another method consists in observing the beating between the OFC and the input laser, once the frequency of this input laser has been shifted from the center of the OFC by means of an acousto-optic modulator. Based on both measurement techniques, OFCs containing more than 10 lines spaced with repetition rates from 100 MHz to 15 GHz have been observed. They are generated using a 4-mm long silicon depletion-based traveling-wave Mach-Zehnder modulator (MZM) operating at a wavelength of 1550 nm.
Keywords: Frequency comb, electro-optical, silicon, modulator, heterodyne.
1. INTRODUCTION
After revolutionizing the fields of metrology and optical frequency synthesis, optical frequency combs (OFCs) have become a key tool for spectroscopy, astronomy, telecommunications and ranging applications. Mode locked lasers (MLL) appeared as one of the first technology enabling the generation of such combs [1], since a series of periodically emitted light pulses produces coherent and evenly spaced lines in the frequency domain. Non-linear optical processes such as four wave mixing have also contributed to parametric generation and broadening of OFCs. More recently, by combining non-linear effects and waveguide dispersion engineering with the resonant behavior of micro-rings, researchers have succeeded in the generation of broadband soliton-based OFCs (microcombs) [2]. However, the frequency spacings between the lines of OFCs generated from MMLs or micro-rings are imposed by the cavity modes, constraining the comb flexibility. A third way of producing OFCs is to take advantage of electro-optic modulation [3]. By periodical phase modulation of a continuous wave (CW) light beam, it is possible to generate multiple sidebands in the optical spectrum. In this scheme, the sidebands spacing is given by the applied modulation frequency (or repetition rate). The electro-optical frequency combs (EOFCs) are thus tunable both in line spacing, within the electro-optical bandwidth of the modulator, and in central frequency, since they are not limited by dispersion as it is the case for microcombs.
Miniaturization of EOFC generators would enable remote and low-weight systems for spectroscopy or telecommunications [4]. Such size reduction could be obtained by integrating electro-optical modulators on photonic
chips. Silicon photonics has emerged as a promising platform for this purpose [3, 5], as it benefits from CMOS-compatible fabrication process and technological facilities, for low-cost and large-volume production. Electronics can also be directly integrated with silicon photonics.
As the frequency line spacings of an EOFC is given by the applied radiofrequency (RF) signal, it is typically in the range of few tens of GHz, limited by the modulator bandwidth. In order to observe EOFCs with lines spacings of less than a few GHz, a very high resolution optical spectrum analyzer (OSA) is required. Since most standard grating-based OSAs have typical resolutions of tens of picometers, they are not convenient for resolving EOFCs at telecom wavelengths. In this work, EOFCs are generated from a silicon Mach-Zehnder modulator (MZM) based on the free carrier plasma dispersion effect in PN junctions. Two methods based on heterodyne beatings are then used to visualize the EOFC in the RF spectral domain, thanks to an RF spectrum analyzer. The first method consists in applying two electrically mixed signals of the same power but with slightly different RF frequencies to the modulator, in order to generate pairs of sidebands in the optical domain. After photodetection, each line pair produces a beat-note, allowing to retrieve evidences of the optical lines presence. However, this technique does not enable to distinguish between the upper and lower sidebands of the comb (defined with respect to the optical carrier frequency). The second method relies on the use of an external acousto-optic modulator (AOM) and enables the distinction between the upper and lower sidebands. The EOFC is optically combined with a CW signal originating from the same optical source, which has been shifted in frequency thanks to the AOM. Therefore, after photodetection, the different heterodyne beatings between the EOFC and this shifted CW line are mapping the optical spectrum in the RF domain.
2. DEVICE DESIGN AND CHARACTERISTICS
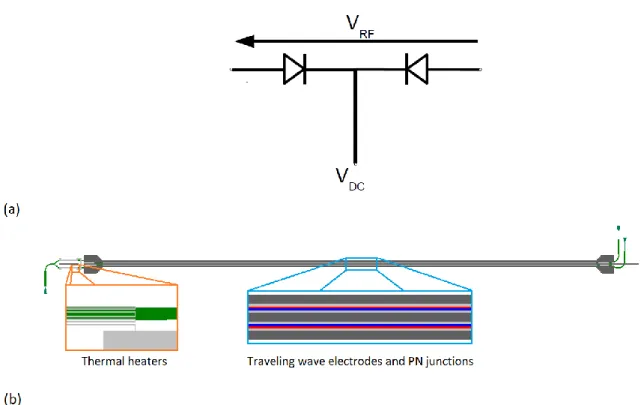
The MZM structure is composed of two silicon PN junctions working as phase-shifters by modulation of the free carrier depletion area in each arm. Both N regions share the same electrical potential, therefore the RF voltage is naturally distributed in opposite phases between the two arms, while the modulator is working in a single drive configuration. A schematic of the electric circuit is shown in Fig. 1 (a).
Figure 1. (a) Generic electrical scheme of the modulator. VRF is the applied RF voltage and VDC is an electrical DC potential
applied to reverse bias both diodes. (b) Schematic top view of the silicon MZM arms. The two highly-doped N regions are connected to the same metallic strip. The insets provide details of the thermal heaters and the PN junctions.
The device was fabricated by ST Microelectronics [6] and is conceived to work around 1550 nm wavelength. Fig 1(b) shows a schematic top view of the silicon MZM. Optical access is achieved by grating couplers, leading to a 35 nm wide 3 dB optical bandwidth. The waveguides are 400 nm-wide and 300 nm-high, while a slab thickness of 50 nm ensures a high confinement of the field. Highly doped regions near the electrical contacts reduce the electrical access resistance. The RF signal propagates through the 4-mm long phase shifters thanks to travelling wave electrodes. Resistive metallic strips are placed above each arm and operate as thermal heaters under the application of a small DC current, in order to tune the operating point of the MZM.
Static measurements of modulator characteristics have shown a 8 V half-wave voltage, and a numerical simulation of the phase shifters gave an estimated attenuation factor of 1.24 dB×mm-1 at 0 V bias. A 18 GHz 3 dB-electro-optical bandwidth was measured when both diodes were biased at -6 V.
3. EOFC PRINCIPLE
In this section, a brief explanation of the EOFC generation in a MZM is given, in the case of ideally linear and lossless phase modulators.
When a sinusoidal RF signal is applied to a phase modulator, the electric field at its output can be expressed as:
exp
02
n
0n
A
cos(
t
)
L
t
i
E
E
OUT IN
RF
(1)where
E
IN is the incident field,i
is the unit imaginary number,
0 is the optical carrier angular frequency,t
is the time,L
is the modulator length,
is the wavelength,n
0 is the optical mode effective index in the absence of modulation,
n
()
is the modulated part of the effective index, as a function of the applied voltage,A
is the amplitude of the applied voltage and
RF is the angular frequency of the RF signal.If the modulated part of the effective index is considered real and proportional to the applied voltage by a factor
, the Jacobi-Anger expansion can be applied to Eq. (1). Infinite harmonics then appear in the expression of the output field, resulting in an OFC:
k RF k k IN OUTA
ik
t
L
J
i
L
n
t
i
E
E
2
(
2
)
exp
exp
0 0 (2)Where
J
k()
is thek
th order Bessel function of the first kind, weighing thek
th labeled comb line.In the Mach-Zehnder structure, the fields
E
1andE
2at the end of each phase-shifter are combined by the output coupler after one of them has been phase-shifted by
H in a heater, resulting in a resulting total electric fieldE
TOT:2
)
exp(
2 1 H TOTi
E
E
E
(3)Harmonics from both arms are thus superposed to form the overall EOFC.
4. EXPERIMENTAL RESULTS
4.1 Dual-tone modulation
A first method is experimentally performed to qualitatively check the EOFC generation from the silicon MZM. This technique consists in applying a signal containing two RF tones with close frequencies to the MZM, and observing the beat notes resulting from photodetection of the modulated light beam on an electrical spectrum analyzer (Fig. 2).
Figure 2. Generic schematic of the dual-tone method setup. Two RF signals at frequencies fRF and fRF + f RF are mixed
together before being applied to the modulator. Si MZM: Silicon Mach-Zehnder modulator.
By applying two closely-spaced RF tones fRF and fRF + fRF to the same modulator, two EOFCs are produced simultaneously. The first one contains lines at frequencies f0 + k×fRF, where f0 is the input laser frequency and k is the line order, while the second comb contains lines at frequencies f0 + k×(fRF + fRF). For a given order k, the lines from each comb produce a beat note at the frequency |k|×fRF, which can be measured electrically.
In order to avoid the noise at low frequencies, it is also possible to observe beatings between the kth order line of the first comb, and the (k + 1)th order line of the second comb. Since these beat notes appear at higher frequencies (fRF + |k|×fRF), they are less affected by the low-frequency noise and result in a higher signal-to-noise ratio.
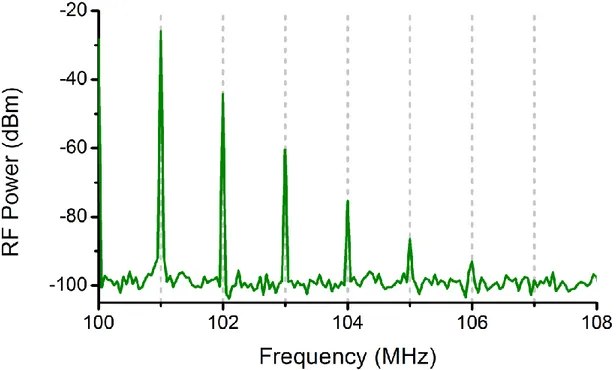
Figure 3. Experimentally measured electrical spectrum when two RF signals of 3 Vpp and frequencies of 100 and 101 MHz
are mixed before being applied to the silicon modulator. Beat-notes emerge over the noise floor from 100 MHz to 106 MHz.
Fig. 3 shows the spectrum, obtained by mixing two 3 Vpp RF signals with frequencies of 100 MHz and 101 MHz, and applying them to the silicon MZM. Beat notes are observed up to 106 MHz, proving the existence of between 7 and 13 comb lines in the optical spectrum. Indeed, since the line pair at the order k have the same spacing than the line pair at the order –k, the beat notes from both line pairs are landing at the same frequency. It is thus impossible to know the exact number of optical lines.
4.2 The acousto-optic modulator-based method
One of the main drawbacks of the previously exposed dual-tone method is that the upper and lower sidebands of the EOFC spectrum are producing beat-notes at the same frequencies. As a result, it is impossible to quantitatively retrieve the optical spectrum from this technique in practice.
Figure 4. (a). Generic schematic of the experimental setup required for the acousto-optic modulator- based method. A Single RF tone with a 8Vpp amplitude and a frequency of fRF = 2GHz is applied to the silicon modulator, while the external
acousto-optic modulator is driven with a fAOM = 40 MHz signal. AOM: Acousto-optic modulator. Si MZM: Silicon
Mach-Zehnder modulator.
In this section, another method is used to obtain a reliable image of the optical spectrum in the RF domain, by enabling the distinction between the upper and lower sidebands of the EOFC. This is made possible by measurement of the beating between the EOFC and its frequency-translated optical carrier. For this purpose, the signal from the input CW laser source is first split into two contributions (Fig. 4). In the first path, it is modulated in the silicon MZM, to which a single RF signal of 8 Vpp at fRF=1 GHz is applied. The second half is sent to an acousto-optic modulator (AOM), which will shift the incident CW line by fAOM = 40 MHz. The EOFC and the shifted laser line are then combined in a single fiber and input to a photodetector. Beating products between the frequency-shifted laser line and the EOFC appear at frequencies |k×fRF – fAOM|. Therefore, the frequency of the beat notes from the kth order lines is different from that originating from the –kth order lines.
The EOFC can then be experimentally reconstructed in the RF domain using this method. Fig. 5 shows the obtained spectrum.
Figure 5. Electrical spectrum obtained experimentally from the acousto-optics modulator-based method. The top-right corner inner inset is a close-up visualization of the dashed surrounded area, around 2 GHz. A total of 12 comb lines are observed when a 1 GHz, 8 Vpp signal is applied to the Si MZM.
At each multiple of the modulation frequency, a set of three beat-notes are observed, as shown by the zoom around 2 GHz, in the top-right corner inset. For one given set around q×fRF, where q is a positive integer, the middle beat note corresponds to multiple overlapping beatings between all the EOFC comb lines distant from q×fRF, which is not relevant to retrieve the optical spectrum. However the left beat note (at q×fRF – fAOM) corresponds to the single beating between the qth order optical comb line and the shifted laser line, while the right beat note (at q×fRF + fAOM) corresponds to the single beating between the –qth order comb line and the shifted laser line. Since each EOFC line produces a single beat note with the shifted laser line, a map of the optical comb appears in the RF spectrum. A total of 12 lines is observed in Fig. 5.
Figure 6. Electrical spectrum obtained experimentally from the acousto-optic modulator-based method, for a 5 GHz, 8 Vpp signal. The top-right corner inner inset is a zoom of the dashed surrounded area, around 20 GHz. A total of 11 comb lines are observed.
In Fig. 6, the RF spectrum measured for a modulation frequency of 5 GHz, and with the same RF power is displayed. 11 lines were measured at this frequency. The same experiment was done with modulation frequencies of 0.5 GHz, 2 GHz and 3 GHz, showing similar performance.
5. CONCLUSION
An EOFC was generated from a silicon MZM. Since small frequency spacings between the comb lines cannot be resolved by standard grating-based OSAs, two heterodyne methods were applied in order to visualize an image of the EOFC on an electrical spectrum analyzer. The first method consisted in the application of two close RF tones around 100 MHz on the modulator. As this method had the drawback of making the upper and lower sidebands of the EOFC indistinguishable, a second technique was introduced. This second method involved an external AOM and enabled to retrieve the shape of the optical spectrum, showing an 11-lines EOFC, up to a 5 GHz modulation frequency. These preliminary results pave the way towards the use of silicon-based EOFCs for advanced applications such as on-chip dual-comb spectroscopy or all-optical sampling.
REFERENCES
[1] Cundiff, S. T., Ye, J. and Hall, J. L., "Optical frequency synthesis based on mode-locked lasers," Rev. Sci. Instrum 72(10), 3749-3771 (2001).
[2] Kippenberg, T. J., Gaeta, A. L., Lipson, M. and Gorodetsky, M. L., "Dissipative Kerr solitons in optical microresonators," Science, 361(6402), eaan8083 (2018).
[3] Nagarjun, K. P., Jeyaselvan, V., Selvaraja, S. K. and Supradeepa, V. R., "Generation of tunable, high repetition rate optical frequency combs using on-chip silicon modulators," Opt. Express, 26(8), 10744-10753 (2018). [4] Gaeta, A. L., Lipson, M. and Kippenberg T. J. "Photonic-chip-based frequency combs," Nat. Photonics, 13,
158-169 (2019).
[5] Wang, Z., Ma, M., Sun, H., Khalil, M., Adams, R., Yim, K., Jin, X. and Chen, L.R. "Optical frequency comb generation using CMOS compatible cascaded Mach–Zehnder modulators," IEEE J. Quantum Electron, 55(6), 8400206 (2019).
[6] Baudot, C., Fincato, A., Flower, D., Perez-Galacho, D., Souhaité, A., Messaoudène, S., Blanc, R., Richard, C., Planchot, J., De-Buttet, C., Orlando, B., Gays, F., Mezzomo, C., Bernard, E., Marris-Morini, D., Vivien, L., Kopp C. and Boeuf F., “Daphne silicon photonics technological platform for research and development on WDM applications,” Proc. SPIE 9891, 98911D (2016).