HAL Id: hal-02997050
https://hal.telecom-paris.fr/hal-02997050
Submitted on 9 Nov 2020
HAL is a multi-disciplinary open access
archive for the deposit and dissemination of
sci-entific research documents, whether they are
pub-lished or not. The documents may come from
teaching and research institutions in France or
abroad, or from public or private research centers.
L’archive ouverte pluridisciplinaire HAL, est
destinée au dépôt et à la diffusion de documents
scientifiques de niveau recherche, publiés ou non,
émanant des établissements d’enseignement et de
recherche français ou étrangers, des laboratoires
publics ou privés.
Subjective and objective quality assessment of the
softcast video transmission scheme
Anthony Trioux, Giuseppe Valenzise, Marco Cagnazzo, Michel Kieffer,
François-Xavier Coudoux, Patrick Corlay, Mohamed Gharbi
To cite this version:
Anthony Trioux, Giuseppe Valenzise, Marco Cagnazzo, Michel Kieffer, François-Xavier Coudoux, et
al.. Subjective and objective quality assessment of the softcast video transmission scheme. 2020 IEEE
International Conference on Visual Communications and Image Processing (VCIP), Dec 2020, Macau,
China. �hal-02997050�
Subjective and Objective Quality Assessment of the
SoftCast Video Transmission Scheme
Anthony Trioux
∗, Giuseppe Valenzise
†, Marco Cagnazzo
‡, Michel Kieffer
†, Franc¸ois-Xavier Coudoux
∗,
Patrick Corlay
∗, Mohamed Gharbi
∗∗UMR 8520 - IEMN, DOAE, Univ. Polytechnique Hauts-de-France, CNRS, Univ. Lille, YNCREA, Centrale Lille,
F-59313 Valenciennes, France
†LTCI, T´el´ecom ParisTech, Institut Polytechnique de Paris, France ‡Univ. Paris-Saclay, CNRS, CentraleSup´elec, L2S, 91192 Gif-sur-Yvette, France
{anthony.trioux, francois-xavier.coudoux, patrick.corlay, mohamed.gharbi}@uphf.fr, {giuseppe.valenzise, michel.kieffer}@l2s.centralesupelec.fr, cagnazzo@telecom-paris.fr
Abstract—SoftCast-based linear video coding and transmission (LVCT) schemes have been proposed as a promising alternative to traditional video coding and transmission schemes in wireless environments. Currently, the performance of LVCT schemes is evaluated by means of traditional objective scores such as PSNR or SSIM. Nevertheless, since the compression is performed in a very different way from traditional coding schemes such as HEVC, visual artifacts are also quite different and deserve to be subjectively assessed. In this paper, we propose a subjective quality assessment of SoftCast, pioneer and standard of the LVCT schemes. This study aims to better understand the trade-offs between the LVCT parameters that can be tuned to improve the quality. These parameters, including different GoP-sizes, Compression Ratios (CR) and Channel Signal-to-Noise Ratio (CSNR), are used to generate a dataset of 85 videos. A Double Stimulus Impairment Scale (DSIS) test is performed on the received videos to assess the perceived quality. Results show that the key characteristic of SoftCast, the linear relation between CSNR and PSNR, is also observed with the Mean-Opinion Scores (MOS), except at high CSNR where the quality saturates. In addi-tion, Bjøntegaard model is used to quantify the trade-offs between CR, GoP-size and CSNR, depending on the intended application. Finally, the performance of objective metrics compared to the obtained MOS is evaluated. Results show that Multi-Scale SSIM (MS-SSIM), SSIM and Video Multimethod Assessment Fusion (VMAF) metrics offer the best correlation with the MOS values. Index Terms—SoftCast, Linear Video Coding, Joint Source-Channel Coding, Subjective Quality Assessment, Visual Artifacts
I. INTRODUCTION
Linear video coding and transmission (LVCT) systems [1]–[8] have been proposed as a promising alternative to H.264/AVC or HEVC-based video transmission schemes [9] in wireless environments. The received video quality obtained with LVCT schemes such as SoftCast [1], WaveCast [2], etc. scales linearly with the Channel Signal-to-Noise Ratio (CSNR) [3] avoiding significant visual disturbances (e.g. freeze) ap-pearing in traditional schemes in the presence of suddenly degraded channel quality. This property comes from the linear processing applied to the pixels, avoiding quantization or entropy coding, and the transmission carried out without channel coding.
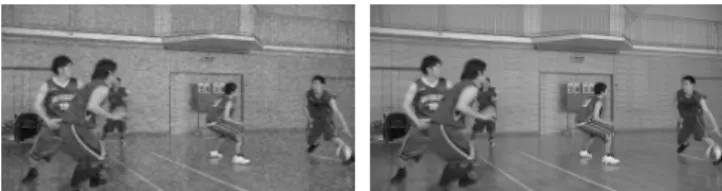
Fig. 1: Visual quality comparison for the BasketBall Drive sequence (frame No.90), GoP-size = 32, no compression applied. Left: strong snow-effect (CSNR=0dB), right: slight snow-effect (CSNR=15dB).
Although LVCT schemes, have been widely studied, perfor-mance evaluations mainly rely on classical objective metrics such as PSNR and SSIM. Nevertheless, since the compression is performed in a very different way from traditional coding schemes, visual artifacts are also quite different: (i) there is no blocking artifact due to the use of a Full-frame decorrelation transform [1], (ii) freezes of the video are avoided at low CSNR preserving the visual information. The price to be paid at low CSNR is the appearance of a snow effect [8] illustrated in Fig. 1, as well as temporal quality variations that depend on the GoP-size as observed in [7], [8]. Surprisingly, the impact of the whole artifacts of LVCT schemes on the perceived visual quality has not been yet assessed. To the best of our knowledge, the only related work concerns a study on a SoftCast-inspired still image linear coding and transmission scheme [5], which account for the foveation characteristic of the Human Visual System (HVS). However, subjective quality criteria are used to validate the performance of the proposed scheme against other LVCT schemes. Furthermore, as their scheme is designed for the transmission of still images, the temporal quality variations are not taken into account. As a result, it is essential to study this impact in order to better understand the quality of experience of LVCT schemes. In this paper, we choose to assess the received quality offered by SoftCast, as it represents the standard and the pioneer work of the LVCT schemes.
To this end, this paper describes (i) an evaluation of the received quality of video content processed by SoftCast through a Double Stimulus Impairment Scale (DSIS) test, (ii)
Receiver
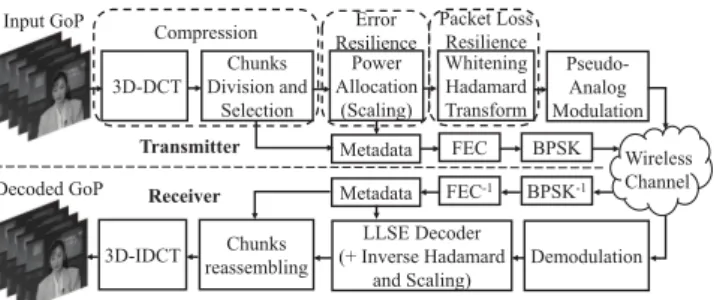
Compression ResilienceError 3D-DCT Chunks Division and Selection Power Allocation (Scaling) Whitening Hadamard Transform Pseudo-Analog Modulation Demodulation Transmitter LLSE Decoder (+ Inverse Hadamard and Scaling) 3D-IDCT reassemblingChunks
Packet Loss Resilience Metadata FEC BPSK Metadata FEC-1 BPSK-1 Input GoP Decoded GoP Wireless Channel
Fig. 2: Block diagram of the SoftCast scheme. an evaluation of the trade-offs between GoP-size, CR and CSNR based on the Bjøntegaard metric [10], (iii) an analysis of the correlation between MOS and objective metrics.
The remainder of the paper is organized as follows: Sec-tion II gives an overview of SoftCast and introduces the key parameters that influence the received quality. The experimen-tal setup of the subjective test is explained in Section III. Results are shown in Section IV. Conclusions and discussions are presented in Section V.
II. SOFTCAST SCHEMEREVIEW
The main components of SoftCast [1] are introduced in Fig. 2. SoftCast first takes a Group of Pictures (GoP) and uses a 3D full-frame DCT as a decorrelation transform. The DCT frames are divided into N small rectangular blocks of trans-formed coefficients called chunks. GoP-size represents the first key factor as a longer GoP may increases the received quality but induces longer latency and higher complexity [8]. Then, when the available channel bandwidth for the transmission is less than the signal bandwidth, i.e., only M < N chunks may be transmitted, SoftCast discards the N − M chunks with less energy. This is generally the case especially for the transmission of High Definition (HD) content as mentioned in [8]. At the receiver side, these discarded chunks are replaced by null values [1]. To represent the bandwidth limitation, we introduce the second key factor which is the compression ratio [8] (CR) defined as: CR=M/N .
The third block at the transmitter consists of a chunk scaling operation to match the transmission power constraints. The scaling coefficients are chosen so as to minimize the recon-struction Mean Square Error (MSE). A Hadamard transform is applied to the scaled chunks to provide packet loss resilience. This process transforms the chunks into slices. Each slice is a linear combination of all scaled-chunks. Finally, the slices are transmitted in a pseudo-analog manner using Raw-OFDM [1]. Classical channel coding is skipped. In parallel, the SoftCast transmitter sends an amount of data referred as metadata. These data consist of the mean and the variance of each transmitted chunk as well as a bitmap, indicating the positions of the discarded chunks into the GoP. Metadata are strongly protected and transmitted in a robust way (e.g., BPSK [1]) to ensure correct delivery and decoding.
At the receiver side, a Linear Least Square Error (LLSE) decoder is used to estimate the content of the chunks due to channel noise. Note that the noise represents the third key
5 10 15
Spatial Index (SI)
0 10 20 30 40
Temporal Index (TI) Touchdown Snow Mountain BQ Terrace BasketBallDrive
ParkJoy
Tractor Parkscene
Selected Sequences for DSIS test Selected Sequences for DSIS training phase
Fig. 3: Resulting Spatial and Temporal Information (SI, TI) indexes for the selected sequences.
factor that is considered through the CSNR = ¯P /σ2 where ¯
P = P/M , i.e., the total transmission power available at the transmitter divided by the M chunks and σ2 is the power of channel noise. Using the metadata, the decoded chunks are properly reassembled and undergo an inverse 3D-DCT, providing the corresponding GoP.
III. EXPERIMENTALSETUP
A. Environment
The subjective test aims at evaluating the subjective quality of video sequences received with a simulated SoftCast system. It is performed following the ITU-R BT.500-14 recommenda-tion [11] in a dark and quiet room, with a measured ambiant luminance of 2 lux. The screen used for display is a Full HD Dell UltraSharp U2410 24”.
B. Observers
Twenty-one people took part in the experiment (8 women and 13 men) with all of them having a normal or corrected to normal visual acuity. The observers were aged between 25 and 47, and the average age was 29. The observers’ panel was made up of experts (≤ 15%, familiar with the SoftCast scheme or having specific knowledge in video processing) and newcomers in the domain.
C. Test methodology
To perform the subjective assessment, we selected the DSIS test Variant I [11] where the reference video (the original content) is presented first, then followed by the received video content. Each video lasts five seconds followed by a one second duration grey screen. Participants were then asked to evaluate the degradation level of the received video compared to the reference through a continuous impairment scale (start-ing from 0: “Very annoy(start-ing” to 100: “Imperceptible” by step of 20). The experiment interface was prepared on Matlab using Psychtoolbox [12]. Participants were allowed to pause the experiment in any moment and have a break if needed.
Before the experiment, oral instructions were given to the observers to explain the procedure and the purpose of the test. Then, a training session including 10 stimuli was organized for each observer prior to the test in order to familiarize them with the procedure, the specific artifacts of SoftCast as well as the impairment scale. Each degradation level was explained to the observer with a corresponding sample video sequence.
0 5 10 15 20 25 30 CSNR (dB) 0 20 40 60 80 100 MOS GoP=32, CR=0.25 GoP=32, CR=1 GoP=8, CR=0.25 GoP=8, CR=1 (a) BasketBallDrive 0 5 10 15 20 25 30 CSNR (dB) 0 20 40 60 80 100 MOS GoP=32, CR=0.25 GoP=32, CR=1 GoP=8, CR=0.25 GoP=8, CR=1 (b) ParkJoy 0 5 10 15 20 25 30 CSNR (dB) 0 20 40 60 80 100 MOS GoP=32, CR=0.25 GoP=32, CR=1 GoP=8, CR=0.25 GoP=8, CR=1 (c) ParkScene 0 5 10 15 20 25 30 CSNR (dB) 0 20 40 60 80 100 MOS GoP=32, CR=0.25 GoP=32, CR=1 GoP=8, CR=0.25 GoP=8, CR=1 (d) Snow Mountain 0 5 10 15 20 25 CSNR (dB) 0 20 40 60 80 100 MOS GoP=32, CR=0.25 GoP=32, CR=1 GoP=8, CR=0.25 GoP=8, CR=1 (e) Tractor
Fig. 4: MOS values vs CSNR for the five selected sequences. Red color: GoP-size=32. Blue color: GoP-size=8. CR=1: Solid lines. CR=0.25: Dotted lines.
These training sequences were not used in the main study. Each participant was then left alone and asked to evaluate 89 stimuli including 4 dummies (not considered in the final results) at the beginning that were replayed at the end of the test. A random list was generated for each participant such that the same content was never showed consecutively. The average duration of the whole test was about 28 minutes. D. Test material
Seven HD1080p video sequences, from the class B of the JCT-VC or from the Video Quality Experts Group (VQEG) database [13], were selected and used in this study to represent different levels of spatiotemporal complexity. As shown in Fig 3, the complexity is measured according to the Spatial and Temporal Information (SI, TI) [11] and computed over the duration of the video in the test, i.e., 5 seconds. A frame-rate downsampling at 25 fps was performed for the ParkJoy, BQ Terrace, and BasketballDrive sequences to avoid postprocessing by the display screen.
Two GoP-sizes of 8 and 32 frames, two CRs of 0.25 and 1 as well as a CSNR value varying from 0 to 30dB by 3dB step were retained in order to consider the temporal quality variations, bandwidth-constrained applications, as well as snow effect. As classically done in the literature [1]–[8] and as it does not influence the perception of the artifacts, only the luminance is considered in this paper. The number of chunks per image was kept constant and equals to 192 for all generated video samples.
IV. RESULTS
A. Analysis of the subjective data
Prior to the data processing step, the ITU-R BT.500-14 [11] outlier detection method is applied to the collected data to discard potential observers with random votes. No outlier was detected. Then, MOS values are computed for the 85 stimuli. As the number of participants is limited, we also add Confidence Intervals (CI) computation as recommended in [11]. Resulting MOS values according to the CSNR are shown in Fig. 4.
It is interesting to note that firstly, the key advantage of SoftCast, i.e., the fact that the PSNR increases linearly with the CSNR [3], is also observed when a subjective score such as the MOS is used. However, at high CSNR (≥ 20dB), a saturation effect appears since the scores already reach the “Imperceptible” level of the scale. Secondly, the MOS
values obtained when CR=0.25, (75% of the chunks are discarded), are logically lower than those when CR=1 case (no compression). Nevertheless, this is not always true as observed with the slow motion sequence Snow Mountain, where the case “GoP-size=32, CR=0.25” obtains similar scores to the case “GoP-size=8, CR=1”. This may be explained by the discomfort coming from the frequency of appearance of the temporal quality variations particularly viewable when the spatiotemporal complexity of the video is low. Finally, increasing the GoP-size for sequences with low spatiotemporal information (ParkScene and Snow Mountain) brings better perceived quality, in opposition to sequences with high spa-tiotemporal information, where MOS values are similar.
To quantify the average MOS and CSNR differences be-tween two configurations, we use the Bjøntegaard model in [10] with piecewise linear interpolation. In our case, Bjøntegaard delta rate (BD-Rate) are replaced by BD-CSNR.
TABLE I: BD-MOS results
Configuration Diff GoP-size (32-8) Diff CR (1-0.25)
CR=1 CR=0.25 GoP=8 GoP=32 Snow Mountain -17.98 -15.73 -12.51 -14.21 ParkScene -6.97 -6.89 -13.33 -12.96 Tractor -3.52 -4.99 -18.44 -15.39 Basketball -4.80 -5.03 -18.85 -17.60 ParkJoy -5.45 -1.39 -13.41 -18.37 Mean -5.19 -6.81 -15.31 -16.08
TABLE II: BD-CSNR results expressed in dB
Configuration Diff GoP-size (32-8) Diff CR (1-0.25)
CR=1 CR=0.25 GoP=8 GoP=32 Snow Mountain 6.29 5.95 4.46 4.78 ParkScene 2.30 2.13 4.22 4.41 Tractor 1.04 1.33 5.07 4.88 Basketball 1.37 1.42 5.21 5.19 ParkJoy 1.56 0.45 4.06 5.15 Mean 2.51 2.26 4.61 4.88
Results in Table I and II show the resulting MOS and CSNR differences considering the best scenario as the reference (ei-ther GoP-32 or CR=1). Depending on the intended application, we observe that:
• When considering power and bandwidth constrained ap-plications, increasing the GoP-size helps to compensate the losses due to compression for low spatiotemporal complexity videos such as Snow Mountain at the cost of
an increased latency. Now, if the power consumption is not a critical point, then losses due to compression can be compensated by allocating more power at the transmitter, recalling that the CSNR is proportional to the available power at the transmitter. In this experiment, increasing the CSNR by about 5dB allows to compensate the losses due to a bandwidth reduction of 75%;
• In contrast, when considering low latency applications, the use of a small GoP leads to small average losses in terms of MOS of about -6, (except for the Snow Mountain where losses are more important due to the discomfort coming from the temporal quality fluctuations particularly visible in such static content). Still, these losses can be compensated by allocating more power at the transmitter as observed in Table II where similar MOS are obtained when increasing the CSNR by 2.5dB in average. B. Performance of objective quality metrics
In the following, we assess the ability of popular objec-tive metrics including PSNR, SSIM, and the recent VMAF metric [14] to predict the obtained MOS. The prediction is evaluated according to the accuracy, monotonicity and consistency respectively through the following indexes: The Pearson Correlation Coefficient (PCC) and the Root Mean Squared Error (RMSE), the Spearman Rank Order Correlation Coefficient (SROCC) and the Outlier Ratio (OR) [11]. These indexes are computed after applying non-linear regression over the data as explained in [15].
TABLE III: SROCC, PCC, OR and RMSE results.
PCC SROCC OR RMSE
PSNR 0.810 0.829 0.094 15.897
SSIM 0.963 0.970 0.000 7.289
MS-SSIM 0.947 0.949 0.000 8.735
VMAF 0.940 0.943 0.024 9.245
Table III shows the resulting values for each objective met-ric. It is interesting to note that good scores are obtained with all considered metrics (few outlined scores, high correlation ≥ 0.8); the best results are obtained for the SSIM, MS-SSIM and VMAF metrics. Although the VMAF metric has not been trained on SoftCast artifacts, it gives highly correlated scores with MOS values; the PSNR obtains the lowest scores, but still satisfactory (SROCC and PCC ≥ 0.81).
V. DISCUSSIONS AND CONCLUSIONS
This paper considers the subjective video quality assessment of the SoftCast scheme, pioneer of the LVCT schemes. An evaluation of the impact of the artifacts on the perceived visual quality has been proposed. This study considers different GoP-sizes, CRs and CSNR values resulting in the first video database related to the SoftCast scheme. The latter, including 85 video samples annotated with MOS and objective metrics, is available upon request. Performance evaluation of the Soft-Cast scheme has been performed through a DSIS subjective test and results have been compared to objective metrics.
The experimental results showed that the key characteristic of SoftCast, the linear relationship between CSNR and PSNR, is also observed with MOS values, except at high CSNR where the quality saturates. In addition, Bjøntegaard model has been used to quantify the trade-offs between CR, GoP-size and CSNR. Depending on the intended application, increasing the GoP-size for low spatiotemporal complexity videos helps to compensate the losses due to compression when considering power and bandwidth constrained environments at the cost of an increased latency. In contrast, when considering low latency applications, the use of a small GoP leads to MOS reductions that can be compensated by allocating more power at the transmitter. Finally, results showed that MS-SSIM, SSIM and VMAF metrics give the best correlation coefficients with the MOS values and should be considered for evaluating the performance of the LVCT schemes. Further research may concern the reduction of the specific artifacts (temporal quality variations, snow effect) generated by such schemes.
ACKNOWLEDGMENT
We would like to thank the French National Research Network GdR 720 ISIS for the mobility support. We also would like to thank Dr. Emin Zerman for his help in preparing the experiment interface as well as all the participants.
REFERENCES
[1] S. Jakubczak and D. Katabi, “Softcast: one-size-fits-all wireless video,” in Proceedings of the ACM SIGCOMM 2010 conf., 2010, pp. 449–450. [2] X. Fan, R. Xiong, F. Wu, and D. Zhao, “Wavecast: Wavelet based wireless video broadcast using lossy transmission,” in Proc. IEEE Visual Commun. and Image Process. (VCIP), Nov. 2012, pp. 1–6.
[3] R. Xiong, F. Wu, J. Xu, X. Fan et al., “Analysis of decorrelation transform gain for uncoded wireless image and video communication,” IEEE Trans. Image Process., vol. 25, no. 4, pp. 1820–1833, Apr. 2016. [4] J. Zhao, R. Xiong, C. Luo et al., “Wireless image and video soft transmission via perception-inspired power distortion optimization,” in IEEE Visual Commun. Image Process. (VCIP), Dec. 2017, pp. 1–4. [5] J. Shen, L. Yu et al., “Foveation Based Wireless Soft Image Delivery,”
IEEE Trans. Multimedia, vol. 20, no. 10, pp. 2788–2800, Oct. 2018. [6] A. Trioux, F.-X. Coudoux et al., “A reduced complexity/side information
preprocessing method for high quality softcast-based video delivery,” in European Workshop on Visual Inform. Process. (EUVIP), 2019. [7] S. Zheng, M. Cagnazzo, and M. Kieffer, “Optimal and suboptimal
channel precoding and decoding matrices for linear video coding,” Signal Proc.: Image Commun., vol. 78, pp. 135–151, Oct. 2019. [8] A. Trioux, F.-X. Coudoux, P. Corlay, and M. Gharbi, “Temporal
infor-mation based GoP adaptation for linear video delivery schemes,” Signal Proc.: Image Commun., vol. 82, p. 115734, 2020.
[9] G. J. Sullivan, J. R. Ohm, W. J. Han, and T. Wiegand, “Overview of the High Efficiency Video Coding (HEVC) Standard,” IEEE Trans. Circuits Syst. Video Technol., vol. 22, no. 12, pp. 1649–1668, Dec. 2012. [10] P. Hanhart and T. Ebrahimi, “Calculation of average coding efficiency
based on subjective quality scores,” Journal of Visual Commun. and Image Representation, vol. 25, no. 3, pp. 555–564, Apr. 2014. [11] “RECOMMENDATION ITU-R BT.500-14 - Methodologies for the
subjective assessment of the quality of television images,” Oct. 2019. [12] M. Kleiner et al., “What’s new in psychtoolbox-3,” Perception, vol. 36,
no. 14, pp. 1–16, 2007. [Online]. Available: http://psychtoolbox.org/ [13] VQEG, “VQEG HDTV database. video quality experts group (VQEG).”
[Online]. Available: http://www.its.bldrdoc.gov/vqeg/projects/hdtv [14] C. G. Bampis et al., “Spatiotemporal Feature Integration and Model
Fusion for Full Reference Video Quality Assessment,” IEEE Trans. Circuits Syst. Video Technol., vol. 29, no. 8, pp. 2256–2270, Aug. 2019. [15] VQEG, “Final report from the video quality experts group on the validation of objective models of video quality assessment, phase II,” 2003.