HAL Id: hal-00609289
https://hal.archives-ouvertes.fr/hal-00609289
Submitted on 18 Jul 2011
HAL is a multi-disciplinary open access
archive for the deposit and dissemination of
sci-entific research documents, whether they are
pub-lished or not. The documents may come from
teaching and research institutions in France or
abroad, or from public or private research centers.
L’archive ouverte pluridisciplinaire HAL, est
destinée au dépôt et à la diffusion de documents
scientifiques de niveau recherche, publiés ou non,
émanant des établissements d’enseignement et de
recherche français ou étrangers, des laboratoires
publics ou privés.
Peer-assisted time-shifted streaming systems: design
and promises
Yaning Liu, Gwendal Simon
To cite this version:
Yaning Liu, Gwendal Simon. Peer-assisted time-shifted streaming systems: design and promises.
ICC2011 : IEEE International Conference on Communications, Jun 2011, Kyoto, Japan.
�hal-00609289�
Peer-Assisted Time-shifted Streaming Systems:
Design and Promises
Yaning Liu
1,2 1State Key Lab. of Networking and Switching Tech.
Beijing Univ. of Posts and Telecommunications, China
[email protected]
Gwendal Simon
22
Computer Science Department
Institut Telecom - Telecom Bretagne, France
[email protected]
Abstract—Time-shifted streaming (or catch-up TV) allows viewers to watch their TV programs within an expanded time window. In this paper, we emphasize the challenging charac-teristics of time-shifted TV systems that prevent known delivery systems to be used. We model time-shifted TV as multiple-interval graph, then we present a Peer-Assisted Catch-Up Streaming system, namely PACUS, where a set of end users’ computers assists the server for the content delivery. We show in particular how the PACUS tracker server can be efficiently implemented for catch-up TV. We demonstrate the benefits of PACUS by simulations. We especially highlight that PACUS reduces the traffic at the server side with the advantages of lightweight and self-adaptive unstructured peer-to-peer systems.
Index Terms—Time-shifted IPTV; Peer-to-Peer; Interval Graph; Video Streaming.
I. INTRODUCTION
In time-shifted TV, a program broadcasted from a given time
t is made available at any time from t to t+ δ where δ can
be potentially infinite. The popularity of TV services based on time-shifted streaming has dramatically rised [1]: nPVR (a Personal Video Recorder located in the network), catch-up
TV (the broadcaster records a channel for a shifting number
of days, and proposes the content on demand), TV surfing (using pause, forward or rewind commands), and start-over (the ability to jump to the beginning of a live TV program). Today, to enjoy catch-up TV requires a Digital Video Recorder (DVR) connected to Internet. However, TV broadcasters need to protect advertisement revenue whereas a DVR viewer can decide to fast forward through commercials. By controlling the TV stream, not only the broadcasters may guarantee that commercials are played, but also they can adapt them to the actual time at which the viewer watches the program.
Unfortunately, building a large-scale time-shifted streaming service is not trivial. Delivery systems for IPTV can not be utilized because, contrarily to live streaming systems, time-shifted systems can not directly use group communication techniques like multicast protocols, for the reason that clients require distinct portions of the stream. Besides, the disk-based servers that are currently used in on-demand video services (VoD) have not been designed for concurrent read and write operations [2]. Classic VoD servers can not massively ingest content, and keep pace with the changing viewing habits of subscribers. As a matter of facts, time-shifted channels are restricted to a time delay ranging from one to three hours,
despite only 40% of viewers watch their program less than
three hours after the live program [3].
Several works have highlighted the problems met by time-shifted systems based on a centralized architecture [4–6]. New server implementations are described in [6]. Cache replication and placement schemes are extensively studied by the authors of [4]. When several clients share the same optical Internet access, a patching technique described in [5] is used to handle several concurrent requests, so that the server requirement is reduced. These works however do not tackle the scalability issue met by time-shifted streaming systems. A peer-to-peer architecture for time-shifted streaming systems has been addressed in [7–9]. These systems are based on a predefined achitechture, such as Distributed Hash Table (DHT) or turntable. The use of the hash function in DHT [7, 8] seems irrelevant in this context because chunks are iteratively produced. Furthermore, a peer departure conducts to multiple deletions in the DHT. In [9], a replication algorithm prevents the most unpopular past portions to be out of the system.
Our contributions. In this paper, we evaluate the gains that
can be obtained from the implementation of a peer-assisted architecture, where a peer is a connected device located at the home of a client watching a past portion of the stream. This peer can store the content that it just consumed, and serve another viewer requesting this content. A tracker (i.e., a management server) is in charge of coordinating the peer-to-peer exchanges. This peer-to-peer-assisted architecture is expected to significantly reduce the burden at the server side. Our goal is to quantify these gains in realistic simulations.
The first challenge is to model the behaviors of a population of clients, with respect to the unavailability of real traces so far. We compose an analysis of the behavior of a casual time-shifted TV viewer from several recent measurement studies, then we produce a set of synthetic traces, which are expected to reflect the reality. It is detailed in Section II. The second challenge is to optimize the performances of the peer-assisted architecture. We present a model based on multiple-interval
graphs, then we introduce in Section III several strategies,
which can be implemented on the tracker side in order to establish fast and efficient connections among peers.
We describe our results in Section IV. The results we obtained are better than expected: the behavior of clients of time-shifted TV actually matches the properties of the
peer-assisted architecture. We show in particular that up to 90% of requests can be fulfilled by peers. That is, a large majority of the traffic does not need the server, which is only used for requests on unpopular past portions of the TV stream.
II. CHARACTERIZINGCATCH-UPTV
The variability of clients’ access to the content drives the design of time-shifted streaming systems. Understanding user behavior is critical, however, it is difficult to obtain real traces for several reasons. First, the services associated with time-shifted are multiple (nPVR, catch-up TV, etc.), and still under construction. Second, current population of clients is not representative of the future population. Third, clients using DVR for time-shifted TV can not be measured, although they represent a majority of current time-shifting users.
We have analyzed some available data, then we have gen-erated a synthetic set of traces from the observation of other related measurements. We are confident in the accuracy of this set of data, which are available for downloading1. In our
opinion, this set of data can be used as instance of the time-shifting problem until catch-up TV services become popular.
Two sets of studies conducted in 2008 and 2009 have been utilized. The first set is real measurements by DVR vendors. Typically, the main actor, namely TiVo, gives regularly data about the usage of its set-top-boxes2. We also used a Nielsen
report [3] that gives precious insights about user behavior. The second set of related works is the measurements conducted on IPTV [10] and VoD systems [11].
The popularity of every program is chosen in a predefined distribution, this popularity being strictly decreasing with time. The relevance of Zipf distribution to describe the popularity of content in current large-scale applications has been demon-strated. Studies have however revealed that programs within a given channel do not follow such a distribution. Contrarily, it is established that the program popularity is a factor that it is less important than the time at which the user watches TV. In [3], a quarter of shifters have a stream lag that is less than one hour, around 40% of them watch their program less than 3 hours
after the live program, and more than half of shifters enjoy a program broadcasted the same day. Some programs can be more popular than others, but this popularity is expected to be a consequence of the hour usage of catch-up TV.
In [12], a peak has been identified at the beginning of each program, where many viewers start streaming the content. Then, as can be also stated in VoD systems, the spikes of departure have been shown to occur mostly either at the end of the program, or because the user does not find any interest after browsing the beginning of the program. Peers usually leave immediately and simultaneously at the end of programs [13]. Moreover, a large number of sessions end in the first minute, which means that these clients are not interested in the programs after browsing through the beginning. In this study, more than half of the population quits during the first ten
1http://enstb.org/∼gsimon/Resources/Time-shifted 2http://stopwatch.tivo.com
minutes of a program in average. Moreover, in most cases, the more popular is the program, the shorter is the session length. The TV prime-time is clearly on evening. Measurements made in [3] confirm that clients are obviously more connected at certain time of the day than others. In US, only 1% of
clients start watching catchup-TV between 6 : 00 AM and 7 : 00 AM. On the contrary, more than 11% join the system
between 9 : 00 PM and 10 : 00 PM (note that clients begin
watching live programs before time-shifting, typically after a pause or a rewind through immediate past content). In our simulator, we have reproduced the same trend. We create
x new peers at every cycle. During less attractive hours, x
equals1 while it can be equal to 10 at the prime-time. These
arrival are compensated by natural churn, either because of the aforementioned TTL, or because of crash.
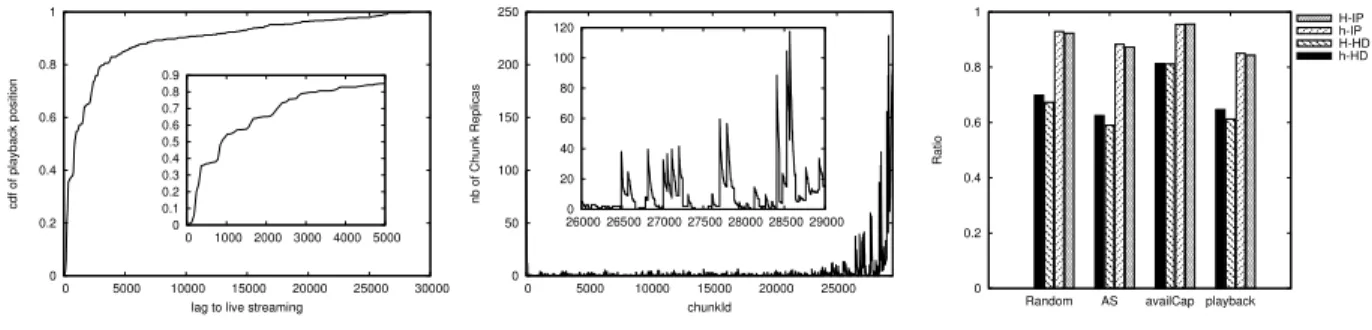
This set of data, available online, models a behavior that tends to be in favor of recent TV programs, with a few exceptions. Figure 2 represents the Cumulative distribution Function (CDF) of the lag of shifters at the end of our simu-lation. The embedded plot zooms on the 5,000 first minutes,
which represents actually more than80% of shifters. A point
at (1,000, 0.50) means that half of shifters are watching a
program broadcasted less than 1,000 minutes ago. Note on
the embedded figure that variable program popularity results in a sinuous curve. This curve is actually conform with the recent measurements made in [3].
III. PEER-ASSISTEDARCHITECTURE
We now describe the algorithms for a peer-assisted archi-tecture: a cache-and-relay approach (peer stores the video portions they consumed) combined with a tracker. Peer-assisted systems have attracted the attention of video service providers for VoD (e.g. [14, 15]), but, to our knowledge, such architecture has not been studied for time-shifted systems yet.
A. Multiple-Interval Graph Model
We propose to use the well-known multiple-interval graph structure to model the nodes and the relationships that can be established among them. First, we recall the main principle behind this structure, then we explain why this structure is adequate for time-shifted streaming systems.
In an interval graphs, a vertex is associated with an interval on the real line, and an edge occurs between two vertices if their intervals overlap [16]. A multiple-interval graph is a generalization of interval graph where every vertex is associ-ated with several intervals, and the edge between two vertices
x and x′ exists if one interval associated with x overlaps
with one interval associated with x′ [17]. Multiple-interval
graphs model problems like multi-task scheduled problems and resource allocation problems.
In time-shifted streaming systems, nodes are likely to store video portions, and not a set of unrelated chunks. In proposals that are based on the cache-and-relay principle, nodes store multiple distinct portions if clients use fast forward or rewind commands. Let represent the whole stream in Figure 1 by a real line (i.e., the horizontal line) with the time direction from
right to left, where ch0is the earliest chunk in the system, chn
is the freshest chunk (live chunk), and a video portion indicates an interval (denoted by a real horizontal line). In our example, five peers from p1to p5are watching TV in this scenario. Each
peer is associated with a set of intervals, which correspond to the video portions it stores, and a playback position denoted by a big black ball. In multiple-interval graphs, two peers x and x′are linked when one video portion stored by x overlaps
with one video portion of x′. In this example, every peer is
associated with every other peer because any pair of peers have at least one overlapping interval.
We represent the overlay created by the tracker on the right right part of Figure 1. We establish a directed link from a node
x to a node x′, when the playback position of x′ is covered
by an interval of peer x. The link direction means that x may act as a server for x′. The final overlay is a directed sub-graph
of the multiple-interval graph with video portions and nodes. The advantages of the multiple-interval structure are as fol-lows. Let consider that a central authority has a full knowledge of the participating nodes. Upon reception of requests from clients for past stream portion, this front-end server has to discover as quickly as possible the set of nodes that stores the given chunk, i.e. the peers that store a video portion containing this chunk. If this central authority maintains a multiple-interval graph in order to store information from the set of peers (which peer stores which interval), then it can make use of one of the many fast deterministic algorithms [17] that have been proposed in the literature for that purpose.
B. Tracker-Peer Implementation
In this paper, we opt for a hybrid architecture based on a tracker, which is expected to have a global knowledge of the system, as shown in the left part of Figure 1. Our motivation is that the service provider is expected to keep the control on the stream delivery, in order for instance to adapt commercials to the actual watching time. The main mission of the tracker is to provide to every peer u a set P(u) of peers having the
chunk requested by u (called peerset).
1) Peer to Tracker Communication: The tracker is only
interested with the two endpoints of each interval stored by a peer, and does not need to know every chunk belonging to this interval. Concretely, when a peer u starts a new program (first joins or implements a switch), it notifies the tracker. From the index of the first chunk of this program, the tracker should be able to infer at any time the chunk that is currently played by u, because of the uniform speed of video playback. When
u finishes the program (leaves or switches again), the tracker
records the last chunk that is been played at u, and stores this interval related with u. This strategy, which leverages on the linearity of the video playback, alleviates the burden on the tracker and reduces system control messages. Furthermore, a peer also notifies the tracker on a periodical basis. These notifications allow the tracker to implement a failure detector, that is, a tracker is able to determine if a peer is still alive. If a peer is detected as no longer participating to the system,
chn chi ch0 playback direction p1 p2 p3 p4 p5 p1 p5 p2 p4 p3
Fig. 1. Multiple-Interval representation: the overlay generated by tracker
the tracker should discard all intervals related with this peer. In our simulation, peers notify the tracker every ten minutes.
2) Tracker to Peer Communication: When a tracker
re-ceives a notification from a peer u, either u starts watching a new program, or a periodic notification, the tracker is expected to reply with a set P(u) of other peers having high probability
to be able to serve u until the next notification. First, the tracker should determine the set P(u) of peers storing the
next chunk requested by u. The model based on multiple-interval graphs simplifies the task of the tracker. Indeed, a vast literature has explored the attractive opportunities of multiple-interval graphs, where most classic problems can find a solution in polynomial time. In our implementation, we use classic algorithms for lookup and subset discovery. Because the size of P(u) can be large, we decide that the tracker sends
information of a subset P(u) ⊆ P(u). We will present in
Section III-C several strategies for choosing this subset.
3) Peer to Peer Communication: When the peer u receives
the peerset P(u), it can decide to download the requested
chunk from one or several of these peers. Many works have dealt with efficient stream delivery from a set of potential servers. We prefer here to let the system designer decide the best algorithm, which depends on many parameters, typically the video encoding. Please note that, in our simulation, we im-plemented the simplest solution: the peer u chooses randomly in P(u) one peer, which is in charge of delivering the chunk
if it has the capacity to do it.
C. Neighborhood Selection Strategies
We detail now strategies to select a subset P(u) among the
set P(u) of peers that owns the chunk requested by u.
Strategy AvailCap. In an idealized system, the tracker is
able to consider the available upload capacity of the peers in
P(u), then to select the most powerful peers, and, in case of
ties, the peers having the longest series of consecutive chunks. This strategy ensures to peer u a high probability to be served until the next notification. It requires however to be aware of the available capacity of every peer at any time. It is a strong assumption, which requires to implement peers’ performance monitoring. Nevertheless, we have implemented this strategy because it is intuitively a near-optimal strategy.
Strategy Random. On the contrary, the simplest strategy
consists in selecting a random subset P(u) in P(u). Note that
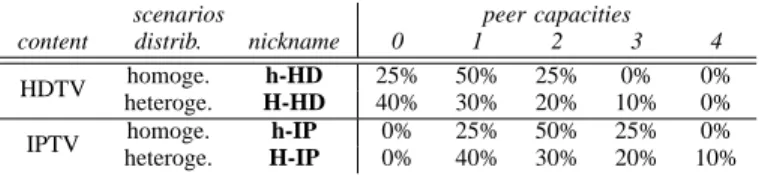
scenarios peer capacities
content distrib. nickname 0 1 2 3 4
HDTV homoge. h-HD 25% 50% 25% 0% 0%
heteroge. H-HD 40% 30% 20% 10% 0% IPTV homoge. h-IP 0% 25% 50% 25% 0% heteroge. H-IP 0% 40% 30% 20% 10%
TABLE I
DISTRIBUTION OF PEER CAPACITY
set, but it does not take into account that(i) some peers may
have a larger upload capacity than others (a peer with poor upload capacity is selected as frequently as a powerful peer), and(ii) some peers have longer intervals than others (a surfer
peer is chosen as frequently as a leaver).
Strategy AS. In another strategy, the goal is to take
into account the underlying network. The network-friendly aspect of peer-to-peer systems has received a lot of attention recently [18]. In order to limit the potentially high impact of traffic generated by peer-to-peer technologies on the un-derlying network, various works have explored the building of overlays based on network distance between peers. These works include in particular clever algorithms at the tracker side [18]. We suggest to implement also a network-friendly strategy where the tracker selects the peers in P(u) that are the
closest to u. Here the distance can be measured by the latency or the number of traversed Autonomous Systems (ASes).
Strategy Playback. Finally, the last strategy we have
im-plemented consists in selecting the peers whose overlapping interval is also a current interval and whose playing position is the closest. This strategy has been implemented in several popular peer-to-peer VoD systems [13]. If the peers are not surfers, they will probably continue to watch the program for a while. Hence, the peer u has higher probability to find at least one peer having the chunks until the next notification.
IV. SIMULATIONS
We use PeerSim [19], a simulator targeting large-scale and dynamic overlays. We aim at evaluating the feasibility and performances of Peer-Assisted systems under various contexts. We focus on the measurements of the load reduction on the server and the reduction of the cross-domain traffic.
A. Simulation Configuration
We have depicted in Section II a part of the configuration parameters. The exact settings are available on our website. Readers are invited to freely use these simulation instances. We detail now some additional simulation parameters. At every cycle, a new chunk, i.e. the basic video unit, is generated. We consider that a chunk represents one minute of stream in our simulator. Of course, when several peers can provide a given chunk, a peer would benefit from a coordinated transmission. In this simulations, we choose a simpler model where a peer transmit a chunk in its entirety to another peer.
According to previous measurements [10], peers get as-signed a role: half of the peers are surfers (watch a same program during1 or 2 chunks before switching), 40% of them
PACUS Centralized Difference
HDTV scenario 6.12 13.28 −53.9%
IPTV scenario 3.57 13.28 −73.1%
TABLE II
AVERAGE NUMBER OF TRAVERSEDASBY CHUNK
are viewers (switch after a duration uniformly chosen between
2 and 60 minutes), and 10% are leavers (stay on a program
during a time ranging from 60 to 1800 chunks, i.e. a TV
constantly opens during up to 30 hours). Moreover, we do
not tolerate infinite surfers, so every peer is associated with a
Time-To-Live, either6 consecutive switches, or 5,000 minutes.
We describe now two crucial settings: the upload capacity of peers, and the location of peers in the network. In our system, peers are expected to upload a whole chunk to other peers, i.e., one data transmission consists of one-minute long stream delivery. Therefore, the capacity of a peer is described as the number of concurrent streams that the peer is able to send to other peers. We have simulated tow scenarios: High-Definition TV (HDTV) and classic IPTV. In the HDTV, the average capacity of peers is 1 (in average, a peer is able to
send one stream to one peer only), although peers could serve in average2 peers in classic IPTV scenario. Besides, we have
basically considered two scenarios of the distribution of the peer capacities, either homogeneous (most peers have the same capacities), or heterogeneous (many peers have no capacity, but some powerful peers can deliver a lot). We describe in Table I the four considered scenarios with their nicknames.
The location of peers depend also on the nature of the TV broadcaster. In our simulation, we have configured an Internet map from a CAIDA data-set containing 28,421 ASes. Peers
are uniformly spread over these ASes. This setting corresponds to a world-wide TV broadcaster, the main target for our study. Finally, the number of cycles is 30,000, i.e., more than 20 days. This duration is actually far longer than the current
offers of TV broadcasters, where the duration is in the order of the hours. Besides, random effects are avoided by using five distinct instances, for every simulation settings.
B. Simulation Results
We first highlight a result that makes the case for peer-assisted architecture. We present in Figure 3 the number of replicas of every chunk from time 0 to time 30,000 at the
end of our simulation. In the embedded figure, we zoom on a smaller area from time 26,000 to time 29,000. Obviously,
only active peers are represented. This result shows inevitably that the most replicated chunks are the recent chunks. Now, we invite the reader to recall Figure 2 where the lags of clients are represented. The number of chunk replicas in Figure 3 is actually conforming with chunk popularity in Figure 2. Indeed, the more requested are the chunks, the more replicated they are. This is especially true in the embedded Figure. Actually, even the popularity of programs, which varies, produce high differences between chunk replicas. Of course, this is a natural result obtained by active clients. We highlight this result to
0 0.2 0.4 0.6 0.8 1 0 5000 10000 15000 20000 25000 30000 cdf of playback position
lag to live streaming 0 0.1 0.2 0.3 0.4 0.5 0.6 0.7 0.8 0.9 0 1000 2000 3000 4000 5000
Fig. 2. Distribution of playing positions
0 50 100 150 200 250 0 5000 10000 15000 20000 25000 nb of Chunk Replicas chunkId 0 20 40 60 80 100 120 26000 26500 27000 27500 28000 28500 29000
Fig. 3. Chunk replicas distribution
0 0.2 0.4 0.6 0.8 1
Random AS availCap playback
Ratio
h-HD H-HD h-IP H-IP
Fig. 4. Ratio of chunks retrieved from peers
explain why peer-assisted architecture fits remarkably with catch-up TV: the storage capacity of peers is automatically utilized for the most popular chunks. Please note that some chunks in early period do not have any replica. It means that a client on this period has no other choice but to request missing chunks from the server. In order to guarantee chunk availability, a new replica mechanism deserves to be devised. We now present in Figure 4 the most important result of our system: the percentage of chunk requests that are handled by a peer. Obviously, the larger is the percentage, the better is the system because the less saturated is the server. We highlight three observations. First, the ratio of requests handled by the peer-to-peer system is very important. In the IPTV scenario, this ratio represents more than 80% of requests. More than
half of requests can also be treated in the HDTV scenario. This awesome result means that the server can actually be used as a backup server or for other purposes. Second, as can be expected, the strategy where the tracker is able to know the available capacity of every peer outperforms the other strategies. We notice the relatively poor performances of the strategy based on the proximity of playback position. Despite its flaws, the random strategy has better results than the network-friendly one. Third, the heterogeneous distribution of peer capacity does not really affect the capacity of the system. However, when the tracker can not rely on such information, results are slightly dropping, but the drop is negligible.
Finally, we study the overall impact on the network in Ta-ble II. The peer-assisted system is compared with a centralized system with only one server. For every chunk request, we count the number of ASes traversed by the chunk in the peer-assisted system, and compare it in the case that it comes from the server. Hence, we measure the overall cross-domain traffic generated by the catch-up TV system. For the peer-assisted system, we use the AS-friendly strategy.
We observe that the results are impressive with gains that reach up to 73%. Actually, a peer-assisted architecture is not
only a way to reduce the traffic at the server side, it is also an architecture for reducing the overall traffic over the Internet. Therefore, a peer-assisted system should be of major interest for both service providers and network operators.
V. CONCLUSION
We have introduced in this paper the main characteristics of time-shifted TV systems. We demonstrate that a peer-assisted
architecture can absorb most of the video traffic, with an estimation that up to 80% of the traffic can be handled by peers when the video quality is IPTV. Moreover, we propose several strategies at the tracker side. Finally, we show that a simple AS-friendly strategy in the tracker can significantly reduce the overall cross-domain traffic.
REFERENCES [1] Three Screen Report Q1, Nielsen, June 2010.
[2] Evolving Requirements for On Demand Networks, Motorola, Mar. 2009. [3] How DVRs Are Changing the Television Landscape, Nielsen, Apr. 2009. [4] J. Zhuo, J. Li, G. Wu, and S. Xu, “Efficient cache placement scheme for clustered time-shifted TV servers,” IEEE Transactions on Consumer Electronics, vol. 54, no. 4, pp. 1947–1955, November 2008.
[5] W. Xiang, G. Wu, Q. Ling, and L. Wang, “Piecewise Patching for Time-shifted TV Over HFC Networks,” IEEE Transactions on Consumer Electronics, vol. 53, no. 3, pp. 891–897, Aug. 2007.
[6] C. Huang, C. Zhu, Y. Li, and D. Ye, “Dedicated Disk I/O Strategies for IPTV Live Streaming Servers Supporting Timeshift Functions,” in Proc. of IEEE CIT, 2007, pp. 333–338.
[7] F. V. Hecht, T. Bocek, C. Morariu, D. Hausheer, and B. Stiller, “LiveShift: Peer-to-Peer Live Streaming with Distributed Time-Shifting,” in Proc. of 8th Int. P2P Conf., 2008, pp. 187–188. [8] D. Gallo, C. Miers, V. Coroama, T. Carvalho, V. Souza, and P. Karlsson,
“A Multimedia Delivery Architecture for IPTV with P2P-Based Time-Shift Support,” in Proc. of 6th IEEE CCNC, 2009, pp. 1–2.
[9] Y. Liu and G. Simon, “Distributed Delivery System for Time-Shifted Streaming System,” in Proc. of IEEE Conference LCN, 2010. [10] M. Cha, P. Rodriguez, J. Crowcroft, S. Moon, and X. Amatrianin,
“Watching television over an ip network,” in Proc. of Usenix/ACM SIGCOMM Internet Measurement Conference (IMC), 2008.
[11] Y. Hongliang, Z. Dongdong, Z. B. Y., and Z. Weimin, “Understanding user behavior in large-scale video-on-demand systems,” SIGOPS Oper. Syst. Rev., vol. 40, no. 4, pp. 333–344, 2006.
[12] T. Wauters, W. V. de Meerssche, F. D. Turck, B. Dhoedt, P. Demeester, T. V. Caenegem, and E. Six, “Management of Time-Shifted IPTV Services through Transparent Proxy Deployment,” in Proc. of IEEE Globecom, 2006, pp. 1–5.
[13] Y. Huang, T. Z. J. Fu, D.-M. Chiu, J. C. S. Lui, and C. Huang, “Challenges, Design and Analysis of a Large-Scale P2P-VoD System,” in SIGCOMM Comput. Commun. Rev., 2008, pp. 375–388.
[14] V. Valancius, N. Laoutaris, L. Massouli´e, C. Diot, and P. Rodriguez, “Greening the Internet with Nano Data Centers,” in Proc. of ACM CoNEXT, 2009.
[15] Y. Chen, J. Leblet, and G. Simon, “On reducing the cross-domain traffic of box-powered cdn,” in Proc. of IEEE ICCCN, 2009.
[16] M. C. Golumbic, Algorithmic Graph Theory and Perfect Graphs. Aca-demic, 1980.
[17] A. Butman, D. Hermelin, M. Lewenstein, and D. Rawitz, “Optimization problems in multiple-interval graphs,” ACM Trans. Algorithms, vol. 6, no. 2, pp. 1–18, 2010.
[18] H. Xie, Y. R. Yang, A. Krishnamurthy, Y. Liu, and A. Silberschatz, “P4P: Provider Portal for Applications,” in ACM SIGCOMM, 2008. [19] Http://peersim.sourceforge.net.