HAL Id: hal-02388367
https://hal.archives-ouvertes.fr/hal-02388367
Submitted on 1 Dec 2019HAL is a multi-disciplinary open access archive for the deposit and dissemination of sci-entific research documents, whether they are pub-lished or not. The documents may come from teaching and research institutions in France or
L’archive ouverte pluridisciplinaire HAL, est destinée au dépôt et à la diffusion de documents scientifiques de niveau recherche, publiés ou non, émanant des établissements d’enseignement et de recherche français ou étrangers, des laboratoires
Operando Monitoring of the Solution-Mediated
Discharge and Charge Processes in a Na–O 2 Battery
Using Liquid-Electrochemical Transmission Electron
Microscopy
Lukas Lutz, Walid Dachraoui, Arnaud Demortière, Lee Johnson, Peter Bruce,
Alexis Grimaud, Jean-marie Tarascon
To cite this version:
Lukas Lutz, Walid Dachraoui, Arnaud Demortière, Lee Johnson, Peter Bruce, et al.. Operando Monitoring of the Solution-Mediated Discharge and Charge Processes in a Na–O 2 Battery Using Liquid-Electrochemical Transmission Electron Microscopy. Nano Letters, American Chemical Society, 2018, 18 (2), pp.1280-1289. �10.1021/acs.nanolett.7b04937�. �hal-02388367�
Operando monitoring of the solution-mediateddischarge and charge processes
1
in a Na-O2 battery using liquid-electrochemical TEM
2
Lukas Lutz1,3,4, Walid Dachraoui2,3, Arnaud Demortière2,3*, Lee R. Johnson4, 3
Peter G. Bruce4, Alexis Grimaud1,3*, and Jean-Marie Tarascon1,3 4
5
1 Collège de France, 11 Place Marcelin Berthelot, 75231 Paris, France 6
2Laboratoire de Réactivité et Chimie des Solides (LRCS), CNRS UMR 7314, 80009 Amiens, France 7
3Réseau sur le Stockage Electrochimique de l’Energie (RS2E), FR CNRS 3459, France 8
4Department of Materials, University of Oxford, Parks Road, Oxford OX1 3PH, UK 9
10
Corresponding authors: Alexis Grimaud <alexis.grimaud@college-de-france.fr>, 11
Arnaud Demortière <arnaud.demortiere@energie-rs2e.com> 12 13 14 15 16 17 18 19 20 21 22 23 24 25 26
Abstract
27
Despite the fact that in sodium-oxygen (Na-O2) batteries show promise as high-energy storage
28
systems, this technology is still the subject of intense fundamental research, owing to the 29
complex reaction by which it operates. To understand the formation mechanism of the 30
discharge product, sodium superoxide (NaO2), advanced experimental tools must be
31
developed. Here we present for the first time the use of a Na-O2 micro-battery using a liquid
32
aprotic electrolyte coupled with fast imaging transmission electron microscopy to visualize, in 33
real time, the mechanism of NaO2 nucleation/growth. We observe that the formation of NaO2
34
cubes during reduction occurs by a solution-mediated nucleation process. Furthermore, we 35
unambiguously demonstrate that the subsequent oxidation of NaO2, of which little is known,
36
also proceeds via a solution mechanism. We also provide insight into the cell electrochemistry 37
via the visualization of an outer shell of parasitic reaction product, formed through chemical 38
reaction at the interface between the growing NaO2 cubes and the electrolyte, and suggest that
39
this process is responsible for the poor cyclability of Na-O2 batteries. The assessment of the
40
discharge- charge mechanistic in Na-O2 batteries through operando electrochemical TEM
41
visualization should facilitate the development of this battery technology. 42
43
Keywords: Na-O2 battery, solution-mediated mechanism, discharge and charge
44
processes, Operando TEM, Parasitic product formation
45 46 47 48 49
Introduction
50
Compared to Li/Na-ion batteries, in which reversible energy storage relies on the use of redox 51
active transition metal oxides as positive electrodes, the metal-O2 battery systems would
52
theoretically offer greater energy density owing to the use the redox of gaseous oxygen using 53
conductive and light carbon electrodes.1, 2 The aprotic lithium-oxygen (Li-O2) system has
54
been widely studied since the early demonstration of reversibility by K.M. Abraham.3 55
Nevertheless, recent developments clearly pointed out towards drastic limitations in terms of 56
round trip efficiency as well as coulombic efficiency due to copious parasitic reactions of the 57
discharge product lithium peroxide (Li2O2) with both the conductive electrode and the
58
electrolyte. 4-6Following this conclusion, the sodium-oxygen (Na-O2) system was then
59
proposed as a viable alternative due to its theoretical energy density of 1100 Wh/kg combined 60
with a better round trip efficiency and presumably limited parasitic reactions.7 The Na-O2
61
system is still, however, in its infancy, owing to several unresolved challenges, such as 62
limited capacities and low cyclability.8, 9 Hence, the initial excitement was quickly 63
counterpoised by the recent discoveries highlighting the unstable nature of the superoxide 64
discharge product sodium superoxide (NaO2) that reacts with glyme-ethers solvent commonly
65
used in these systems. Despite these evident limitations, this system has been seen as an 66
interesting case study to better understand the complex redox reaction of oxygen in aprotic 67
solvent that involves a gas to solid phase transformation. Only mastering these complex 68
transformations will eventually trigger the development of rechargeable metal-O2 batteries
69
and deliver the initial promises offered by the large energy density for these systems. 70
Further efforts are thus required to understand and master the formation and decomposition 71
processes of the micron-sized cubic NaO2 product, which is at the core of the Na-O2
72
electrochemistry and still under heavy debate. Contradictory results discussing either a 73
solution-mediated discharge and charge reaction, the need for phase transfer catalysts (e.g.: 74
H2O) that increases the solubility of NaO2, or an electrode-surface directed mechanism, leave
75
the question for the fundamental reaction path unanswered.5, 10-17 One reason for that is surely 76
the high sensitivity of the NaO2 product and its reactivity towards moisture18, 19, CO220, 21 and
77
other electrolyte impurities, which makes any analysis by ex situ methods extremely difficult. 78
This also explains the absence of a common consensus regarding the parameters controlling 79
the formation of NaO2 as well as the underpinning mechanism for NaO2 decomposition. 5, 10-17
80
Another challenge of the Na-O2 system is associated to its unsatisfactory cyclability, where
81
recent papers have demonstrated that the fast death of the battery, after only few cycles, is 82
associated to the low stability of the NaO2 discharge product.8, 22 Others further identified the
83
detrimental ability of NaO2 to trigger parasitic reactions, where the origin of the parasitic
84
reactions includes the oxidation of the electrolyte and the carbon electrode, consequently 85
forming side products such as carbonates, carboxylates, formates and acetates.8, 23-25 However, 86
such results were obtained ex situ, hence leaving questions concerning the underpinning 87
mechanism or the effect of post-mortem sample handling, open. 88
Altogether, these studies clearly demonstrate the complexity of the Na-O2 system, which have
89
slowed down its development. Thus, there is a need to move away from the conventional 90
analytical ex situ characterization methods and develop operando techniques to pin-down 91
fundamental mechanisms in real-time.26 The recent development of liquid cell for 92
transmission electron microscopy27 enables an exciting opportunity to explore28, 29 and even 93
quantify30-32 complex electrochemical reactions occurring inside batteries during operation. In 94
the present study, we monitor for the first time the discharge and charge reactions occurring in 95
a liquid aprotic Na-O2 battery by using an operando electrochemical (scanning) transmission
96
electron microscopy (STEM and TEM) Na-O2 micro battery setup coupled with fast imaging.
97
This setup enables us to unambiguously prove that not only does the growth occur by a 98
cubes. Further, we visualize the formation of side products leading to the formation of 100
parasitic shell at the interface between NaO2 crystals and the electrolyte, which remains as
101
solid residues on the electrode after charge. 102
Benchmarking the Na-O2 micro-battery setup
103
Figure 1 shows a schematic of the micro-battery based on the electrochemical TEM cell 104
configuration (a-d) used throughout this work for the operando imaging of sub-micrometric 105
features during redox reactions at the positive carbon electrode (e). The operando cell was 106
assembled using an oxygen-saturated electrolyte made of 0.5M NaPF6 dissolved into
107
monoglyme (DME), which contains < 20 ppm of water as determined by Karl-Fischer 108
titration. To establish its electrochemical performance, the operando cell was charged and 109
discharged in a cyclic-voltammetry mode, using a sweep rate of 10 mV/s between and Pt as 110
counter and pseudo-reference electrodes (Supplementary Figure S1). Such conditions were 111
used due to the extremely small size of the cell setup, restricting the volume of the electrolyte 112
as well as the available amount of dissolved O2. We first verified that these conditions provide
113
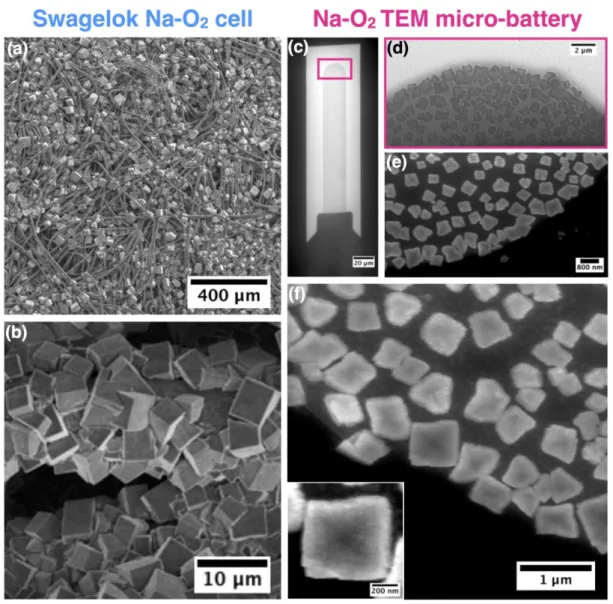
similar results as classical Swagelok cells, with namely the formation of discharge products 114
consisting of plentiful cubes (Figure 2a and 2b), which were identified as NaO2 by combining
115
energy dispersive X-ray spectroscopy (EDX) and selected area electron diffraction (SAED) as 116
discussed later in greater detail. 117
118
119
Figure 1: Schematic description of the Poseidon 510 TEM holder for operando
120
electrochemical measurements: exploded view showing the holder tip with precision slot for 121
loading liquid cell (a), where the top e-chip containing a printed reference (platinum), counter 122
(platinum) and working electrode (glassy carbon) (b, c) is mounted on top of the bottom e-123
chip containing an electron beam transparent Si3N4 membrane, O-rings gasket is used to get a
124
good vacuum-sealing. Cross-sectional illustration of the operando electrochemical TEM cell 125
with the pathway of the electron beam and thin conductive glassy carbon electrode (d). 126
Schematic of the electrochemically induced discharge and charge processes, taking place at 127
the positive electrode surface (e). 128
129
Equally, the inhomogeneous dispersion in size and morphology for the cubes obtained on the 130
glassy carbon electrode (GC) in the operando cell (loaded with liquid electrolyte) Figure 2d - 131
f, compares well with NaO2 cubes found in Swagelok-cells on carbon fibers (Figure 2a and
132
2f).33, 34 Nevertheless, smaller NaO2 cubes are formed with the operando TEM cell (0.5 - 1
133
µm) that is explained by the geometry of the cell, i.e. the reduced distance between the two 134
Si3N4 windows, which limits the amount of electrolyte and thus O2, as well as the short
135
discharge period during CV. 136
137
Figure 2: Comparison of Na-O2 morphology obtained in regular Na-O2 Swagelok cells on
138
carbon fibers (Freudenberg gas diffusion layer electrodes) (a-b) and the GC electrodes used in 139
the Na-O2 TEM micro-battery setup (c-f), (images a-d, taken after removal of the electrolyte).
140
The SEM overview image of the carbon fibers shows the dense coverage by NaO2 discharge
141
product (a) and the high magnification SEM image depicts the micrometer-sized cubic 142
morphology found in Swagelok cells (b). Low magnification TEM image of the GC working 143
electrode used in the in situ Na-O2 micro-battery cell (c). TEM and HAADF-STEM overview
144
images in presence of liquid electrolyte showing, similar to Swagelok cells, NaO2 cubes
covering the GC electrode after discharge (anodic CV scan, 10 mV/s) (d, e). The enlarged 146
HAADF-STEM images illustrate the inhomogeneous NaO2 cubes morphology (f and insert);
147
where the thick layer of liquid electrolyte about 1 µm between the electrode surface and the 148
bottom silicon nitride window impacts the image quality even in HAADF-STEM mode. 149
150
Visualizing the growth process of NaO2 during discharge
151
The growth of NaO2 cubes during discharge was followed by means of fast TEM imagining
152
and high angle annular dark field STEM (HAADF-STEM) using the same cycling conditions 153
as previously mentioned (Figure 3, sequence a and e, Supplementary Video S1). Comparing 154
the electrochemical response in Figure 3 c with the image sequence in Figure 3 a shows that 155
the cube growth follows a solution-precipitation mechanism. Indeed, after an initial step 156
where the electrolyte is saturated by the electrochemically produced NaO2 soluble species
157
(image at 5 s, cathodic current in CV of Figure S1), a point of super saturation is then reached 158
as characterized by the formation of small NaO2 nuclei on the electrode surface (image at 10
159
s). This initial incubation period, where cathodic current corresponding to the electrochemical 160
formation of soluble NaO2 is measured but no product is formed on the electrode, is
161
characteristic of a crystal growth following a solution-precipitation mechanism and therefore 162
rules out a surface-directed growth of NaO2 cubes, for which NaO2 would grow as a solid
163
following the cathodic current. Such nuclei subsequently grow in an isotropic manner (images 164
at 15 - 60 s), by deposition of solvated NaO2 on the surface of cubes. This growth ultimately
165
leads to the formation of NaO2 cubes with a size of approx. 500 nm (image at 60 s). Hence,
166
three stages for the solution-mediated cube-growth precipitation process, similar to the first 167
description given by Janek and coworkers,15 could be spotted. First, soluble NaO2 is
168
electrochemically formed and quickly saturate the electrolyte (owing from the low solubility 169
of NaO2 in organic solvents)15, 34. Once supersaturation of the electrolyte is reached, small
170
aggregates of solvated (NaO2)n species precipitate in the form of small NaO2 nuclei on the
171
carbon electrode. Finally, upon discharge, soluble NaO2 species are consistently produced and
172
deposit on the high surface energy nuclei, which ultimately grow into larger NaO2 cubes. We
173
would like to emphasize here is that the electrode surface in Figure 3 sequence a and e, is hard 174
to visualize owing to the thick layer of electrolyte between the electrode and the Si3N4
175
window. Hence, to facilitate its identification, a thin white line is used, as a guide to the 176
reader, to indicate the electrode border in TEM image in Figure 3 b. 177
178
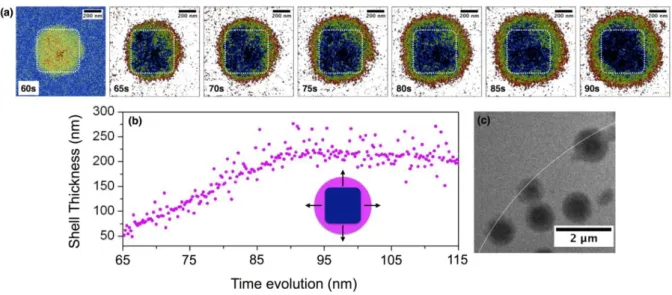
Further exploiting the capability of the TEM setup, we visualize the sequential size evolution 179
of several cubes (Figure 3 b, supplementary Video S2). As NaO2 is an insulator15, 16 and
180
cannot grow by electrodeposition, it is evident that the gradual growth occurs by deposition of 181
NaO2 from the solution at the outer crystal surface. For better quantification, the particle size
182
evolution during discharge as a function of the growth time was plotted, which revealed the 183
non-linear intermittent growth rate (Figure 3 c). Initially, the electrolyte is being saturated 184
with electrochemically generated NaO2 and no significant deposit can be observed. Once the
185
saturation limit is reached, a rapid increase of the cube size is observed, which could be 186
associated with the large concentration of NaO2(solv) in solution at the point of super
187
saturation. This initial burst is then followed by step-wise regime associated with domains of 188
low and high growth rates, dependent on the local concentration of NaO2 in solution. Lastly, a
189
steady-state regime is reached towards the end of discharge where the growth rate diminishes 190
due to depletion of O2 in the electrolyte, causing the limited current density as recorded by
191
CV (Figure 3 c). By analyzing several cubes, we could demonstrate that the overall 192
mechanism is similar for every cube, verifying the ubiquitous nature of this process with, 193
however, different intermittent growth rates for each cube, thus further pointing out the 194
important role played by the mass transport, owing to the different local environment (i.e. the 195
density of neighboring cubes) (Figure 3 c). To the best of our knowledge, this is the first 196
acquisition of such insights regarding the solution-mediated growth of NaO2. These results,
197
combined with the previously demonstrated solubility of NaO215, 34 unambiguously establish
198
that the insulating NaO2 phase15, 16 formed during discharge of a Na-O2 battery is the
199
consequence of a solution-mediated precipitation process. 200
201
202
Figure 3: The time-resolved and animated operando TEM images illustrate the
203
morphological evolution of the NaO2 product during discharge (a and e), featuring a
204
nucleation event (10 s) and the subsequent growth of NaO2 cubes, following a
solution-205
mediated growth-process (11-60 s). TEM image extracted from the growth study of several 206
cubes (pink, blue, green, red and black circles in b) forming during discharge. The size-207
evolution analysis of these cubes reveals a non-linear growth with intermittent plateaus 208
the anodic current response obtained during discharge. Enlarged TEM image of a cube 210
obtained at the end of discharge, surrounded by parasitic shell. (d) High-resolution TEM 211
image of NaO2 cube, obtained on the GC electrode at the end of discharge.
212 213
Formation of parasitic shell
214
Quite interestingly, the use of operando TEM also enables identification of a shell 215
surrounding the NaO2 cubes, which becomes predominant towards the end of discharge (>
216
60s) (Figure 4 a, image 65 s – 85s, green and orange pixels). We further exploited the 217
capabilities of operando TEM by visualizing the evolution of this shell surrounding the cubic 218
NaO2 crystal (Supplementary Video S3), shell which is initially appears as a thin film prior to
219
develop into a thick spherical shell (approx. 200 nm) around the cube. Hence, several 220
questions arise from this observation: what is the nature of this shell and what is its 221
consequence for the performance of the Na-O2 battery?
222
223
Figure 4: The fast and animated operando TEM images showing the evolution of the
224
parasitic shell at the cube-electrolyte interface, illustrated by the orange/green pixels (a). Shell 225
thickness evolution, extracted from the numerical treatment of image stack after contrast 226
filtering, indicated in pink, insert (b). TEM image of finally obtained NaO2 cubes (strong
contrast), surrounded by the parasitic shell (light contrast) (c). Note that cubes are growing on 228
the surface of the glassy carbon electrode, the extremity of which is represented by the white 229
line. 230
231
Analyzing the discharge products
232
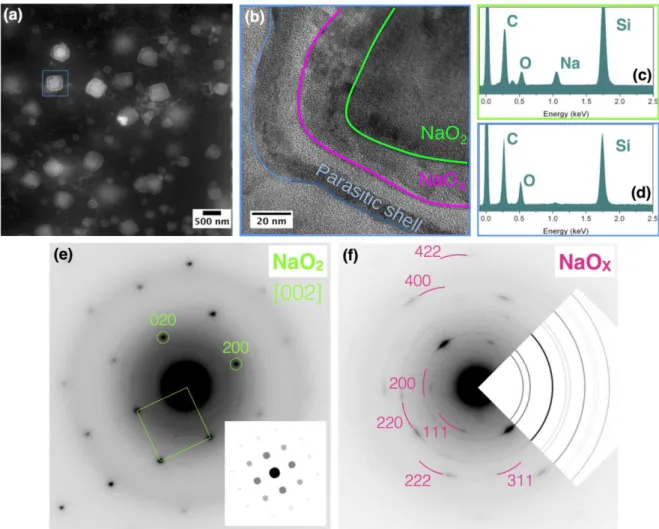
By moving to ex situ TEM, EDX and SAED analysis, we could provide further insights in 233
both the chemical composition and the morphology of this shell (Figure 5). Note that this 234
shell, which is separated from crystalline NaO2 cube by a darker line (in the HAADF-STEM
235
mode), can be found on the surface of every cube (Figure 5 a). Furthermore, the use of TEM 236
reveals the presence of three different morphologies and chemical compositions from the bulk 237
to the surface of a cube (Figure 5 b). First, the bulk crystal (green/blue area) was identified to 238
have the composition of Na:O2 by means ofEDX and to crystallize in the fluorite structure of
239
NaO2 (S.G. Fm-3m) as deduced by SAED (Figure 5 c, e). Moving towards the surface, TEM
240
reveals a first shell growing on the bulk NaO2 crystal (pink area), which consists of an
241
agglomeration of nano-cubes with crystallite size of about 20 nm. The SAED pattern of the 242
nano-cubes (Figure 5 f) shows rings of modulated intensity confirming the visual observation 243
of numerous randomly oriented crystallites, having a cubic unit cell parameter close to that 244
measured for the SAED pattern of NaO2. Although the absolute values for the lattice
245
parameters cannot be precisely measured from SAED patterns, their ratio can be estimated 246
with much higher precision. This estimate gives the anano-cubes/aNaO2 1.015 value. Both, the
247
fluorite-type NaO2 and antifluorite-type Na2O both possess the face-centered cubic unit cell
248
with the cell parameter ratio aNa2O/aNaO2 = 5.56Å/5.512Å = 1.009 that is reminiscent to the
249
experimentally measured ratio. Thus, one can tentatively identify the nano-cubes as defective 250
NaO2, with an increased Na:O atomic ratio (note that Na2O2 would adopt an hexagonal
symmetry while Na2O2.2H2O would adopt a monoclinic symmetry). These high surface area
252
cubes may further favor the chemical reactivity towards electrolyte decomposition as seen by 253
the formation of the third shell, an amorphous layer at the outer surface, i.e. at the interface 254
between the cubes and the electrolyte, with reduced Na content as deduced by the small 255
sodium peak observed by EDX analysis (Figure 5 d, blue line). To shine further light on this 256
amorphous outer layer, GDL electrodes were discharged using classical Swagelok cells. The 257
electrodes, which contain large amounts of discharge product, were then analyzed in greater 258
details. 259
260
Figure 5: Ex situ analysis (dry condition) of the discharge product. HAADF-STEM overview
261
image of the widely distributed cubes on the GC electrode, surrounded by the parasitic shell 262 b NaO2 NaOX Par asitic sh ell
(a). TEM image illustrating the interior of the shell around the NaO2 cubes; bulk crystalline
263
NaO2 (green), NaOx nanocrystalites (pink) and the outer organic layer (blue) (b). EDX spectra
264
of the NaO2 bulk (c) and the organic layer (d). SAED patterns showing the high crystallinity
265
of inner NaO2 bulk (e) and poly-dispersed NaOx nanocrystallites for the second layer (f).
266 267
First, HAADF-STEM analysis of discharged GDL electrodes revealed the presence of a shell 268
for NaO2 cubes grown in classical Swagelok cells, similarly to what was observed using the in
269
situ TEM setup (Supplementary Figure S6). This validates the observations made by the 270
operando-cell and further exclude beam damage as the sole origin for the formation of this 271
shell. 272
To gain deeper understanding about this shell, XPS spectra of discharged GDL electrodes 273
were collected at various stages of discharge (Supplementary Figure S2). The C1s spectra 274
reveal the constant evolution of a parasitic carbonate-like species during discharge. To 275
quantify the amount of these carbonates generated upon discharge, we relied on the method 276
first described by Thotiyl et al.35 that consist in the use of acid (H3PO4) and Fentons`s reagent
277
are used to decompose inorganic and organic carbonates, with the CO2 generated through
278
their decomposition being subsequently sampled by a mass spectrometer. 279
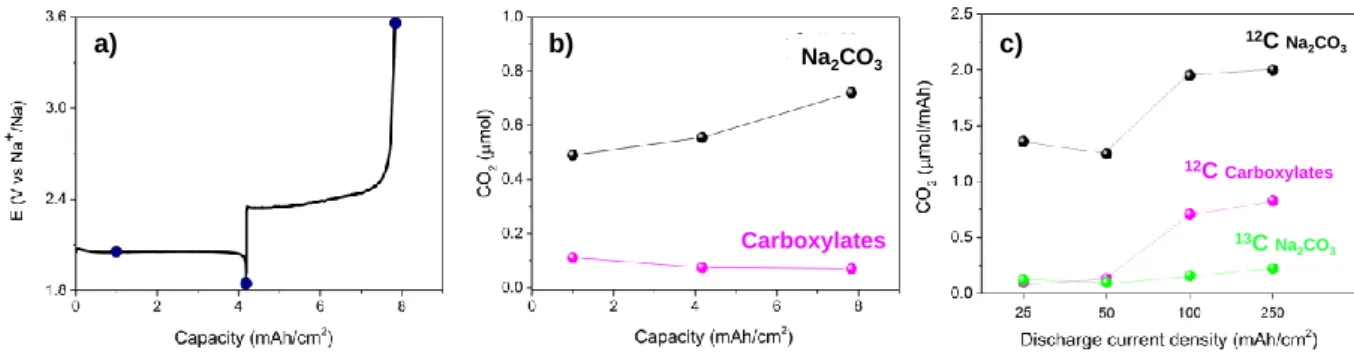
The released CO2 concentration at various stages of discharge (Figure 6) indirectly,
280
demonstrates the significant amount of inorganic Na2CO3 and organic carboxylates formed on
281
the surface of carbon electrodes. Upon discharge, the concentration of inorganic carbonates 282
significantly increases (Figure 6 b), and this is in agreement with the growth of the shell 283
observed in Figure 4a. Moreover, when comparing the concentration of Na2CO3 at the end of
284
discharge with the results obtained at the end of charge, a limited increase is found for GDL 285
electrodes, demonstrating that the parasitic products cannot be reoxidized and remain on the 286
electrode surface at the end of charge (Figure 6b). This result highlights the importance of 287
mastering this interface for decreasing the rate of parasitic product formation. 288
289
290
Figure 6: Discharge−charge profiles for GDL electrode at a rate of 25 A/cm2 (a). Amount 291
of CO2 evolved from the GDL electrode when removed from the cells at different states of 292
discharge and charge and treated with acid and Fenton’s reagent to decompose Na2CO3 and 293
organic carboxylates (b). CO2 evolution originating from the instability of electrode and
294
electrolyte as deduced from the discharge of 13C-carbon electrodes at various discharge rates 295
between 25 – 250 uA/cm2 (c). 12CO2 evolution indicatesthe electrolyte degradation leading to
296
inorganic carbonates (black) and organic carboxylates (red) whereas 13CO2 detection results
297
from the direct decomposition of the carbon electrodes. 298
299
Finally, to clarify the origin of the carbonate side product formation, which can result from 300
the electrolyte and/or from the electrode decomposition, discharge experiments using 13 C-301
labeled electrodes with the released CO2 isotopes being detected by mass Spectrometry
302
analysis. These isotopic experiments revealed the presence of both 13CO2 and 12CO2 at the end
303
of discharge, which can only be explained by the decomposition of both the electrode surface 304
and the electrolyte, respectively (Figure 6c). However, the observed 12C fraction was much 305
larger than the 13C one, demonstrating that the majority of parasitic carbonates originates from 306 a) b) c) Na2CO3 Carboxylates 12C Carboxylates 12C Na 2CO3 13C Na2CO3
the instability of the glyme-electrolyte in contact with the highly oxidizing NaO2 discharge
307
product. Again, this result corroborates the shell formation we observed in Figure 4. 308
Additionally, we observed that upon elevated discharge currents, the amount of products 309
originating from the decomposition reactions increases, with a prominent contribution from 310
the electrode decomposition (Figure 6c), hence implying that an electrochemically-driven-311
electrode decomposition is also at play during discharge of Na-O2 batteries.
312
Altogether, these experiments reveal the high reactivity of NaO2 and further disproves,
313
together with previous literature reports, 8, 23-25 the initial claim of improved stability for Na-314
O2 batteries when compared to Li-O2 ones.5
315 316
Overall, the combination of the time-resolved TEM as well as ex situ observations reveal that 317
parasitic reactions in glyme-ether based Na-O2 batteries constantly occur during discharge,
318
demonstrating the strong reactivity of NaO2 towards the electrolyte and potentially residual
319
impurities such as e.g.: H2O or CO2 18, 20, 21 or even the generation of singlet O2 species, as
320
recently reported for Li-O2 and Na-O2 batteries.36-38 At this stage, it is worth noting that the
321
carbonates are certainly not the only one kind of parasitic products formed when cycling Na-322
O2 batteries. Indeed, several very recent reports demonstrated the high reactivity of NaO2
323
towards the electrode, as well as towards the solvent,8, 23, 24 where sodium carbonate and 324
carboxylate were identified to be the main parasitic products, with a variety of other side 325
products, such as formats and acetates also being found. 326
327
Overall, we believe that preventing the formation of this complex organic/inorganic shell will 328
be of prime importance to mitigate the drastic capacity loss observed upon cycling with 329
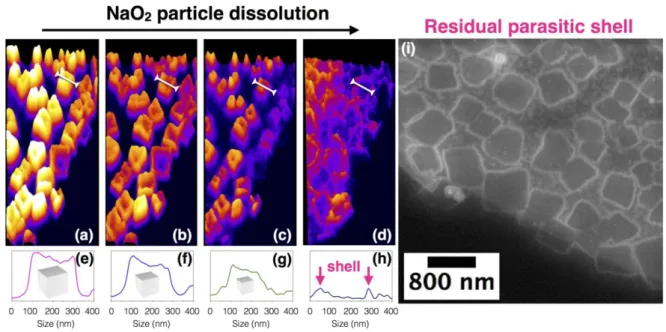
Resolving the mechanism in charge – the dissolution of NaO2
331
Encouraged by the mechanistic insight provided by operando TEM during the discharge of 332
Na-O2 battery, we decided to explore the oxidation process following the same methodology.
333
From a sequence of images collected by HAADF-STEM (Supplementary Video S4), the 334
gradual dissolution of NaO2 cubes during oxidation can be observed (Figure 7). More
335
importantly, this visualization shows that cubes dissolve concentrically from the outside 336
inwards. In detail, the 3D visualization of the processes at play during charge illustrate that 337
the dissolution of the cubes initially proceeds from the top surface, i.e. at the interface 338
between the cube and the electrolyte, leading to a steady decrease in size of the cube (Figure 7 339
a-d). This is in contrast to the previously reported electrode directed charge-transfer, i.e. the 340
direct oxidation of the cubes at the interface with the electrode.12 To gain deeper insight into
341
this dissolution process, the height-profile evolution was followed for one cube throughout 342
the complete oxidation (Figure 7 e-h). From this profile, it can be observed that cubes, despite 343
being covered by the parasitic shell, start to dissolve from the top, i.e. the face exposed to the 344
electrolyte, hence demonstrating the porous nature of the organic shell. Upon further 345
charging, the overall height profile continuously decreases from the top of the cube, further 346
suggesting a collapse of the parasitic shell during charge. Ultimately, parts of the shell remain 347
at the end of charge spread on the surface of the electrode, visualized in Figure 7 i as a 348
patchwork and by the “walls” at 50 and 300 nm in the linear profile in Figure 7 h. This is in 349
good agreement with our ex situ observations where parasitic residues (organic and inorganic) 350
are found on the GDL carbon fibers after charge (Figure 6), as well as with previous reports.8 351
Altogether, these new information shine light on a so-far poorly explained phenomenon, 352
namely the constant columbic losses measured upon cycling. Subsequent cycling will indeed 353
generate additional parasitic products that will accumulate at the electrode surface, ultimately 354
causing a rapid capacity loss and a drastic self-discharge. 355
356
In light of the solvation-desolvation equilibrium discussed above, our operando electron 357
microscopy measurements provide the definitive demonstration that the oxidation process in 358
Na-O2 batteries follows a solution-mediated mechanism, as previously proposed15 based on
359
the significant solubility of NaO2,15, 34 its low dissolution energy10, 13 as well as its insulating
360
nature that would prohibit direct oxidation at the electrode.15, 16 During charge, solvated 361
NaO2(solv) is oxidized at the electrode surface into Na+ and O2(g), hence displacing the
362
equilibrium NaO2(solid) = NaO2(solv) to the right and forcing the dissolution of the cubes.
363
Through this process, the bottom edges of the non-conducting cubes, in direct contact with the 364
electrode surface, remain throughout the charge as evidenced by TEM. This clearly contrasts 365
with the previously proposed mechanism for which a direct charge transfer between the solid 366
and the electrode/current collector was a requirement.12 367
368
Finally, we explored the consequences of the formation of parasitic products at the electrode 369
surface on subsequent cycles and NaO2 formation. This revealed that NaO2 nuclei were
370
exclusively formed during the second discharge on the uncovered, pristine electrode surface 371
(Supplementary Video S5). Hence, the parasitic products not only hamper the O2(g) redox
372
reaction but also hinder NaO2 nucleation on the carbon surface. In short, this study shows that
373
the formation of parasitic products has its origin in the high chemical reactivity of the NaO2
374
cube surface, initially suspected to be less reactive than Li2O2.5 This highlights the need for a
375
new class of electrolytes that are stable against attack from NaO2.
377
378
Figure 7: HAADF-STEM imaging of the charge process. Animated images at different depth
379
of charge depict the dissolution of the cubes via solution, starting at cube-electrolyte interface 380
and proceeding downwards to the electrode surface (a-d). High profile evolution of a single 381
cube during charge (specified by white bar in a-d) (e-h) further supporting the solution-382
mediated charge, where the two bumps at 50 and 300 nm in image h indicate the parasitic 383
shell remaining on the electrode surface at the end of the charge. HAADF-STEM image of the 384
GC electrode surface after discharge showing the patchwork of the residual parasitic shells, 385
blocking subsequent O2 redox and NaO2 nucleation (i).
386 387
Conclusion
388
Herein we have reported that fast imagining TEM and HAADF-STEM are powerful 389
analytical tools to understand the mechanistic pertaining to the charge/discharge processes in 390
DME based Na-O2 batteries. We visualized the solution-mediated growth of NaO2 in
real-391
time and identified that the 3D growth process is governed by the equilibrium between 392
NaO2(solv) <--> NaO2(solid) and the mass transport of soluble product. By imaging the charge
process, we provide conclusive evidence that the same solvation-desolvation equilibrium is 394
responsible for the dissolution of the NaO2 discharge product, which consumes the NaO2
395
cubes from the NaO2-electrolyte interface towards the electrode and not from the
cube-396
electrode interface. Therefore, we rule out the direct charge-transfer reaction as the major 397
oxidation path for NaO2 cubes and clarify the mechanism of this widely discussed reaction.
398
Finally, we provide fundamental insights into the parasitic reactions occurring during cycling 399
of a Na-O2 battery where time-resolved visualization revealed the chemical reactivity of NaO2
400
at the interface with the electrolyte. As a result, parasitic products continuously accumulate on 401
the cube surface to form a thick shell surrounding the NaO2 cubes, which passivates the
402
electrode surface as it cannot be reoxidized. This information is vital for optimization of the 403
battery, since this parasitic shell is responsible for the low efficiency during charge, as well as 404
for its poor cyclability by preventing crucial O2 redox and further nucleation of NaO2. It must
405
therefore be recognized that the NaO2 growth is solvent dependent, providing the possibility
406
of mediating the deposition process by controlling the solvation/desolvation event. Hence, 407
caution must be exercised prior to generalizing this finding. Through this first visualization of 408
the redox processes governing the Na-O2 system, we further confirm the importance of
409
finding how the various components of the batteries locally interact with each other. We hope 410
these results will help in the development of new strategies to optimize cell components, such 411
as the electrolyte, in order to achieve high performing Na-O2 batteries, and also serve to
412
motivate the development of operando electrochemical TEM cells. 413 414 Methods 415 Electrolyte preparation: 416
1,2-Dimethoxyethane (DME, 99.9%) was purchased from Sigma Aldrich and (NaPF6 99.9 %)
to remove excess water and Sodium salts were dried under vacuum at 80°C for 24 hours. The 419
0.5 M electrolyte solutions were prepared in an argon-filled glove box (0.1 ppm O2/0.1 ppm
420
H2O). The water content of the electrolyte solutions was analyzed by Karl Fischer titration
421
and was found to be below 20 ppm. The electrolyte was saturated with ultrapure O2, prior to
422
use in the in situ TEM cell. 423
424
Operando electrochemical (S)TEM experiments:
425
Operando TEM experiments were performed using a FEI-TECNAI G2 (S)TEM equipped
426
with a Schottky field-emission gun and an fast camera Oneview-Gatan (30 fps at 4k). For 427
these experiments the microscope was operated at 200 kV in both conventional TEM and 428
HAADF-STEM modes. In this study, we checked the effect of the electron beam used to 429
make the observations in TEM and STEM modes to be sure that the beam does not have any 430
effect on our results. During the observations, the dose was kept below 10 e-/nm2s in order to 431
limit beam damage effects. By this way, typical beam effects (bubble and precipitate 432
formations) due to the degradation of the electrolyte by radiolysis effect are avoided. As 433
shown in Supplementary Figure S3, the insignificant impact of the electron beam on the 434
liquid electrolyte was verified with the same dose of electron used during the fast imaging 435
acquisition, which shows a high stability of NaPF6/DME/O2 electrolyte upon electron beam
436
irradiation for a relatively long period of time: 360s. The TEM holder used is a Protochips 437
Poseidon 510 owing both a microfluidic flow system and an electrochemical measurement 438
system with 3 electrodes. The micro-battery cell itself is localized in the holder tip and 439
consists of two silicon Echips sealed by Viton O-ring gasket: a top Echip (with 2 Pt electrodes 440
(reference and counter) and 1 glassy carbon electrodes (working), a 500 nm SU-8 polymer 441
spacer and a 50 nm thick Si3N4 window) and bottom Echip (with a 500 nm spacer and a 50
442
nm thick Si3N4 window). Mounted Echips are then compressed onto O-rings using screwed
443
lid of the holder inducing a good vacuum-sealing. The microfluidic system integrated in the 444
TEM holder allows to introduce and flow the electrolyte with a rate range from 0.5 to 5 445
µL/min. using a syringe pump system. The microfluidic system (cell and microtubes) is 446
flushed by argon gas to discard oxygen presence prior to start operando experiment. 447
448
Cyclic voltammetry
CV experiments were conducted using an ultra low current SP-200 Biologic potentiostat, 450
where during battery cycling, the potential was scanned at a rate of 10 mV/s between -1.6V 451
and -3 V using Pt as pseudo-reference electrode and Pt as counter electrode. For sake of 452
clarity, all values were then rescaled versus Na+/Na to yield a potential window of 1.5 and 453
2.9V (vs. Na+/Na). 454
455
X-ray photoelectron spectroscopy (XPS) analysis:
456
XPS analysis of the surface of aged sodium samples was performed by a means of SPECS 457
Sage HR 100 spectrometer with a non-monochromatic X-ray source (Aluminum Kα line of 458
1486.6 eV energy and 300 W). The samples were placed perpendicular to the analyzer axis 459
and calibrated using the 3d5/2 line of Ag with a full width at half maximum (FWHM) of
460
1.1 eV. All samples were transferred by means of a gastight transfer chamber to avoid air 461
contact. All samples were further rinsed with dry DME solution to remove excess salt. In the 462
case of sodium aged in TFSi electrolyte, the surface of the sample and not the precipitate was 463
analyzed. 464
The selected resolution for the spectra was 10 eV of Pass Energy and 0.15 eV/step. All 465
Measurements were made in an ultra-high vacuum (UHV) chamber at a pressure around 466
5·10-8 mbar. An electron flood gun was used to compensate for charging during XPS data 467
acquisition. In the fittings asymmetric and Gaussian-Lorentzian functions were used (after a 468
Shirley background correction) where the FWHM of all the peaks were constrained while the 469
peak positions and areas were set free. For every anion, XPS was performed on the surface of 470
the metallic sodium. For TFSI, the XPS spectrum was collected as well on the surface of the 471
metallic sodium, while the pilled off part wasn’t analyzed. 472
473
Mass Spectrometry analysis:
474
The collected electrodes were first immersed in an aqueous solution containing 2M H3PO4,
475
which decomposes Na2CO3 into CO2. Due to the very acidic pH-value, the 2H+ + CO32-
476
HCO- + H+ CO2 + H2O equilibrium is fully shifted to the right, where CO2 evolves as
477
gaseous CO2, which is subsequently sampled by mass spectrometry. In a second step, after the
478
CO2 evolution has ended and all inorganic Na2CO3 was quantify, a second injection with 0.5
reagent) was added. The presence of the highly reactive OH radical (based on the Fenton`s 481
reaction: Fe2+ + H2O2 Fe3+ + OH + OH-) leads to the decomposition of organic species
482
(e.g.: sodium carboxylates) into CO2, again released as gas due to the acidic environment.
483 484
Author contributions
485
A.G., A.D. and J.-M.T. designed the experiments. L.L., W.D., A.D. and A.G. performed the 486
operando TEM measurements. W.D. and A.D. performed the TEM analysis. L.L., A.G., A.D. 487
and J.-M.T. wrote the manuscript that all the authors edited. 488
Supporting Information Available:
489
Supplementary videos of in situ (S)TEM experiments, Cyclovoltammogram, XPS analysis, 490
beam damage control experiments, EELS spectra, STEM-HAADF image, HAADF-STEM 491
and EDX-STEM images of NaO2 cubes grown on GDL electrodes.
492
Competing interests
493
The authors declare no competing financial interest. 494
Acknowledgements
495
L.Lutz thanks the ALISTORE-ERI for his Ph.D. grant. We would like to thank Dr. Artem 496
Abakumov for fruitful discussions and comments on the manuscript. 497
498
References
499
1. Gallagher, K. G.; Goebel, S.; Greszler, T.; Mathias, M.; Oelerich, W.; Eroglu, D.; 500
Srinivasan, V. Energy & Environmental Science 2014, 7, 1555-1563. 501
2. Bruce, P. G.; Freunberger, S. A.; Hardwick, L. J.; Tarascon, J. M. Nature Materials 502
2012, 11, 19–29.
503
3. Abraham, K. M.; Jiang, Z. J. Electrochem. Soc. 1996, 143, 1-5. 504
4. Lepoivre, F.; Grimaud, A.; Larcher, D.; Tarascon, J.-M. J. Electrochem. Soc. 2016, 505
163, A923-A929. 506
5. McCloskey, B. D.; Garcia, J. M.; Luntz, A. C. J. Phys. Chem. Lett. 2014, 5, 1230-507
1235. 508
6. Ottakam Thotiyl, M. M.; Freunberger, S. A.; Peng, Z.; Chen, Y.; Liu, Z.; Bruce, P. G. 509
Nat Mater 2013, 12, 1050-1056.
510
7. Adelhelm, P.; Hartmann, P.; Bender, C. L.; Busche, M.; Eufinger, C.; Janek, J. 511
Beilstein J. Nanotechnol. 2015, 6, 1016-1055.
512
8. Liu, T.; Kim, G.; Casford, M. T. L.; Grey, C. P. J. Phys. Chem. Lett. 2016, 7, 513
4841−4846. 514
9. Bender, C. L.; Hartmann, P.; Vracar, M.; Adelhelm, P.; Janek, J. Adv. Energy Mater. 515
2014, 4, 1301863.
516
10. Kim, J.; Park, H.; Lee, B.; Seong, W. M.; Lim, H. D.; Bae, Y.; Kim, H.; Kim, W. K.; 517
Ryu, K. H.; Kang, K. Nat. Commun. 2016, 7, 10670-10679. 518
11. Knudsen, K. B.; Nichols, J. E.; Vegge, T.; Luntz, A. C.; McCloskey, B. D.; Hjelm, J. 519
J. Phys. Chem. C. 2016, 120, 10799–10805.
520
12. Morasch, R.; Kwabi, D. G.; Tulodziecki, M.; Risch, M.; Zhang, S.; Shao-Horn, Y. 521
ACS Appl. Mater. Interfaces 2017, 9, 4374-4381.
522
13. Lee, B.; Kim, J.; Yoon, G.; Lim, H.-D.; Choi, I.-S.; Kang, K. Chem. Mater 2015, 27, 523
8406-8413. 524
14. Hartmann, P.; Bender, C. L.; Sann, J.; Duerr, A. K.; Jansen, M.; Janek, J.; Adelhelm, 525
P. Phys. Chem. Chem. Phys. 2013, 15, 11661-11672. 526
15. Hartmann, P.; Heinemann, M.; Bender, C. L.; Graf, K.; Baumann, R.-P.; Adelhelm, P.; 527
Heiliger, C.; Janek, J. J. Phys. Chem. C. 2015, 119, 22778-22786. 528
16. Yang, S.; Siegel, D. J. Chem. Mater 2015, 27, 3852-3860. 529
17. Xia, C.; Black, R.; Fernandes, R.; Adams, B.; Nazar, L. F. Nat. Chem 2015, 7, 496-530
501. 531
18. Pinedo, R.; Weber, D. A.; Bergner, B.; Schröder, D.; Adelhelm, P.; Janek, J. J. Phys. 532
Chem. C. 2016, 120, 8472-8481.
533
19. Ortiz-Vitoriano, N.; Batcho, T. P.; Kwabi, D. G.; Han, B.; Pour, N.; Yao, K. P.; 534
Thompson, C. V.; Shao-Horn, Y. J. Phys. Chem. Lett. 2015, 6, 2636-2643. 535
20. Das, S. K.; Xu, S.; Archer, L. A. Electrochem. Commun. 2013, 27, 59-62. 536
21. Roberts, J. L. J.; Calderwood, T. S.; Sawyer, D. T. J. Am. Chem. Soc. 1984, 106, 4667-537
4670. 538
22. Sayed, S. Y.; Yao, K. P.; Kwabi, D. G.; Batcho, T. P.; Amanchukwu, C. V.; Feng, S.; 539
Thompson, C. V.; Shao-Horn, Y. Chem Commun (Camb) 2016, 52, 9691-9694. 540
23. Black, R.; Shyamsunder, A.; Adeli, P.; Kundu, D.; Murphy, G. K.; F., N. L. 541
ChemSusChem 2016, 9, 1795 - 1803.
542
24. Landa-Medrano, I.; Pinedo, R.; Bi, X.; Ruiz de Larramendi, I.; Lezama, L.; Janek, J.; 543
Amine, K.; Lu, J.; Rojo, T. ACS Appl Mater. Interfaces 2016, 8, 20120–20127. 544
25. Reeve, Z. E.; Franko, C. J.; Harris, K. J.; Yadegari, H.; Sun, X.; Goward, G. R. J. Am. 545
Chem. Soc. 2017, 139, 595-598.
546
26. Liang, Z.; Zou, Q.; Wang, Y.; Lu, Y.-C. Small Methods 2017, 1, 1700150. 547
27. Ross, F. M. Science 2015, 350, aaa9886–aaa9886. 548
28. Dachraoui, W.; Kurkulina, O.; Hadermann, J.; Demortière, A. Microsc. Microanal. 549
2016, 22, 24-25.
550
29. Holtz, M. E.; Yu, Y.; Gunceler, D.; Gao, J.; Sundararaman, R.; Schwarz, K. A.; Arias, 551
T. A.; Abruna, H. D.; Muller, D. A. Nano Lett. 2014, 14, 1453-1459. 552
30. Mehdi, B. L.; Qian, J.; Nasybulin, E.; Park, C.; Welch, D. A.; Faller, R.; Mehta, H.; 553
Henderson, W. A.; Xu, W.; Wang, C. M.; Evans, J. E.; Liu, J.; Zhang, J. G.; Mueller, K. T.; 554
Browning, N. D. Nano Lett. 2015, 15, 2168-2173. 555
31. Sacci, R. L.; Black, J. M.; Balke, N.; Dudney, N. J.; More, K. L.; Unocic, R. R. Nano 556
Lett. 2015, 15, 2011-2018.
32. Luo, L.; Liu, B.; Song, S.; Xu, W.; Zhang, J. G.; Wang, C. Nat Nanotechnol. 2017, 12, 558
535-540. 559
33. Hartmann, P.; Bender, C. L.; Vracar, M.; Duerr, A. K.; Garsuch, A.; Janek, J.; 560
Adelhelm, P. Nat. Mater 2013, 12, 228-232. 561
34. Lutz, L.; Yin, W.; Grimaud, A.; Alves Dalla Corte, D.; Tang, M.; Johnson, L.; 562
Azaceta, E.; Sarou-Kanian, V.; Naylor, A. J.; Hamad, S.; Anta, J. A.; Salager, E.; Tena-Zaera, 563
R.; Bruce, P. G.; Tarascon, J. M. J. Phys. Chem. C. 2016, 120, 20068-20076. 564
35. Ottakam Thotiyl, M. M.; Freunberger, S. A.; Peng, Z.; Bruce, P. G. J. Am. Chem. Soc. 565
2013, 135, 494-500.
566
36. Wandt, J.; Jakes, P.; Granwehr, J.; Gasteiger, H. A.; Eichel, R. A. Angew. Chem. 2016, 567
128, 7006-7009. 568
37. Mahne, N.; Schafzahl, B.; Leypold, C.; Leypold, M.; Grumm, S.; Leitgeb, A.; 569
Strohmeier, G. A.; Wilkening, M.; Fontaine, O.; Kramer, D.; Slugovc, C.; Borisov, S. M.; 570
Freunberger, S. A. Nat. Energy 2017, 2, 1-9. 571
38. Schafzahl, L.; Mahne, N.; Schafzahl, B.; Wilkening, M.; Slugovc, C.; Borisov, S. M.; 572
Freunberger, S. A. Angew Chem Int Ed Engl 2017, 56, 15728-15732. 573
574 575 576
FOR TABLE OF CONTENTS ONLY
577