ARE LOCAL LABOUR MARKETS SUFFICIENTLY FLEXIBLE? APPLICATION OF A REGIONAL LABOUR ADJUSTMENT MODEL TO CANADIAN REGIONS
Jean DUBÉ Mario POLÈSE
Inédit / Working paper, no 2012-05
ARE LOCAL LABOUR MARKETS SUFFICIENTLY FLEXIBLE?
APPLICATION OF A REGIONAL LABOUR ADJUSTMENT MODEL TO CANADIAN REGIONS
Jean DUBÉ Mario POLÈSE
Institut national de la recherche scientifique Centre - Urbanisation Culture Société
Montreal
Jean Dubé
Université du Québec à Rimouski (UQAR)
Mario Polèse
Centre – Urbanisation Culture Société, INRS
Centre - Urbanisation Culture Société Institut national de la recherche scientifique 385, Sherbrooke Street East
Montreal (Quebec) H2X 1E3 Phone : (514) 499-4000 Fax : (514) 499-4065
www.ucs.inrs.ca
This document can be downloaded without cost at:
www.ucs.inrs.ca/sites/default/files/centre_ucs/pdf/Inedit05-12.pdf
Abstract
The paper presents a labour market model based on a standard demand and supply framework, applied to 83 Canadian regions over varying time periods between 1987 and 2011 with the objective of evaluating the responsiveness of local labour markets to changing labour demand. The findings suggest that local labour markets in Canada behave ‘efficiently’ on the whole, consistent with the model and with what economic theory predicts. Labour supply adjusts as predicted and in general fairly rapidly to cyclical upswings and downswings in labour demand, although a certain level of rigidity is observable on the longer run. Nonetheless, the great majority of Canadian communities are ‘adjusting’ as expected to mean and long-term changes in labour demand conditions. Those that deviate from the norm are mostly small resource economies. We find no evidence that labour in traditionally lagging comminutes in Atlantic Canada and Quebec are less responsive to demand fluctuations; the overall rate of labour force participation is lower but converging to the Canadian average.
Key Words:
Regional Adjustment, Labour Markets, Spatial Analysis, Regional Economics
Résumé
Ce papier propose un modèle du marché de travail en partant d’un cadre standard d’offre et de demande, appliqué à 83 régions canadiennes sur diverses périodes entre 1987 et 2011, dans le but d’évaluer la sensibilité des marchés régionaux de travail aux chocs conjoncturels. Les résultats suggèrent que les marchés locaux de travail au Canada se comportent, dans l’ensemble, de façon « efficace », telle que préconisée par le modèle et par la théorie économique. L’offre de travail réagit comme prévu et, en règle générale, de façon assez rapide à des mouvements conjoncturels vers le haut ou vers le bas dans la demande de travail; quoiqu’un certain degré de rigidité est observable à plus long-terme. Néanmoins, la grande majorité des communautés canadiennes « s’ajustent » conformément aux attentes à des fluctuations à courte ou moyen terme dans la demande locale de travail. Celles qui s’écartent de la norme sont pour la plupart des petites économies à base de ressources naturelles. Nous ne trouvons aucun indice que les l’offre de travail « s’ajuste » moins bien dans des régions historiquement défavorisées du Québec et du Canada atlantique; les taux de globaux d’activité restent bas, mais convergent vers la moyenne canadienne.
Mots clés :
INTRODUCTION
In the economic geography and regional economics literature, labour mobility is traditionally seen as one the underlying mechanisms explaining the evolution of regional disparities in income and employment. A lively debate exists as to the relationship between labour mobility and regional convergence (MACKAY and DAVIES, 2012; NIEBUHR et al. 2012; KIRDAR and SARACOGLU, 2008; BARRO and SALA-I-MARTIN, 1991, 2004; PUHANI, 2001; DECRESSIN and FATAS, 1995; BLANCHARD and KATZ, 1992). Disparities should in principle, following standard supply and demand reasoning, disappear where labour is perfectly mobile, instantaneously adjusting to changes in demand. This, however, begs the question of the proper meaning and measurement of labour mobility and adjustment. Most studies, including those cited above, focus on migration as the chief channel whereby labour adjusts across regions. This paper proposes a different approach.
In this paper we develop a model for describing regional adjustments in labour demand and supply, implicitly integrating net migration. The model is applied to the study of eighty-three Canadian regions over a twenty-five year period. Our findings suggest that regional labour markets in Canada do not adjust perfectly, which is unsurprising, but also that annual labour supply generally adjusts to annual demand changes as expected and that small regions adjust, on average, more rapidly than large urban centres, which is at variance with the perception conveyed by other Canadian studies (GUILLEMETTE, 2006, 2007; BAYOUMI et al., 2006). The paper is divided into six sections. We begin by revisiting the regional adjustment debate with specific reference to Canada, followed by a discussion of the challenges of properly measuring regional labour market adjustments. A third section introduces the model. The fourth presents the Statistics Canada Labour Force Survey, the data source used to estimate the model. A fifth presents empirical results for different regional geographies and time-frames. A brief conclusion ends the paper.
REVISITING REGIONAL ADJUSTMENT
Beginning with the seminal work by COURCHENE, 1981, 1978; regional adjustment has been a recurrent theme in the Canadian regional development literature (COULOMBE, 2006; DREWES, 1986; POLÈSE, 1981). Courchene essentially set out to explain the persistent regional disparities in per capita income and unemployment rates that plagued Canada since the 1950s. Atlantic Canada and Eastern Quebec systematically registered unemployment rates well above those for Ontario with correspondingly low per capita incomes (COFFEY and POLÈSE, 1987). Courchene’s general line of reasoning founded on standard labour demand and supply mechanics is largely accepted today, certainly by mainstream economists, and difficult to refute.
Briefly summarized, impediments such as overly-generous unemployment insurance and transfer payments cause labour markets to become ‘sticky’. Such measures send the wrong signals to workers in regions where labour demand is falling; they encourage workers to stay put and to continue local job searches when they should instead be moving to another region or existing the labour force (possibly going back to school). By the same token, sticky labour markets mean inflexible wages, keeping wages artificially high in regions with low labour demand, in turn keeping labour demand from rising and labour supply from falling (sufficiently), a vicious circle that makes it all the more difficult for lagging regions to improve their lot. This trap, sometimes called ‘transfer dependency’ with reference to the over-reliance on government transfer payments (COURCHENE, 1978), prevents lagging communities in Atlantic Canada, Eastern Quebec and elsewhere from properly adjusting to changing labour demand conditions.
There is also a parallel school of thought that argues that ‘adjustment’, notably via migration, may exacerbate regional disparities in income and unemployment, given the selective nature of migration, disproportionately concentrated among the more educated (KIRDAR and SARACOGLU, 2008; BARRO and SALA-I-MARTIN, 2004). Looking at Europe, PUHANI, 2001; finds little evidence that labour mobility has contributed to convergence. In a nutshell, following from the pioneering work of LUCAS, 1988; and ROMER, 1994, 1986; on the theory of endogenous development, the law of diminishing returns does not necessarily hold for human capital (POLÈSE, 2009). An inflow of highly educated labour will not necessarily drive down wages because of indirect positive effects on labour productivity via knowledge spillovers, and thus drive up the demand for labour. By the same token, an outflow of educated labour will not necessarily improve the community’s attractiveness, and possibly further drive down the demand for labour (SÜDEKUM, 2005; EPIFANI and GANCIA, 2005). Thus, ‘sticky’ labour markets may contribute to convergence in some cases.
This said, the evidence for interprovincial income convergence in Canada since the 1980s is irrefutable (BALDWIN et al., 2004, COULOMBE, 2000, 2011), suggesting that labour mobility or lack thereof may not be the principal factor driving convergence. The regional adjustment model may be only one explanation among others for interpreting regional development differences in Canada. Recent work on the modeling of regional employment trends in Canada suggest that fundamental geo-structural variables (urban size, distance, accessibility, industry structure…) remain the primary ‘generalizable’ determinants of growth (SHEARMUR and POLÈSE 2007, SHEARMUR et al., 2007, COULOMBE 2006), although much remains unexplained, a reminder of the serendipitous nature of regional development, especially when one descends to the local (sub-provincial) level (APPARICIO et al., 2009).
The debate may be moot in part. On the long run, communities necessarily end up ‘adjusting’. No labour force, no matter how sticky, will stay put eternally in the facing of constantly falling labour demand; although the adjustment may take several years, even decades. In Canada, the findings for interprovincial migration flows are largely consistent with expectations: from lower income / higher unemployment regions to higher income / lower unemployment regions.
MEASURING LABOUR ADJUSTMENT AND FLEXIBILITY
Adjustment, although a well-established concept, is not easy to operationalize. What is adequate or appropriate adjustment? Over what time period; how fast should labour supply react to changes in demand? To our knowledge, there is little in the literature to guide us. No consensus exists on how to evaluate labour flexibility. The unemployment rate is sometimes used as an indicator. The presence in Canada of disparities in unemployment rates is GUILLEMETTE, 2007; argues a sign that labour is insufficiently ‘flexible’: workers (supply) are not responding adequately to changes in demand, either by entering or withdrawing from the labour force or by moving into (or out of) the community. However, the mismatch between labour demand and supply, reflected in unemployment rates, may well reflect ‘rational’ expectations (see next paragraph), specifically during shorter time-frames and business cycles.
BAYOUMI et al., 2006; look at the evolution of labour supply as measured by labour force participation rates and labour demand as measured by employment rates, as well as migration rates. This provides a more complete picture. However, simply focusing on the evolution of each indicator can obscure adjustments that depend on the interplay between them, notably for shorter frames. Thus, observed labour supply may appear ‘sticky’ if invariant over a given time-frame in the face of falling labour demand, a priori ‘inefficient’ (counter-adjustment) behaviour. Yet, this may be entirely ‘efficient’ in a community with a history of rising labour demand where the drop is (correctly) perceived as temporary. If in addition surrounding communities witness even sharper drops in demand, in-migration might occur despite falling local demand. Looking only at the unemployment rate (rising in this case) as a measure of labour market rigidity is unsatisfactory: the gap between labour demand and supply does not tell us how the two interact or why.
Most Canadian studies look at provinces, focusing on migration as the key element in the adjustment process. Given the size of most Canadian provinces, it not entirely surprising that provincial labour markets appear sticky; interprovincial migration rates are predictably low (COULOMBE, 2006). Analyzing the impact of business cycles, BERNARD, 2011; and COULOMBE, 2006; find that short-term migration fluctuations have little effect on long-term patterns. FIDRMUC, 2003; reports similar findings for Europe. Looking at unemployment rates for 73 Canadian economic regions, GUILLEMETTE, 2007; argues that the widening dispersion
in rates between regions during business downturns is a sign of growing inflexibility, largely attributable to Eastern Canadian regions. BAYOUMI et al., 2006) also cite the lower labour mobility of Eastern Canada, notably the Atlantic Provinces and Quebec with specific reference to the language barrier for the latter, with migration the main channel through which labour markets adjust over time. Predictably, insular and older communities, attributes associated with Atlantic Canada, have stickier labour markets.
MONASTIRIOTIS and KAPLANIS, 2012; looking at labour adjustment patterns across UK regions, find that ‘flexibility’, which includes various forms of internal labour market flexibility, can act as a substitute for migration, especially for shorter distance inter-municipal moves. Their study is somewhat of an exception, since most studies, including those cited above, look at changes in aggregate labour demand and supply variables or average unemployment rates. Intra-local, inter-industry, labour adjustments are rarely examined, which necessarily reduces the margin for adjustment in smaller regions, normally driving up variations in aggregate variables, notably migration rates, for smaller places. DECRESSIN and FATAS, 1995; argue that labour adjustments also operate via changes in labour force participation rates, a proxy for aggregate regional labour supply. A completely neutral measure of flexibility or adjustment comparable over all time-frames and all community sizes may not be possible.
THE MODEL
The model is essentially a regional adaptation of the standard labour supply and demand framework. The principal empirical issue is the operationalization of labour supply and demand. Given the data generally available, one can observe levels of supply (points) and levels of demand (points) and the resulting gap between the two (equal to unemployment) for a given moment in time, given wage, and given region. We cannot know a priori how the functions move; we can, however, observe differences between the two points and thus examine their movement over time.
The two base data used are the annual local labour force participation rate (supply) and the employment rate (demand). The labour force participation rate for region i in time t ( ) is equal to the ratio of the labour force ( ) to the population aged fifteen (15) or older ( ) (equation 1); the employment rate for the same region and time period ( ) is equal to the ratio of employed persons ( ) to the population aged fifteen or older (equation 2).
(1)
The two rates, thus calculated, allows us to observe parallel changes in labour supply and demand relative to population change (which includes net migration), in turn enabling us to compare regions irrespective of size. Changing labour market conditions, whether improving or deteriorating, are derived by comparing the relative evolution of the two rates over k given time periods (equations 3 and 4).
(3) (4)
The use of rate variations over time rather than absolute growth or decline, allows to juxtapose an increase in relative employment (demand) and in relative labour market participation (supply) relative to an increase in population aged over 15 years (equations 5 and 6). An increase in the labour force participation rate means that persons entering the labour force have increased more rapidly than the population aged 15 years and over and vice-versa (equation 5). An increase in the employment rate means that total employment has increased more rapidly than the working-age population and, again, vice-versa (equation 6) allowing to compare how regional labour market evolve over time irrespective of population size.
(5) (6)
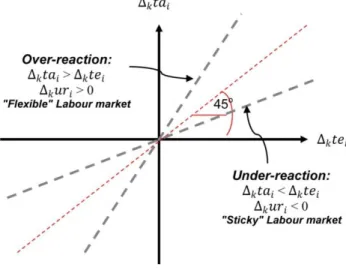
Figure 1 – Schematic Representation: Relative Variations in Labour Supply and Demand- Alternative Local Outcomes
The challenge here is evaluating whether changes in labour supply are less or more than changes in labour demand. To do so, changes in and can be described by means a simple two-dimensional model (Figure 1): the y axis (vertical) measures changes in the labour force participation rate ( - supply) while the x axis (horizontal) measures changes in the
employment rate ( - demand). This visual depiction is somewhat similar to a Moran scatter plot (ANSELIN, 1995, 1996). Relative employment is growing from left to right, positive to the right of the midpoint, declining to the left. Changes in the labour force participation rate move upwards, negative below the midpoint, positive above. The location of a region on the figure gives the net impact of the interaction between the two variables for a given time period k.
The two most probable scenarios are shaded on Figure 1. The first is located in the lower triangle in quadrant 4. This triangle identifies the typical growth scenario in which relative employment ) is growing faster than labour supply ( ). This is where we would expect to find the majority of communities during periods of economic expansion. The second shaded triangle is located in quadrant 2, identifying a recession scenario where both rates are falling, but employment more so. As one should expect, a certain degree of heterogeneity is observable in adjustments over regions. In practice, changes in supply rarely adjust perfectly to changes in demand. Certain outcomes are possible on the short run although unsustainable on the long run. Thus, quadrant 3 falls on the employment growth side, but with falling labour force participation rates, an unsustainable situation on the long run, but entirely possible in the short term. Quadrant 1 falls on the employment decline side, but with rising labour force participation rates, which is also an unlikely outcome in the long run. In a perfectly rigid labour market, the line will be perfectly flat with invariant labour supply no matter how much labour demand changes.
In a perfectly flexible labour market, adjustment is instantaneous with most regions located on the 45o diagonal. Unemployment rates would neither rise nor fall as workers either withdraw from the labour force (stop seeking employment) or emigrate in response to falling labour demand1. The opposite scenario would operate during periods of rising demand with new workers entering the labour force and / or new workers coming into the region. However, adjustment is rarely perfect or simultaneous.
Figure 2 – Schematic Representation: Regional Labour Market Adjustments
It is possible to evaluate the degree of adjustment by looking at the relationship between movements in labor supply ( ) and labour demand ( ) using a simple linear regression framework (equation 7), illustrated schematically on figure 2.
(7)
Thus, in labour markets where adjustment is ‘perfect’, changes in labour supply will be equal to changes in labour demand (β = 1; Slope at 45o
- Figure 2). Labour supply that adjusts less rapidly than demand will be reflected by a lower slope (sticky labour market: β <1), while a labour market characterized by ‘responsive’ supply will be reflected in a steeper slope (flexible labour market β> 1). The α coefficient indicates a shift in the rate of unemployment: α > 0 indicates that regional unemployment rates have risen within the k time period interval, while α < 0 indicates a decline in the regional unemployment rate. Finally, the R2 can be interpreted as a parallel
1 Note that the difference between and is similar to the unemployment rate except that the denominator is
measure of regional adjustment. The R2 measures the goodness of fit which, in the context of the model, denotes the ‘quality’ of the adjustment or, stated differently, the extent to which fully compensates for for a given time interval. Where the regression is applied to variations over time for short intervals (years, months…) for a given region the value of R2
can also be interpreted as an indirect indicator of the speed of adjustment. The model thus assesses local labour markets along three dimensions: 1) rigidity vs. flexibility (β); 2) shifts in regional unemployment rate levels (α); and 3) relative quality (‘fullness’) or speed of adjustment (R2).
The model can be applied to cross sections for given time periods (how different regions react over the same period) or to temporal variations for individual spatial units (how individual regions react over time) with the interpretation of parameters appropriately adapted depending on the application.
Cross-section applications focus on long-run variations in labor markets for a given universe of regions. In this case, the β coefficients measure the nature of the national relationship (sticky or flexible), the α coefficient measure the change in the natural or long-term unemployment rate while the R2 statistic measure the homogeneity of the regional adjustment. In such applications, a high R2, a β near unity and a α near zero would mean a system in which most communities are ‘adjusting’ as theory predicts and in perfect long-term equilibrium. The temporal applications focus on short-run variations in labour markets for one (or all) communities for a constant time period interval. In such cases, β can be interpreted as an indicator of local responsiveness or flexibility, the α measure the mean change in unemployment rate over all time period while the R2 measure the rapidity to which the labour market adjust. For temporal applications, the principal empirical constraint lies on an appropriate definition of time units and their number.
Several words of caution are in order before proceeding to empirical analysis. The operationalization of concepts like adjustment, responsiveness, and flexibility is necessarily sensitive to choice of spatial and time units: what makes senses on one level may not at another. This is a classic problem in geographic analysis, usually referred to as the Modifiable Areal Unit Problem (MAUP) (OPENSHAW 1984, 1977; OPENSHAW and TAYLOR, 1979) also highlighted in the work on the ecological fallacy (ecological fallacy - ROBINSON, 1950). Simply put, MAUP suggests that results obtained for certain geographies (spatial unit definitions) may not be generalizable to other geographies. Also, the use of aggregate labour supply and demand variables and the absence of price (wage) variables mean that the meaning given to ‘adjustment’ is necessarily limited in scope. Finally, the regional adjustment model, like all reasoning grounded in standard labour demand and supply mechanics, is founded on postulates (constant technologies and preferences, diminishing returns…) that do not always fully apply, especially on the long run.
DATA
All data are drawn from the Statistics Canada Labour Force Survey (LFS), accessible on-line (Stat Can, on-line), released on a monthly basis. In addition to Canada-wide and Provincial series, information is published at two sub-provincial spatial levels: by Census Metropolitan Area (CMA), urban agglomerations with populations over 100,000; and by Economic Region (ER), statistical-administrative spatial units. The survey is applied to sample households at both spatial levels, focusing on the working age population (15 years and older). Households are followed over a six month period, with a sixth of the panel replaced each month. Sampling criteria are applied in two stages: first, samples of basic territorial units are chosen, followed by samples of households. As with all surveys, results are subject to sampling errors, especially for smaller spatial units and shorter time periods. Certain series are only available at the provincial and national levels.
The principal advantages of the LFS are its continuality and frequency, thus ideal for analysing changing labour demand, the only source in Canada for monthly and annual series. Among its disadvantages, related to the survey nature of the data, are the sometimes wide fluctuations in monthly results due to seasonal variations, sampling errors, geographical assignation or insufficient sample size. For this reason, it is preferable to work with annual data, which while not entirely eliminating sample-induced fluctuations do reduce their scale. The small sample-size problem means that many indicators are available only at aggregate levels. In our case, this notably impacts the labour supply and demand variables, necessarily defined as aggregates. Thus ‘flexibility’, as applied here, refers to flexibility in aggregate supply and demand with no consideration of inter-industry adjustments within communities. A parallel constraint is the absence of wage or income data, which precluded the integration of wage variables into the labour market model.
In terms of geography, the arbitrary nature of Economic Region (ER) definitions is problematic. Ideally, we would have liked to work with ERs since they cover all of Canada. However, ERs are not necessarily defined along labour market criteria, unlike Census Metropolitan Areas (CMAs) which are delineated in accordance with daily commuting patterns and, as such, correspond to distinct labour sheds. ERs, on the other hand, are administrative units defined by the Provinces. Thus, in Ontario, Economic Region 570 (Windsor-Sarnia) includes Windsor, a CMA, and towns and counties that do not fall into Windsor’s labour market shed. ER 920 (Lower Mainland) in British Columbia (B.C.) encompasses two CMAs, Vancouver and Abbotsford, as well as a wide swath of territory deep into the B.C. interior. At the other end of the spectrum, in Quebec, ER 445 (Laval) is a bedroom community lying entirely within the Montreal CMA.
A new integrated geography was thus constructed using both spatial data sets. To take an example, the Windsor CMA was extracted from ER 570 creating two units: 1) the Windsor CMA; 2) a new smaller 570, dubbed Sarnia2. Other examples entailed more complex manipulations. The new integrated geography is made up of 83 spatial units: (excluding the three Territories), comprising 51 unmodified ERs, 18 CMAs, and 14 modified economic regions (Map 1). Although this new geography constitutes an improvement, it remains a second best. Some spatial units cover vast expanses, making it difficult to attribute outcomes to particular places. Thus, the Côte-Nord & Nord-du-Québec economic region covers an area several times the size of France, encompassing the urban areas of Sept-Îles and Baie-Comeau as well as the territories of several aboriginal peoples.
Figure 3 – Study Regions
Among the other constraints, not all series are available over the entire time period. The LFS was begun in 1987, the starting point for most series. However, data for British Columbia ERs outside CMAs are unavailable before 1995. Series for the Yukon, Nunavut, and the Northwest Territories also begin later. For some mysterious reason, the data series for the Sudbury CMA begins in 1990, which also affects the newly created Northeast Ontario ER. Thus, analysis for all 83 spatial units is limited to 1995-2011 (sixteen years). Analyses for 1986 -2011 cover either subsets of ERs or larger territorial units (regions or provinces).
RESULTS
Results are presented for different model specifications. First, long-run changes are analyzed for all Canadian regions with particular attention to changing labour market conditions between 1995 and 2011. We begin by presenting the positioning of various regions over this period. Subsequently, the regional adjustment model is estimated and the various parameters analyzed.
The second part focuses on individual regional labour markets. Macro results are first presented for the five major regions of Canada and labour market parameters discussed. Subsequently, the results for the 83 Canadian communities are presented, coefficients analyzed, and particular cases discussed in greater detail.
LONG TERM ADJUSTMENTS:CANADA 1987-2011,LARGE REGIONS 1995-2011
Between 1987 and 2011, annual variations in the employment rate and labour force participation rate (LFPR) for Canada as a whole generally move together with only few exceptions (Figure 4). Of note is the apparent lack of an (annual) time lag in the variation of the two rates. The two exceptions are 1992 following the 1989-1991 recession and 2002 during the 2000-2002 downturn. In the first case, the only instance of a time lag, the LFPR curve moves up one year after the upturn in the employment curve, suggesting that this recession was perceived as particularly severe; workers hesitated before re-entering the labour force. The second case represents the opposite scenario. The LFPR curve moves up faster than the relative employment curve, suggesting that workers perceived this downturn as temporary, almost immediately re-entering the labour market after the initial 2000 shock.
Figure 4 – Employment and Labour Force Participations Rates, Annual Variation. Canada 1987-2011
Furthermore, variations in the employment rate are more pronounced than for the LFPR suggesting that supply does not adapt instantaneously to changes in demand; particularly striking during recessions (1989-91 and 2007-09). The impact of business cycles on labour demand and supply is clearly visible. Given the level of fluctuations over the twenty four years, a perfect match between the two curves would have been surprising. The overall impression, nonetheless, is that of a responsive labour market where labour supply adjusts to demand.
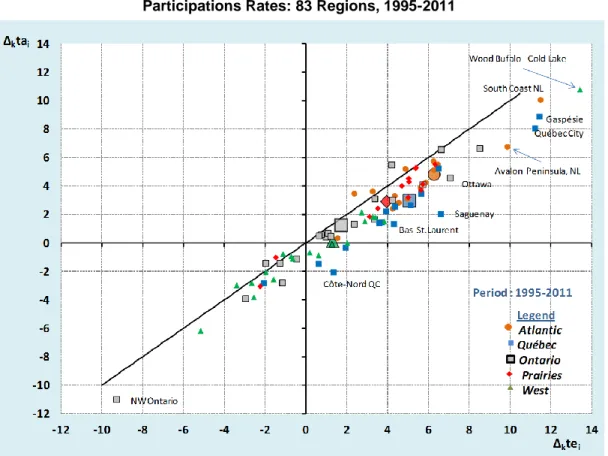
Figure 5 – Relative Variation in Employment and Labour Force Participations Rates: 83 Regions, 1995-2011
Moving to the 83 region level (figure 5), the picture for 1995- 2011 suggests that adjustments remain imperfect, although unemployment rates have generally declined. This 16 years period is characterized by overall growth; thus, few regions are found in quadrants located east of the reference line (∆ktei < 0). No region is in the ‘unlikely’ (and unsustainable) northeast quadrant, while some regions are found in the southeast quadrant with both declining labour demand and supply. The worst case is northwestern Ontario, which nonetheless registered a decline in unemployment, the outcome of a greater decline in supply than in demand, undoubtedly due in large part to out-migration. Communities exhibiting a decline in both in supply and demand are most frequent in Ontario and Western Canada.
Most communities lie in the western half of the graph, suggesting simultaneous growth in supply and labor demand. The cases with the sharpest increases in both supply and demand are Wood Buffalo-Cold Lake (Fort McMurray), South Coast NL, Gaspésie-Îles-de-la-Madeleine, and Quebec City. In the two Quebec regions, plus Saguenay, the rapid growth in labour demand translates into a significant decline in the unemployment rate. Several regions are located in the southwest quadrant: North Shore-Northern Quebec (Côte-Nord), Lac-St-Jean, rural parts of the Eastern Townships of Quebec (Estrie), Cariboo, and Banff-Jasper. All are regions highly
dependent on natural resources. The first two are cited by POLÈSE and SHEARMUR, 2006; as examples of the ‘intrusive rentier syndrome’, whereby large high-wage plants (mainly smelters and paper mills) crowd-out other industries, thus lowering labour participation below what is normally expected; an incongruous combination of high wages and net-outmigration.
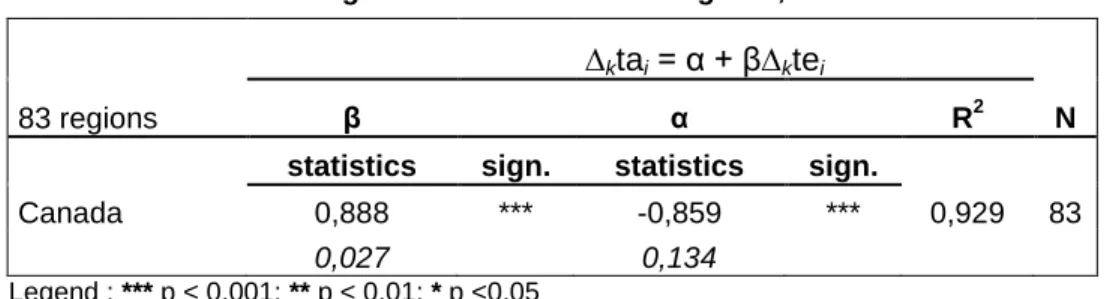
Table 1 – Regression Results – 83 Regions, 1995-2011
∆ktai = α + β∆ktei
83 regions β α R2 N
statistics sign. statistics sign.
Canada 0,888 *** -0,859 *** 0,929 83
0,027 0,134
Legend : *** p < 0,001; ** p < 0,01; * p <0,05
Note: Standard error of the coefficient appears below in italics
k = 16 (2011-1995)
Regression analysis suggests that, overall, labour supply in Canadian communities has adjusted fairly well to changes in demand over the long run (Table 1). However, the slope parameter (β) measuring labour market flexibility is less than one, suggesting a certain rigidity of fit (for perfect flexibility β = 1). The results also suggest a relatively homogenous pattern of adjustments across regions as the R2 statistic is quite high with a concentration of points along the regression line. Finally, the results suggest an overall shift in unemployment rates; the α coefficient is below zero and statistically significant, meaning that regional unemployment rates fell by 0.86 percentage points on average, varying in between 0.66 and 1.12 percentage points over regions.
SHORT TERM ADJUSTMENTS
To examine regional short-term supply and demand adjustments, we proceed in two stages. We first examine aggregate demand and supply variations for five large Canadian regions and then move on to examine variations at the 83 community level.
For Aggregate Regions
The analysis for the five large Canadian regions is applied over the entire twenty-five years (1987 to 2011: N = 24) (Table 2). Results are consistent with Figure 4, with values for the β coefficient below unity (1), sign of the relative inelasticity of labour supply. The principle sources of stickiness are Ontario and, especially, the West where the β are lower. However, the β coefficients need to be interpreted in conjunction with the R2 results which, as noted earlier, may be seen as an indication of rapidity of market adjustment. For the West, the low β and R2 are parallel reflections of the historical boom and bust nature of the regional economy, heavily
dependent on oil and gas extraction in Alberta and logging and mining in British Columbia (BC). Ontario’s low β, although with a higher R2
, can also be traced to economic structure, with employment concentrations in sectors hard hit by the 1989 and 2007 recessions, notably finance and real estate and the automobile industry, the former primarily concentrated in the Toronto area and the latter in Southern Ontario (BOURNE et al., 2011).
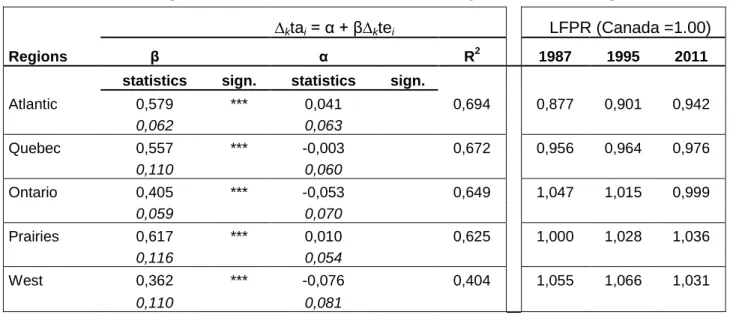
Table 2 – Regression Results and Labour Force Participations Rates, 5 Regions
∆ktai = α + β∆ktei LFPR (Canada =1.00) Regions β α R2 1987 1995 2011 statistics sign. statistics sign.
Atlantic 0,579 *** 0,041 0,694 0,877 0,901 0,942 0,062 0,063 Quebec 0,557 *** -0,003 0,672 0,956 0,964 0,976 0,110 0,060 Ontario 0,405 *** -0,053 0,649 1,047 1,015 0,999 0,059 0,070 Prairies 0,617 *** 0,010 0,625 1,000 1,028 1,036 0,116 0,054 West 0,362 *** -0,076 0,404 1,055 1,066 1,031 0,110 0,081 Legend : *** p < 0,001; ** p < 0,01; * p <0,05
Note: Standard error of the coefficient appears below in italics
Atlantic = Newfounland & Labrador, Prince Edward Island (PEI), Nova Scotia, New Brunswick Prairies = Manitoba, Saskatchewan;
West = Alberta, British Columbia (BC).
The results also tell us that the intercept crosses at zero (α = 0), consistent with a generally stable unemployment rate in the short-run and a well-behaved labour market3. The short time-frame helps to explain the relatively high responsiveness (high β) of Quebec and the Atlantic Provinces with generally stable but less rapidly growing regional economies. Table 2 also shows labour force participation rates (LFPRs) for three points in time, relative to the Canadian average4, translating the over-all propensity of the work-age population to enter the labour force. For the earliest time point (1987), Quebec and especially Atlantic Canada exhibit below-average scores, consistent with the stunted regional adjustment argument, recalling Courchene (1978, 1981). Whether because of language, insularity, the weight of transfer payments or other factors, Quebecers and Atlantic Canadians were not entering the labour force as much as they should.
3
However, without much longer time series, it may well that the result (α = 0) is a fortuitous coincidence, nicely consistent with theory, recalling our earlier discussion on the conditions for long-term equilibrium.
4
However, Table 2 also shows an improvement over time, especially for Atlantic Canada, with an overall trend across Canada toward a convergence in LFPRs. A general lower propensity to enter the labour force (low LFPR) is not necessarily incompatible with greater ‘flexibility’ as defined by the β coefficient.
For Individual Communities
We now examine the data from another angle. The temporal regression equation (n = 24 or 16 years depending on data availability) is applied individually to the eight-three spatial units. For temporal regressions, it is important to recall when comparing β and R2 results across regions that demand and supply variations are calculated relative to each region’s range of variations, which a priori should penalize more volatile, smaller, regions. Fully compensating for annual demand changes is, we would expect, more arduous where these fluctuate widely from year to year. A first point to note is the range of estimated β coefficients from a peak of 1.09 (Gaspésie) to a low of 0.33 (PEI), displaying the diversity of labour supply responses to changing demand conditions (Table 3). With only one exception, PEI, the three largest metropolitan areas, Toronto, Montreal, and Vancouver, yield the lowest β coefficients and thus have, seemingly, the least flexible labour markets. Indeed, nine out of the ten largest metropolitan areas fall in the highest quartile, with β coefficients below 0.70 (Table 4) with Quebec City the only exception. However, looking at all 83 communities, the results show the majority register coefficients above 0.80, indicative of a relatively high degree of flexibility although never perfect (Figure 6).
Insert. Table 3 – Regression Results– 83 Regions, 1987-2011 Lowest Highest Region β α R2 N Region β α R2 N 83 PEI 0,333 0,135 0,272 24 1 Gaspesie QC 1,089 -0,078 0,752 24 82 Vancouver 0,384 -0,101 0,262 24 2 Saguenay QC 1,069 -0,092 0,842 24 81 Toronto 0,432 -0,063 0,558 24 3 Kootenay BC 1,067 0,001 0,850 16 80 Montréal 0,530 -0,031 0,516 24 4 Estrie QC 1,057 -0,110 0,886 24 79 Cariboo BC 0,556 -0,076 0,474 16 5 Yorkton SK 1,008 -0,022 0,961 24 78 Calgary 0,559 -0,063 0,683 24 6 Kingston 1,004 -0,045 0,948 24 77 London 0,641 -0,047 0,673 24 7 Bas-Saint-Laurent 1,002 -0,093 0,888 24
76 Winnipeg 0,641 -0,014 0,698 24 8 Norwest ON-NM 0,986 0,004 0,906 24
75 Okanagan BC 0,648 -0,022 0,661 16 9 South Central MB 0,983 -0,025 0,948 24
74 Northeast ON 0,650 -0,034 0,851 21 10 Southwest MB 0,980 -0,044 0,966 24
73 North Shore NS 0,653 0,030 0,628 24 11 Southeast MB 0,973 -0,031 0,926 24
72 Windsor 0,661 -0,051 0,642 24 12 Prince Albert SK 0,971 -0,056 0,876 24
71 Hamilton 0,667 -0,069 0,714 24 13 Central NL 0,967 0,019 0,779 24
70 Edmonton 0,670 -0,117 0,658 24 14 North Central MB 0,967 -0,028 0,968 24
69 Cape Breton 0,679 -0,012 0,679 24 15 Outaouais QC 0,952 -0,111 0,878 24
68 Kitchener 0,685 0,028 0,670 24 16 Edmundston NB 0,952 -0,027 0,904 24
67 Ottawa 0,689 -0,040 0,759 24 17 South Coast NL 0,946 0,173 0,734 24
66 Sherbrooke 0,691 -0,053 0,770 24 18 Swift Current SK 0,935 -0,044 0,903 24
65 Thunder Bay 0,693 -0,113 0,666 24 19 Pembroke 0,934 0,006 0,914 24
64 Oshawa 0,697 -0,019 0,721 24 20 Villes satellites QC 0,926 -0,041 0,881 24
63 Athabasca AL 0,703 0,012 0,747 24 21 Southern NS 0,923 0,045 0,872 24
62 Vancouver Island 0,713 -0,157 0,933 16 22 Campbellton NB 0,922 0,035 0,721 24
61 Sudbury 0,717 -0,004 0,734 21 23 Lac-Saint-Jean 0,915 -0,162 0,805 24
60 Saint John NB 0,724 -0,046 0,860 24 24 Stratford ON 0,899 0,017 0,919 24
59 West Coast NL 0,726 -0,137 0,621 24 25 Chaudiere-Appalaches 0,899 0,005 0,802 24
58 Barrie ON 0,733 0,149 0,668 24 26 Wood Buffalo AL 0,897 -0,113 0,885 24
57 Gatineau 0,739 -0,063 0,862 24 27 Centre-du-Quebec 0,894 -0,059 0,896 24
56 Red Deer 0,739 -0,109 0,786 24 28 Québec 0,893 -0,035 0,879 24
55 St. Catharines ON 0,752 -0,023 0,826 24 29 Camrose AL 0,889 -0,026 0,866 24
54 Halifax 0,761 -0,059 0,700 24 30 ParklandsMB 0,884 -0,012 0,935 24
53 Avalon Peninsula 0,763 -0,021 0,789 24 31 Banff - Jasper 0,883 -0,123 0,861 24
52 Victoria 0,771 -0,071 0,858 24 32 Cote-Nord & Nord QC 0,869 -0,083 0,794 24
51 Moose Mountain 0,793 0,006 0,880 24 33 Regina 0,865 -0,038 0,798 24
50 Fredericton - Oromocto 0,795 -0,038 0,865 24 34 Abitibi-Temiscamingue 0,862 0,043 0,819 24
49 Simcoe 0,799 -0,021 0,882 24 35 Annapolis Valley 0,860 -0,037 0,877 24
48 Sarnia 0,807 -0,019 0,809 24 36 Woodstock 0,859 0,042 0,844 24
47 Lower Mainland NM 0,829 -0,107 0,867 16 37 Mauricie 0,852 -0,113 0,810 24
46 Interlake 0,831 0,014 0,920 24 38 Northeast BC 0,851 -0,072 0,640 16
45 Muskoka - Kawarthas 0,836 0,002 0,870 24 39 North Coast BC & Nechako 0,850 0,012 0,883 16
44 Moncton - Richibucto 0,841 -0,066 0,740 24 40 Abbotsford 0,850 0,027 0,753 24
43 Lethbridge - Medicine Hat 0,843 -0,052 0,909 24 41 Saskatoon - Biggar 0,849 -0,062 0,893 24
Table 4 – Beta (β) Coefficients, Rank, and Population for the 10 Largest Cities Urban Area β Rank Population
ˠ
RankToronto 0,432 81 5 583 064 1 Montréal 0,530 80 3 824 221 2 Vancouver 0,384 82 2 313 328 3 Ottawa 0,689 67 1 236 324 4 Calgary 0,559 78 1 214 839 5 Edmonton 0,670 70 1 159 869 6 Québec 0,893 28 765 706 7 Winnipeg 0,641 76 730 018 8 Hamilton 0,667 71 721 053 9 Kitchener 0,685 68 477 160 10
ˠ
CMA population in 2011The flexibility of small regions is surprising. One would expect large urban areas to have more responsive labour markets. However, the results flow in part from the aggregate nature of the labour supply variable, which integrates migration. Bernard (2011) finds that in and out migration rates in Canada are negatively correlated with urban size. The LFPR in part reflects the perception of workers of their chances of finding a job. In a small community with a single paper mill workers will be highly sensitive to the hiring and firing cycles of the main employer. In a downturn (or worse yet, plant closure), workers will, we would expect, have low expectations of finding a job locally and correspondingly withdraw from the labour force, many choosing to move elsewhere. In large metropolitan areas the situation is the exact the opposite, with large diversified labour markets. In downturns, laid-off workers are, we would expect, less likely to leave or exit the labour force. The chances of finding employment are comparatively better in large labour markets. The low β coefficient for Vancouver suggests that workers are likely to stay and search, sharp fluctuations in labour demand notwithstanding or, alternatively, that workers keep arriving irrespective of labour market cycles. To test for the effect of size, the β coefficients were correlated with population size (Table 5), yielding a negative coefficient (-0.52). In short, it appears that smaller communities have more ‘flexible’ labour markets.
Table 5 – Correlation Coefficients: Beta (β) Coefficients and Population (n=83) β α R2 Pop β 1.00 α - 0.03 1.00 R2 0.78 - 0.09 1.00 Pop - 0.52 - 0.08 - 0.45 1.00
Significant at 0.05 or better in bold.
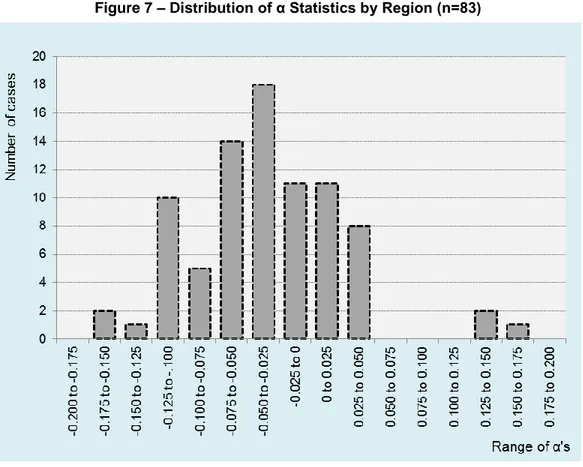
The second point to note is the negative sign associated in most cases with the α parameter (Table 3), suggesting that for the reporting period the ‘equilibrium’ unemployment rate has tended to decline over time (Figure 7). Concretely, the coefficients suggest a gradual decrease in regional unemployment rates, consistent with long-term results obtained earlier. However, none of the coefficients is statistically significant. The results are, needless to say, a function of the time period analyzed and of sample size. In the present case, the results suggest an absence for all regions of significant breaks in the evolution of short-term unemployment rates. Individual community analysis of the evolution of equilibrium unemployment rates is not possible given the small sample size and absence of disaggregate regional data.
A last point of interest is the relative synchronization of adjustments over time for different communities. Speed of adjustment, as noted earlier, can be gauged from the R2 statistic. The results suggest that adjustments are on the whole is fairly rapid: most of R2 fall between 0.80 and 0.90 and the vast majority above 0.70 (Figure 8). Most small regions show high β coefficients and high R2s, a sign of responsive labour markets and quick reaction times, an impression reinforced by the negative correlation between R2's and population size (Table 5), suggesting that labour in smaller communities tends, on the whole, to adjust quickly to demand changes.
Figure 8 – Distribution of R2 Statistics by Region (n=83)
We now turn to the a priori surprisingly flexible performance of Quebec communities. Among the ten most flexible regions, four are in Quebec (Table 3). These four are also among the seven that exhibit a β coefficient greater than 1, a result contrary to what one might have expected given the language barrier. What might account for this apparent anomaly? The answer, we suggest, lies in part in spatial scale. Studies documenting the lower geographic mobility of Quebecois, including those cited earlier, generally examine inter-provincial migration. We are looking at the sub-provincial level. Quebec Francophones are less likely to move to other provinces than the general Canadian population. But, this need not hold for inter-community movements. One could argue that intra-Quebec mobility would be higher than in less culturally homogeneous environments. A move from Saguenay to Quebec City does not represent a major cultural
change. In addition, the province of Quebec represents a fairly large labour market with a population of some eight million, comparable to Sweden or Switzerland. There is no reason why labour mobility should not be high within this largely homogenous labour market.
To end, the answer to the question in the title of this paper is both yes and no, depending on time-frames and spatial scales. If long-term adjustments are the objectives, the evidence suggests that lagging communities still need to ‘adjust’ more. On the other hand, the results show that Canadian communities are on the whole ‘adjusting’ well to short and mean term changes in demand with no indication that smaller or slower growing communities are less so. The problem in part lies in the ambiguous relationship between flexibility, as defined here, and structural factors underlying the performance of regional economies, bringing us back full circle to the debate on regional adjustment and disparities in income and employment. Does greater (short-term) flexibility improve regional performance on the long run? The answer should be yes, and indeed our results suggest a long-term downward trend in unemployment rates. Yet, long-term disparities in unemployment rates persist, a sign of inadequate adjustment. The relative weight of ‘inflexibility’ versus structural factors in this observed persistence is difficult to gauge. Where the causes are structural (i.e. the exhaustion of a resource), flexibility can mean sustained employment and population decline, which in the end is the ultimate form of adjustment.
CONCLUSION
The principal contribution of this paper is the development of a local labour market model grounded in demand and supply mechanics. The model simultaneously considers changes in local labour demand and supply, integrating net labour migration. Via the use of standardized employment and labour force participation rates, the application of the model produces statistically verifiable results comparable across regions, irrespective of population size. Indicators of labour flexibility are derived from estimated labour demand and supply curves for given time-frames: ‘flexible’ labour markets are characterized by ‘responsive’ (non-flat) supply curves and closely synchronized changes over time. Spatial units can thus be compared by order of flexibility.
The model was applied to the study 83 Canadian regions over various time-frames and geographies between 1987 and 2011. The results bring home the challenges of operationalizing concepts like adjustment, flexibility and responsiveness. Labour demand and supply variations are sensitive to time-frames and territorial definitions. Short term adjustments in response to business cycles are of a different nature than long-term adjustments. Variations in aggregate
labour supply and demand are sensitive to community size. Also, local labour supply variations cannot be properly interpreted without considering past demand variations and variations in neighbouring communities.
With these caveats in mind, findings can be summarized as follows:
Local labour markets in Canada behave ‘efficiently’ on the whole, consistent with what regional adjustment logic predicts. Labour supply ‘adjusts’ as predicted and in general fairly rapidly to cyclical upswings and downswings in labour demand. However, results over longer time periods suggest that regional adjustments to changing labour demand conditions remain imperfect, with continuing rigidities. The longer term trend (1995-2011) is nonetheless towards a convergence of relative variations in labour supply and demand and thus towards falling unemployment rates. The majority of Canadian communities ‘adjust’ to mean and long-term variations in labour demand conditions (16 and 24 year periods), moving in the expected direction; though not as fast as perfect flexibility would require. Those that deviate from the norm are mostly small volatile resource economies.
We find a negative relationship between community size and labour market responsiveness. Labour markets in smaller communities are on average more ‘flexible” than in large urban areas. However, this result stems in part from the use of aggregate labour demand and supply variables in which migration is subsumed. Smaller communities will normally exhibit higher net migration rates than larger ones.
Local labour market adjustment varies across regions. The two Western Provinces were found to have the ‘stickiest’ local labour markets, while those in the two Prairie Provinces the most responsive. The a priori surprising result for the West is in part explained by the consistent drawing power of certain British Colombia locations (i.e Vancouver), even during downturns in demand. Local labour markets in Quebec were found to be no less responsive than elsewhere, an equally surprising result given the language constraint. Language is a barrier to inter-provincial adjustment but, we suggest, not within Quebec. Cultural homogeneity within Quebec may in fact facilitate mobility. We find no evidence that labour in traditionally lagging communities in Atlantic Canada is less responsive to demand fluctuations; labour force participation rates are generally lower, but converging to the Canadian average. Overall, local labour markets in Quebec and Atlantic Canada were generally found to more responsive than those in Ontario.
Finally, our findings are somewhat at odds with other studies which tend to focus on the rigidity or stickiness of regional labour markets in Canada. The explanation is in part methodological. Studies consulted generally looked at migration as the main channel of adjustment, especially
between provinces, and / or focused on single indicators such as the unemployment rate, which brings us back full circle to the difficulty of operationalizing concepts like flexibility and adjustment, which must always imply an element of judgement.
REFERENCES
ANSELIN L. (1995) Local Indicators of Spatial Autocorrelation - LISA, Geographical Analysis, 27(2): 93-115;
ANSELIN L. (1996) The Moran Scatterplot as an ESDA Tool to Assess Local Instability in Spatial Association, in FISCHER M., SCHOLTEN H. J. and UNWIN D. (Eds) Spatial Analytical Perspectives
on GIS, Taylor & Francis, London;
APPARICIO P., POLÈSE M. and SHEARMUR R. (2009) “Une histoire de résidus : à propos des facteurs généraux et locaux de croissance régionale, Canada 1971-2001”, The Canadian Geographer, 53 (4) : 385-403;
BALDWIN J, BROWN M., MAYNARD J.-P., and ZIETSMA D. (2004) Interprovincial Differences in GDP per Capita, Labour Productivity and Work Intensity: 1990-2003, Insights on the Canadian Economy, Catalogue no. 11-624-MIE — No. 01, Statistics Canada, Ottawa;
BARNES T.J., HUTTON T., LEY D. and MOOS M. (2011) Vancouver: Restructuring Narratives in the Transnational Metropolis, in BOURNE L. S. et al. (eds) Canadian Urban Regions. Trajectories of
Growth and Change, Oxford University Press;
BARNES T. J. and HUTTON T. A. (2009) Situating the new economy: Contingencies of regeneration and dislocation in Vancouver’s inner city, Urban Studies, 46 (and 6): 1247-69;
BARRO R.J. and SALA-I-MARTIN X. (1991) Convergence Across States and Regions, Brookings Papers
on Economic Activity, 1: 107-182;
BARRO R.J. and SALA-I-MARTIN X. (2004). Economic Growth, 2nd Edition, MIT Press, Cambridge, MA; BAYOUMI T., SUTTON B. and SWISTON A. (2006) Shocking Aspects of Canadian Labour Markets. IMF
Working Paper 06/83. International Monetary Fund, Washington D.C;
BEINE M. and COULOMBE S. (2003) Regional perspectives on dollarization in Canada, Journal of
Regional Science, 43: 541-569;
BERNARD A. (2011) Regional economic shocks and migration, Perspectives on Labour Economics (Statistics Canada), Winter: 1-15;
BLANCHARD O. and KATZ L. (1992) Regional Evolutions, Brookings Papers on Economic Activity, 1: 1-75;
BOURNE L., BRUNELLE C., POLÈSE M. and SIMMONS J. (2011) Growth and Change in the Canadian Urban System, in BOURNE L. S. et al. (ed) Canadian Urban Regions. Trajectories of Growth and
Change, Oxford University Press;
COFFEY W. J. and POLÈSE M. (ed.) (1987) Still Living Together: Recent Trends and Future Directions in Canadian Regional Development, Institute for Research on Public Policy, Montreal;
COULOMBE S. (2000) New evidence of convergence across Canadian provinces: The role of urbanisation, Regional Studies, 34: 713-725;
COULOMBE S. (2006) Internal Migration, Asymmetric Shocks, and Interprovincial Economic Adjustments in Canada, International Regional Science Review, 29 (2): 199-223;
COULOMBE, S. (2011) Lagging Behind: Productivity and the Good Fortune of Canadian Provinces, C.D.
Howe Institute Commentary 331, C.D. Howe Institute, Toronto;
COURCHENE T. (1978) Avenues of adjustment, the transfer system and regional disparities, in
CANADIAN CONFEDERATION AT THE CROSSROADS, Fraser Institute, Vancouver;
COURCHENE T. (1981) A Market Perspective on Regional Disparities, Canadian Public Policy, 7 (4): 506-518;
DECRESSIN J. and FATAS A. (1995) Regional Labour Market Dynamics in Europe, European Economic
Review, 39: 1627-1655;
DREWES T. (1986) Regional Unemployment Disparity and Market Adjustment Failure, Canadian Journal
of Regional Science, 9 (3): 323-340;
EPIFANI P. and GANCIA G. A. (2005) Trade, Migration and Regional Unemployment, Regional Science
and Urban Economics, 35: 625-644;
FIDRMUC J. (2003) Migration and Regional Adjustment to Asymmetric Shocks in Transition Economies, CEPR Discussion Paper No. 3798 Centre for Economic Policy Research, University of Michigan, Ann Arbor;
GAGNÉ G. et LANGLOIS S. (2005) “L’énigme de la région de Québec”, Annuaire du Québec 2006, Fides, Montréal : 452-55;
GLAESER E. (2011) Triumph of the City, The Penguin Press, New York;
GU W. and SAWCHUCK G. D. (2006) How are Canadian Regions Adjusting to a Larger and More Integrated North American Market? Economic Analysis Research Paper Series (Statistics Canada), 34: 1-32;
GUILLEMETTE Y. (2006) Misplaced Talent: The Rising Dispersion of Unemployment Rates in Canada,
E-brief 33, C.D. Howe Institute, Toronto;
GUILLEMETTE Y. (2007) Chronic Rigidity: The East’s Labour Market Problem and How to Fix It, E-brief
33, C.D. Howe Institute, Toronto;
KIRDAR M. G. and SARACOGLU D. S. (2008) Migration and Regional Convergence: An Empirical Investigation for Turkey, Papers in Regional Science, 87(4): 545-566;
LANGLOIS S. (2007) “Le mystère de Québec”, in “Sociologie de la Ville de Québec”, Les cahiers des dix, No 61 : 211-213;
LUCAS R. (1988) On the Mechanics of Economic Development, Journal of Monetary Economics, 22: 3-42;
MACKAY R. R. and DAVIES R. (2012) Collective Learning, Effective Demand, Loss of Work and Loss of Direction: The Growing Regional Divide within the UK, Regional Studies, 46(7): 859-871;
MONASTIRIOTIS V. and KAPLANIS I. (2012) Flexible Employment and Cross-Regional Adjustment, SERC Discussion Paper 100, Spatial Economics Research Centre, London Scholl of Economics:
www.spatialeconomics.ac.uk/;
NIEBUHR A., GRANATO N., HAAS A. and HAMANN S. (2012) Does Labour Mobility Reduce Disparities between Regional Labour Markets in Germany?, Regional Studies, 46(7): 841-858;
OPENSHAW S. (1977) A Geographical Solution to Scale and Aggregation Problems, in Region-Building, Partitionning, and Spatial Modelling, Transactions of the Institute of British Geographers, New Series 2: 459-475;
OPENSHAW S. (1984) The Modifiable Areal Unit Problem, Geo Books, Norwich;
OPENSHAW S. and TAYLOR P. J. (1979) A Million or so Correlated Coefficients: Three Experiments on the Modifiable Areal Unit Problem, in WRIGLEY N. and BENNET R. J. (Eds) Statistical Applications in
the Spatial Sciences, Pion, London;
POLÈSE M. (1981) Regional Disparity, Migration and Economic Adjustment: A Reappraisal, Canadian
Public Policy, 8 (4): 519-525;
POLÈSE M. (2009) The Wealth and Poverty of Regions: Why Cities Matter, 254 p., University of Chicago Press, Chicago;
POLÈSE M. (2012) “L’autre ‘mystère de Québec’. Regards sur une mutation économique étonnante”,
Recherches sociographiques, LIII (1): 133-156;
PUHANI P. A. (2001) Labour Mobility: An Adjustment Mechanism in Euroland? Empirical Evidence for Western Germany, France and Italy, German Economic Review, 2(2): 127-140;
ROBINSON W. S. (1950) Ecological Correlations and the Behavior of Individuals, American Sociological Review, American Sociological Review, 15 (3): 351–357;
ROMER P. (1986) Increasing Returns and Long-Run Growth, Journal of Political Economy, 94: 1002-1037;
ROMER P. (1994) Origins of Endogenous Growth, Journal of Economic Perspectives, 8,1: 3-22;
SHEARMUR R. and POLÈSE M. (2007) Do Local Factors Explain Local Employment Growth? Evidence from Canada 1971-2001, Regional Studies, 41 (4): 413-471;
SHEARMUR R, APPARICO P., LIZION P. and POLÈSE M. (2007) Space, Time and Local Employment Growth: An Application of Spatial Regression Analysis, Growth and Change, 38 (4): 691-717;
STAT CAN (on-line) Labour Force Survey (LFS), Statistics Canada, Ottawa, released monthly:
www23.statcan.gc.ca/imdb/p2SV.pl?Function=getSurvey&SDDS=3701&lang=en&db=imdb&adm=8&d is=2
SÜDEKUM J. (2005) Increasing Returns and Spatial Unemployment Disparities, Papers in Regional
Science, 83: 159-181.