The Working Poor in the
Montréal Region
Statistical Profile and Spatial Distribution
Xavier Leloup, Florence Desrochers et Damaris RoseInstitut national de la recherche scientifique Centre – Urbanisation Culture Société
Scientific direction: Xavier Leloup [email protected]
Institut national de la recherche scientifique Centre - Urbanisation Culture Société Dissemination:
Institut national de la recherche scientifique Centre - Urbanisation Culture Société 385, Sherbrooke Street East
Montreal (Quebec) H2X 1E3 Telephone: (514) 499-4000 Fax: (514) 499-4065 www.ucs.inrs.ca
This study was made possible by the financial support of the Social Sciences and Humanities Research Council of Canada through the Neighbourhood Change Research Partnership (www.neighbourhoodchange.ca). The views expressed in this publication are solely those of the authors and do not necessary represent those of the Partnership or the SSHRC.
ISBN 978-2-89575-367-4
Legal deposit: - Bibliothèque et Archives nationales du Québec, 2016 - Bibliothèque et Archives Canada
Table of Contents
Introduction ... 5
Who are the working poor? ... 7
The situation of the working poor in the Montreal Census Metropolitan Area (CMA) ... 10
2001 to 2006: a strong increase in working poor populations despite economic growth ... 10
2006 to 2012: a moderate increase in the working poor population despite the recession ... 11
Increasing income disparity between poor and non-poor workers ... 13
Which social groups are most likely to belong to the working poor? ... 15
Working poverty: an uneven spatial distribution in the Montreal CMA... 19
Working poverty at the neighborhood scale: significant variation at the intra-urban level ... 24
Factors explaining the growth of working poverty ... 28
The transition to a Post-Fordist regime of accumulation ... 28
A precarious and flexible labour market ... 28
Insufficient employment income ... 29
Conclusion ... 31
Introduction
The working poor have been at the centre of a great number of debates for many years. Several studies have already pointed to an increase in this population in Quebec (Yerochewski 2014). More recently, a number of international studies indicate a plateau effect in efforts to reduce poverty. If world poverty has diminished—between 1993 and today, the number of people living in poverty went from two billion to one billion, despite population growth—it also seems as though this progress has been slowed by the spread of a precarious model of employment. Today 15% of workers are living in poverty in developed countries and this number is increasing. One third of people living in poverty in emerging and developing countries are employed. As such, the situation can only get better if the quality of employment opportunities improves (ILO 2016).
The Montreal region has not escaped these trends. Globally, the population in poverty is slightly decreasing, while the number of working poor is increasing, a phenomenon highlighted by previous studies (Ulysse 2006).
This increase has occurred in a context where the Montreal economy has been reinvigorated, after a difficult period that stretched from the late 1970s to the mid-1990s. In comparison with other large Canadian cities, Montreal is in fourth place in terms of the incidence of poverty within the working population, behind Toronto, Vancouver and Winnipeg. The two cities that top that list are today important motors of the Canadian economy in a context of globalisation and free trade, while the other two are, in part, marked by their industrial past.
In Montreal, the study of the working poor is conducted in the context of a metropolitan region that while prosperous, has certain characteristics that distinguish it from other large cities in the country. First of all, the city is influenced by its history—2017 will mark the 375th anniversary of the former industrial and economic centre of the country. Following this period of dominance, Montreal experienced a period of economic transition towards services and the development of high tech activities (Polèse 2009). The city has inherited from its industrial past a social fabric marked for a long time by income inequality. The early industrial development and dominant role that the city played in continental and international trade contributed to a complex division of labour. Montreal was, for a long time, the Canadian city with the highest levels of income inequality (Walks 2013). Finally, the Montreal economy has offered incomes inferior to those available in other regions of the country, as it has been mainly centred on labour-intensive industries. Furthermore, the relative weakness of salaries and the strong presence of unqualified workers has been presented as a competitive advantage on the continental scale.
Montreal appears today as a mid-sized economic region in the North American context, with an income structure similar to the least rich regions of the country (Quebec and the Maritime provinces). It has, however, experienced a significant economic rebound after two decades of stagnation. This is exemplified by a reduction in unemployment, an increase in household income since the mid-1990s and a stronger resilience to the international economic crisis of 2008 than other regions of the country (Dubé and Polèse 2015).
gradual creation of a second and third ring of suburbs. This sprawl has been in large part fed by middle class Francophone families leaving the Island of Montreal. It was, as such, in the periphery to the North and South of the city that most of the increase in incomes occurred between 1970 and 2005. Meanwhile, the social and spatial distribution of income remains relatively stable on the Island, with the exception of central neighborhoods experiencing gentrification, like the Plateau Mont-Royal, parts of the Southwest along the Lachine Canal, and parts of Rosemont and Petite-Patrie (Rose and Twigge-Molecey 2013).
In this context of economic renewal and continuation of social and spatial inequalities, it is all the more important to examine how working poverty has evolved. Which population of workers has been most affected by this phenomenon and how are low-income workers spatially distributed in the Montreal Region?
To answer these questions, the present study is based on Census data for the period from 2001 to 2006 and on data from Canada Revenue Agency for the period from 2006 to 2012. It is original in that it has been conducted by a research partnership (the Neighbourhood Change Research Partnership—NCRP) funded by the SSHRC, and in that its goal is to study the evolution of income inequality and its effects on Canadian cities over a long period. The Partnership's databases provide access to data at several geographic scales. The current study broadly takes advantage of this particular characteristic of the data. In the following section, we will describe our definition of the working poor, with the goal of identifying people whose income depends principally on their participation in the labour market.
Who are the working poor?
There is no official or normative definition of the working poor in Canada or Quebec. In general, we can retain that the working poor includes people who are employed, but are unable to escape poverty.
The absence of an official definition makes it necessary to specify which criteria are used to identify this population. In the present study, a person belonging to the working poor is considered to have the following characteristics:
they are between the ages of 18 and 64;
they live in a household that is considered below Statistics Canada's low income measures (LIM, for more information on these measures, see the note at the end of this section);
they have earned at least $3000 annually (the minimum income required to qualify for the Working Income Tax Benefit);
they live autonomously (that is to say alone, in a couple, with or without kids, but not with a parent or another family member);
they are not a full- or part-time student.
These criteria allow us to distinguish those working and not working in the studied population (within the age group most susceptible to be employed), as well as their status of poverty.
The general logic of this definition is to identify persons who mainly depend on the labour market to meet their needs. As such, it excludes age groups with low levels of participation in the labour market, like people under 18 and those aged 65 or older, even if part of these excluded groups works in order to assist their families or because of insufficient old age pensions. The definition also does not take into account inequality within households, as poor workers living in households with incomes above the LIM are not included.
According to this logic, the definition also excludes students, as studying limits the capacity of individuals to be active on the labour market. Studying may also be interpreted as a form of investment that should guarantee higher future salaries.
For the same reasons, persons older than 65 are excluded from the definition. By doing so, we are not taking into account the aging population and the often precarious nature of the transition to retirement. It is likely that a growing proportion of seniors continue to occupy jobs, possibly complementary to retirement incomes. Neither do we account for poverty among senior citizens, which is a significant phenomenon in Quebec and Montreal, and which could grow with the increased precariousness of employment (considering that a limited number of jobs give access to benefits like retirement income)1.
1 Studies have shown that poverty among senior citizens has decreased in Canada between the 1970s and 1990s as a result of various measures taken by public authorities and increases in private retirement benefits (Osberg 2001). Recent work shows, however, that
Lastly, only people living autonomously are taken into consideration. This criterion aims to exclude people receiving substantial assistance in adulthood, materially or financially, from a parent or other family member. Even if it is possible that people live with family members because they are unable to secure incomes allowing them to live autonomously, they do not live under the same constraints as those who are autonomous and can only count on themselves to make ends meet.
The selected income threshold, age group and various criteria related to personal and household situation lead to a more conservative estimate of the working poor population than can be found in other studies. This should be kept in mind in comparing the results presented here with other work on the working poor.
A brief note on low income measures
Canada does not have an official measure of poverty. Statistics Canada provides various tools that may be used to measure this concept2. Two of these methods are the most frequently used.
The oldest measure is the Low income cut-off (LICO), which was first established at the end of the 1960s. Statistics Canada warns that the LICO is not an absolute measure of poverty. Rather, it aims to identify households living under considerable stress as a result of low income. The LICO is established based on basket of basic consumer goods (food, housing and clothing). It is, as such, regularly updated by Statistics Canada to reflect the evolution of market prices (although the evolution of the goods included in this basket is not updated). The most recent revision occurred in 1992. The LICO is adjusted based on the size of households and their place of residence (according to an urban-rural spectrum). The Low income measure (or LIM) appeared more recently. It is fixed at 50% of the median income of all households; a household making less than this is considered to be low income. To account for the size of households, the calculation is done based on a normalised income (this normalisation takes into account the size and composition of households). The LIM was first defined in the 1990s. As it is principally a measure used for international comparisons, it is only calculated at the national scale.
Both tools have their strengths and weaknesses. The last LICO was calculated over twenty years ago and no longer reflects current household consumption patterns. The LIM does not this trend has been reversed in the mid-1990s, as poverty rates bounced back to 11.1% by 2013. This reversal can be explained by a generational effect, with the retirement of people who have experienced more instability on the labour market during the 1980s and 1990s. These people often occupied precarious jobs and jobs without benefits. Future projections indicate that this phenomenon should increase, as a large proportion of workers aged 54 to 64 are in the same situation and do not have sufficient savings for their retirement (Shillington 2016). This population will, as such, join the ranks of senior citizens living in poverty.
2 For more details on ways of calculating the two indicators presented here, see the Statistics Canada publication: Low income lines: What they are and how they are created, July 2016 (http://www.statcan.gc.ca/pub/75f0002m/75f0002m2016002-eng.htm, consulted September 6 2016).
have this problem as it is updated annually. It is also worth noting that household incomes tend to increase at a faster rate than inflation over long periods. The difference between the two measures and the evolution of incomes explains why poverty is seen to be reduced in recent years when we use the LICO, but increased when we use the LIM (Shillington 2016). The main limit of the LIM is that it can only be used at the national scale. It doesn't take into consideration variations in the cost of living between different provinces or regions. As such, it may over- or underestimate the number of low income households.
As we have just discussed, there is no perfect measure of poverty, and the choice of the LIM or the LICO has an effect on the interpretations we can make. In this study, and in those done on the working poor in Toronto and Vancouver, the LIM was retained (Ivanova 2016; Stapleton, Murphy and Xing 2012). The main argument in favour of this choice was that the measure was updated annually. Another aspect in favour of using this measure was that it provides a more precise portrait of the average cost of living of all Canadians, who no longer only use their income to consume essential goods. Put simply, the LIM better reflects the purchasing power of households and their capacity to meet a broader range of needs than the LICO.
The situation of the working poor in the Montreal Census
Metropolitan Area (CMA)
2001 to 2006: a strong increase in working poor populations despite economic growth
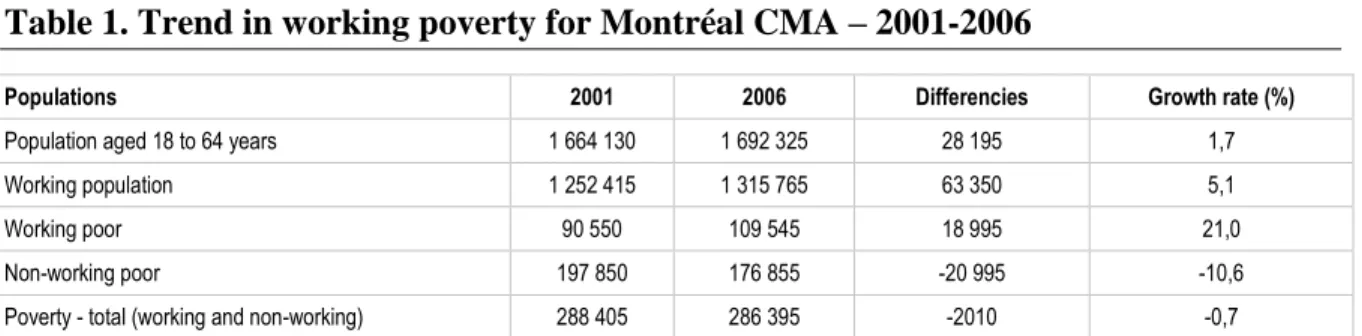
Census data from 2001 and 2006 indicate that the working poor population increased by 21%, from 90 550 to 109 545 in the Montreal CMA. During the same period, the number of workers increased by 5.1%, while the population between the ages of 18 to 64 increased by 1.7% (see Table 1)3.
Table 1. Trend in working poverty for Montréal CMA – 2001-2006
Populations 2001 2006 Differencies Growth rate (%)
Population aged 18 to 64 years 1 664 130 1 692 325 28 195 1,7
Working population 1 252 415 1 315 765 63 350 5,1
Working poor 90 550 109 545 18 995 21,0
Non-working poor 197 850 176 855 -20 995 -10,6
Poverty - total (working and non-working) 288 405 286 395 -2010 -0,7
Notes: the total population do not include students and only take into account people living on an autonomous
basis (see the method section for more details); all estimates are based on before-tax income for 2000 and 2005.
Source: Statistics Canada, Censuses of Canada, 2001 and 2006, special tabulation prepared for the NCRP.
As such, the working poor population significantly increased during this period, at four times the rate of total employment, even though Montreal experienced a period of relative prosperity in terms of economic growth. The proportion of the working poor population (calculated as a percentage of total workers) was 8.2% in 2006, while it was 7.2% in 2001. Another element that bears consideration is the (modest) decrease in overall poverty. This reduction was entirely due to a decrease in the unemployed low income population (the non-working poor); this population went from 197 850 to 176 855, a decrease of more than 10% between 2001 and 2006.
As a result of this, the working poor made up a larger proportion of total poverty. While they counted for 31% of the total poor population in 2001, this proportion was 38% in 2006. This is to say that close to 4 low income people on 10 were employed in the Montreal region.
These trends suggest that for a larger part of the population, obtaining employment is not a
3 The numbers presented in these tables are estimates produced using the long form census in 2001 and 2006. It is important to remember that the long form census is only sent to one out of five Canadian households. For 2006 and 2012, we also use annual tax return data from the Canadian Revenue Agency. These are compiled by Statistics Canada and made available in the T1FF file (T1 Family Files). Once again, these data is an estimate, as they cover only part of the national population.
guarantee against poverty. The face of poverty is also changing, with a higher proportion of the poor population working.
2006 to 2012: a moderate increase in the working poor population despite the recession
The data on declared incomes by Canadian taxpayers, compiled by Statistics Canada from information submitted by the Canada Revenue Agency, show the same trends, while somewhat less pronounced, for the period from 2006 to 20124.
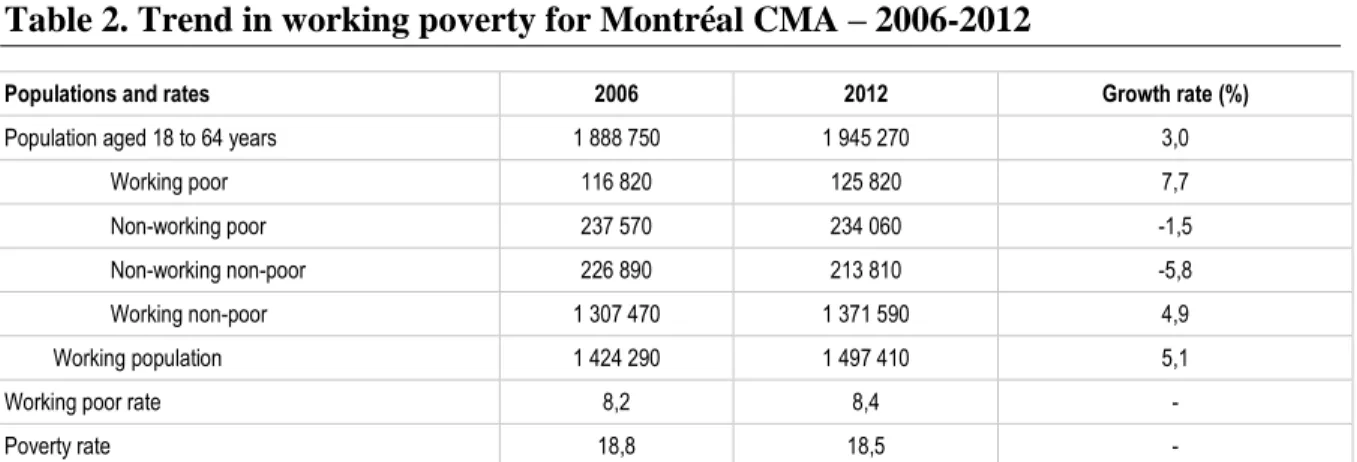
Between 2006 and 2012, a period characterised by a major economic recession, the total number of workers grew by 5%, the same rate as the previous period (see Table 2). Meanwhile, the working poor population grew by 7.1%, as the number of working poor increased from 116 820 in 2006 to 125 820 in 2012 (the differences in estimates from census data and Canada Revenue Agency data for 2006 are due to differences in data collection—see footnote 3). As such, the proportion of the working poor population increased from 8.2% in 2006 to 8.4% in 2012. Lastly, the non-working poor population decreased again by half a percent, giving a total increase in poverty of 1.5%. It is also noteworthy that the poverty rate of the population between the ages of 18 and 64 remained stable around 18%.
Table 2. Trend in working poverty for Montréal CMA – 2006-2012
Populations and rates 2006 2012 Growth rate (%)
Population aged 18 to 64 years 1 888 750 1 945 270 3,0
Working poor 116 820 125 820 7,7
Non-working poor 237 570 234 060 -1,5
Non-working non-poor 226 890 213 810 -5,8
Working non-poor 1 307 470 1 371 590 4,9
Working population 1 424 290 1 497 410 5,1
Working poor rate 8,2 8,4 -
Poverty rate 18,8 18,5 -
Notes: the total population do not include students and only take into account people living on an autonomous
basis (see the method section for more details); all estimates are based on after-tax income for 2005 and 2011.
Source: Canada Revenue Agency, T1FF file, Statistics Canada, special tabulation prepared for the NCRP.
According to Canada Revenue Agency data, the proportion of workers among the low income population grew between 2006 and 2012, as it passed from 33% to 35%. However,
4 The technical documents linked to data files indicate that three quarters of the Canadian population were covered in 2006, a rate that increased to 95% in 2012. It is consequently important to use caution when interpreting estimates from the beginning of this period. Furthermore, these estimates are based on after-tax income, which makes any direct comparison with census data from 2001 impossible, as the latter does not include information on after-tax income.
this increase appears to be less pronounced than the increase observed in census data for the previous period.
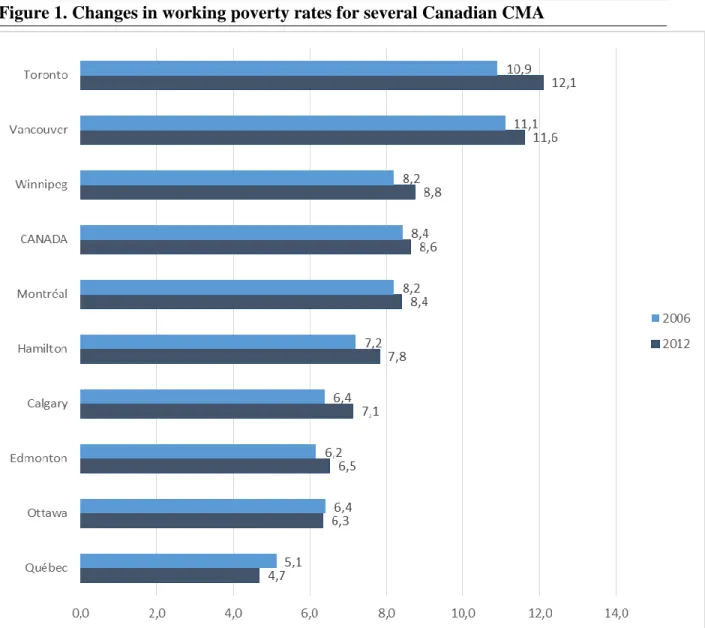
While the data for the second period is less reliable than that of the first, it suggests that Montreal was fairly resistant to the economic recession that lasted from 2007 to 2009, undoubtedly as a result of the increasing diversification of the city's economy. A such, Montreal comes in fourth place among the main metropolitan regions of Canada in terms of the percentage of working poor, and the growth of this population was modest compared to Toronto and Vancouver (see Figure 1).
As in the other two larger Canadian CMA, Toronto and Vancouver, the working poor population is distributed unevenly within the Montreal CMA, a question we will further examine later in this report.
Figure 1. Changes in working poverty rates for several Canadian CMA
Notes: the total population do not include students and only take into account people living on an autonomous
basis (see the method section for more details); all estimates are based on after-tax income for 2005 and 2011; Ottawa only covers the Ontario part of the Ottawa/Gatineau CMA; figure presents the data for the nine biggest CMA of the country.
Source: Canada Revenue Agency, T1FF file, Statistics Canada, special tabulation prepared for the NCRP.
Increasing income disparity between poor and non-poor workers
Incomes of the working poor have also evolved at the scale of the Montreal CMA.
In 2000 (income data collected from the census come from the preceding year), average annual individual income for the working poor was $14,165, while for non-poor workers it was $43,719.
In 2005, average income for the working poor (using constant 2000 dollars to account for inflation) had increased by 1.7% to $14,407, while non-poor average incomes increased by 5.7% to $45,629.
This data indicates that the gap widened between the working poor and non-poor workers, the income of the former increasing only modestly while those of the latter increased more substantially.
The disparity between these two groups has also increased when we examine household incomes. In 2005, annual average income before-tax for working poor households was $19,907 (using constant 2000 dollars), while this figure for non-poor working households was $82,106. If average incomes for individual workers in poverty were one third of those of non-poor workers, the ratio for households was one to four. This variation in inequality is due in part to the tendency for individuals to form couples within their own social stratum (even if situations where one partner earns a higher income and the other earns a lower, supplementary income also occur). The increase in the number of two income couples is one factor leading to higher income inequality5.
The census data from 2006 and the data for 2005 and 2011 from the Canada Revenue Agency allow us to distinguish between before-tax and after-tax income. It is worthwhile to take this information into account, as a tax and transfer structure can, to a certain extent, lead to a better distribution of incomes between high and low salaries.
However, comparison of income disparities between the working poor population and the non-poor working population, suggests a reverse effect. While before-tax incomes for individual workers in poverty are 32.4% of those of non-poor workers, this ratio decreases to 30.2% when we use after-tax incomes (the same two percent reduction occurs in the case of households, where the ratio passes from 24.3% to 22.2%).
Revenue Canada data for 2011 somewhat modifies this portrait. While the gap between average individual before-tax incomes for the working poor ($16,950, in current dollars) and non-poor workers ($61,310) continues to widen (the ratio between the former and the latter is 27.6%), it decreases when we take into consideration after-tax incomes. Average individual after-tax incomes for the working poor were $15,950, while those for non-poor workers were $48,630, a ratio of 32.8%. We can as such conclude that public policies, in large part fiscal policies and government transfers, dampened the effect of rising inequality for the period between 2005 and 2011.
5 This phenomenon was already observed in Montreal at the end of the 1990s (Rose and Villeneuve 1998).
Which social groups are most likely to belong to the working poor?
Clearly, the distribution of the working poor population among different social groups follows their distribution as a proportion of the total working population. As such, women and men make up equal part of the working poor. The non-immigrant population, the population not belonging to visible minorities and couples make up a large proportion. The demographic weight of these groups is unsurprisingly.
Consequently, it is more insightful to examine the rates of working poverty within each social group to identify if individuals belonging to these groups are more likely to be workers living in poverty. In other words, are people belonging to particular social groups more at risk of being in situations of working poverty.
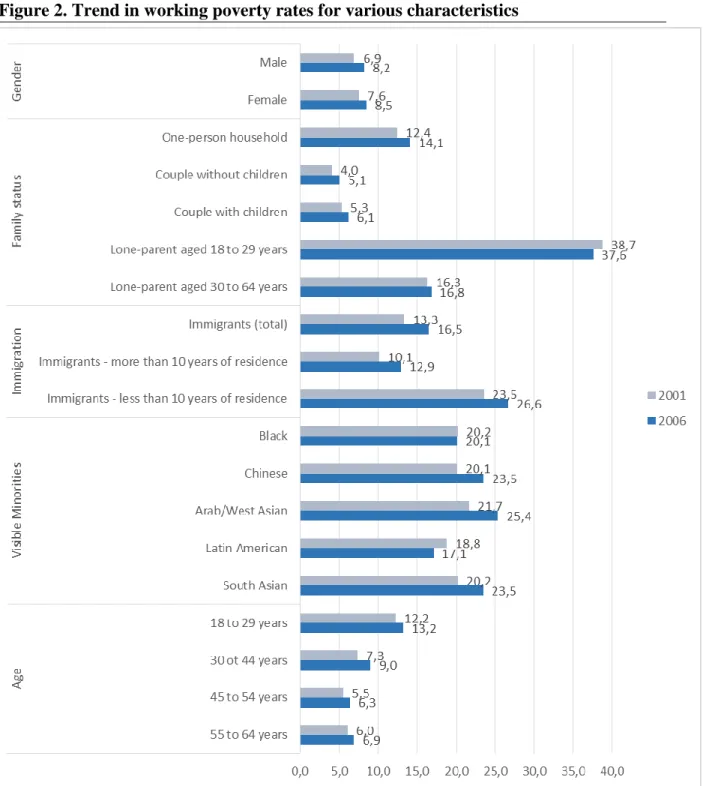
Figure 2 below presents the rate of working poverty for different socio-demographic categories at the scale of the Montreal CMA. The global rate of working poverty for the CMA was 7.2% in 2001 and 8.2% in 2006. The following findings can be drawn from this figure:
men and women have similar rates of working poverty for 2001 and 2006, but a stronger increase was observed for men;
single parents less than 30 years of age were the group most at risk of being in a situation of working poverty (37.6%), more than older single parents (16.8%) and people living alone (14.1%); couples, with or without children, had low rates (6% or less);
when we add up the different family situations with children, we see that more than half of workers in poverty had children in their care;
immigrants are another high risk group, especially recent immigrants, of which more than a quarter (26.6%) were workers in poverty in 2006; overall, it is worth noting that immigrants alone absorbed three quarters of the increase in working poverty between 2001 and 2006;
the same is true for visible minority groups, of which one in five individuals belonged to the working poor;
young workers are the most likely to be part of the working poor, but older workers showed the strongest increase in the rate of working poverty.
These observations show that working poverty affects first and foremost persons who, for a variety of reasons, have more difficulty accessing employment, whether this is as a result of their schedules (work-family balance for single parents), their life trajectories (difficulty getting recognition for credentials in the local labour market for immigrants) or personal characteristics (people dealing with prejudice or discrimination related to their ethnic origin or age).
The findings also show that working poverty increased between 2001 and 2006 for all of these categories, with a few exceptions. The working poor include, as such, a broad range of categories of workers, which suggests that working poverty is a generalised phenomenon and not specific to any one group.
Figure 2. Trend in working poverty rates for various characteristics
Notes: the total population do not include students and only take into account people living on an autonomous
basis (see the method section for more details); all estimates are based on before-tax income for 2000 and 2005.
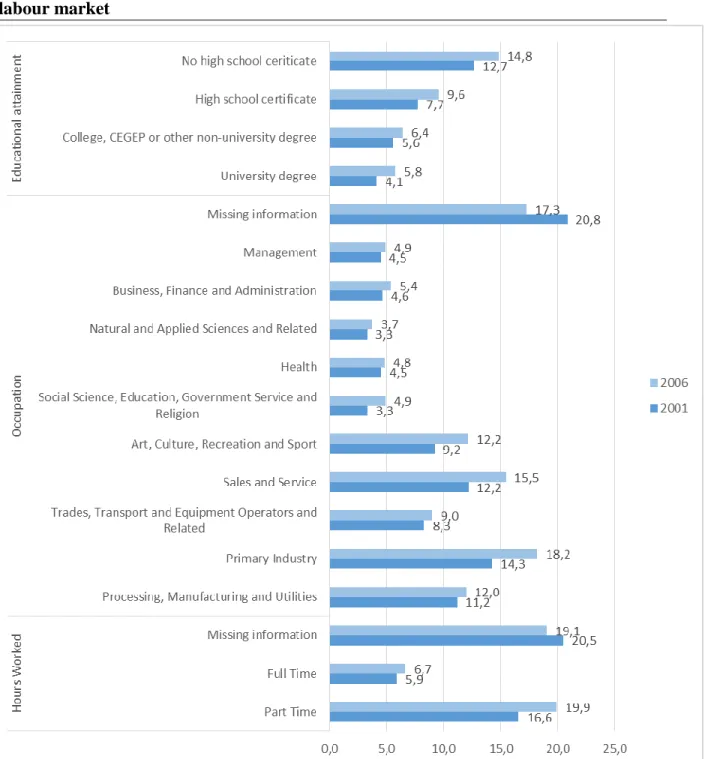
We can also divide rates of working poverty into different categories related to the labour market, as shown in figure 3 below. The figure shows certain trends.
Holding a school diploma reduced the risk of belonging to the working poor; the difference was especially significant between people who had attained a post-secondary qualification and those who had not; the rate of working poverty significantly increased for the different levels of education, except for those holding a post-secondary credential not from a university, while it is university graduates who showed the highest increase of working poverty.
Looking at the different occupations, individuals for whom this information was missing had the highest rates of working poverty—the same was true for time worked; the second sector most affected was the primary industry, followed by the sales and service sector6, and the art, culture, recreation and sport sector, with the processing, manufacturing and public utilities sector coming in fifth place.
All employment sectors had an increase in rates of working poverty, with the exception of individuals for whom this information was missing.
Lastly, part-time work was a risk factor for working poverty, as one in five individuals in this category had a low income job, compared to 7% for full-time workers.
These findings reinforce the notion that working poverty is a generalised phenomenon concerning a broad range of sectors of activity, including those presumed to offer high incomes (management, administration, finance, etc.). They also underscore a certain degradation of working conditions in the oldest sectors of the economy, like industrial sectors. Changes in world trade, increasingly deregulated, expose these sectors to increased competition, which contributes to the elimination of jobs as well as increases in working poverty. This is what occurred in Montreal between 2001 and 2006, when duties applied to the textile and clothing industries (the largest industrial sector in the urban area in terms of number of jobs) were removed. Finally, not having access to sufficient working hours increased the likelihood of workers living in poverty. The creation of full-time, high quality jobs is, as such, a crucial issue, if we are to reverse the observed trend of a broad increase in poorly paid work in the labour market.
6 It is worth noting that because of its significant weight in the employment structure of the Montreal CMA, this sector alone accounts for one third of low-income work. The same phenomenon was observed in Toronto (Stapleton, Murphy and Xing 2012).
Figure 3. Trend in working poverty rates for various characteristics linked to the labour market
Notes: the total population do not include students and only take into account people living on an autonomous
basis (see the method section for more details); all estimates are based on before-tax income for 2000 and 2005.
Working poverty: an uneven spatial distribution in the Montreal
CMA
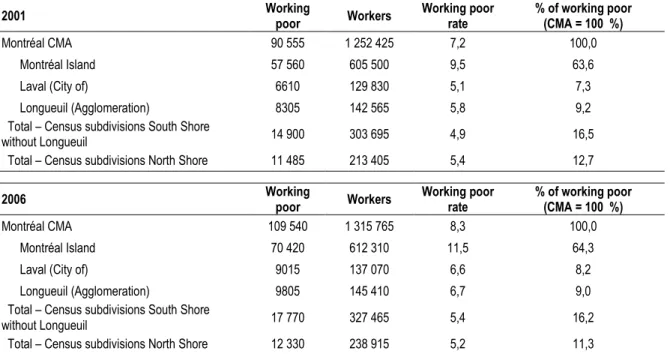
Working poverty is not equally distributed in the Montreal CMA. As shown in Table 3, 64% of the region's working poor live on the Island of Montreal, where the rate of working poverty is also the highest, 9.5% in 2001 and 11.5% in 2006. The two other spaces where the rate of working poverty are higher are Laval and the agglomeration of Longueuil, followed by the North and South Shores.
Table 3. Spatial distribution of working poor and workers across the main areas of the Montréal CMA
2001 Working poor Workers Working poor rate % of working poor (CMA = 100 %) Montréal CMA 90 555 1 252 425 7,2 100,0 Montréal Island 57 560 605 500 9,5 63,6 Laval (City of) 6610 129 830 5,1 7,3 Longueuil (Agglomeration) 8305 142 565 5,8 9,2 Total – Census subdivisions South Shore
without Longueuil 14 900 303 695 4,9 16,5 Total – Census subdivisions North Shore 11 485 213 405 5,4 12,7
2006 Working poor Workers Working poor rate % of working poor (CMA = 100 %) Montréal CMA 109 540 1 315 765 8,3 100,0 Montréal Island 70 420 612 310 11,5 64,3 Laval (City of) 9015 137 070 6,6 8,2 Longueuil (Agglomeration) 9805 145 410 6,7 9,0 Total – Census subdivisions South Shore
without Longueuil 17 770 327 465 5,4 16,2 Total – Census subdivisions North Shore 12 330 238 915 5,2 11,3
Notes: the total population do not include students and only take into account people living on an autonomous
basis (see the method section for more details); all estimates are based on before-tax income for 2000 and 2005.
Source: Statistics Canada, Censuses of Canada, 2001 and 2006, special tabulation prepared for the NCRP.
On the Island of Montreal, the distribution of working poverty is also uneven among different municipalities. 60% of the CMA's working poverty and 94% of that of the Island is concentrated in the City of Montreal.
This uneven distribution can be explained in part by the socio-demographic profile of the different geographical entities that make up the CMA. The groups most affected by working poverty are overrepresented in the central city. This is the case for immigrants, members of visible minorities, people living alone, single parent families, and people aged 18 to 30. This distribution also reflects the different types of work and the industrial fabric of each area. The Island of Montreal contains a relatively large concentration of the industries that require the largest workforces, such as the clothing and textile sectors centred in Chabanel-Marché-Central or the food and drink sectors in the East of the Island. The same is true for
primary sectors such as refineries, also concentrated in the East. On the other hand, several high-tech employment areas have developed more in the suburbs, around industrial parks planned and designed to attract them (the results of this planning have not always lived up to expectations). Other example of this include the pharmaceutical and bio-technology industries in Laval or the aeronautic industry on the South Shore (aircraft engine manufacturing) and the North Shore (Bell Helicopter, for instance).
Meanwhile, other sectors of activity are more spatially dispersed, such as sales and services, which make up one third of the working poor in the CMA. This category can be found in all of the major areas of the CMA, from the North Shore to the South Shore, in part because of the development of shopping malls and major shopping centres (often called power centres) in the suburbs (the Dix/Trente, for example) or on the Island (the Marché central or the Galeries d'Anjou).
Lastly, retail and other services like restaurants are also present in great numbers in the downtown core. It is there that we find jobs considered higher order services, with individual or business clients, such as banks, large hospitals or legal services. Downtown appears to be a space of contrasts as there is a concentration of both highly qualified and considerably less qualified jobs. The second category is not only composed of poorly qualified workers occupying precarious and poorly paid jobs in the service industry (fast food workers, for example), but also of immigrant university graduates who are overqualified, and of individuals with post-secondary degrees related to occupations in the social sciences, education, government service and religion. We have already seen how these groups have seen increases in the number of working poor7.
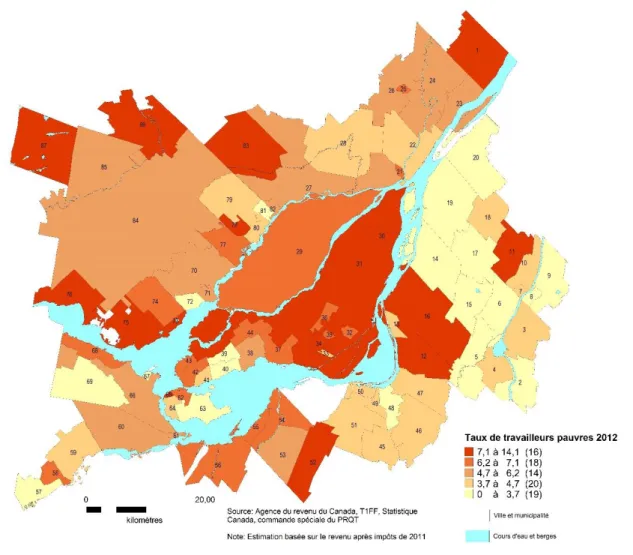
To illustrate this uneven spatial distribution, Figure 4 presents a map of the rate of working poverty for the cities and municipalities of the CMA in 2012. These estimates were made using data files from the Canada Revenue Agency on the basis of income tax returns. They use income figures from 2011. According to this data, the total working poor population was 125 820, while the total working population was 1 497 4108.
The map is followed by a table that presents the working and working poor populations of each city or municipality. These numbers are of interest because they provide a sense of the volume of workers living in poverty in each territory. The first column of the table provides an identification number allowing the reader to locate each city or municipality on the map.
7 The unabridged version of this report provides more details on the different trajectories leading to working poverty.
8 It is important to remember that these numbers are estimates. They should be interpreted as giving a sense of the population size, rather than an exact count.
Figure 4. Working poverty rates for the Montréal CMA in 2012 – Cities and Municipalities
Tableau 4. List of Cities and Municipalities within the Montréal CMA: Working poor, Workers (total), and Working poverty rate – 2012
Nr Name Working poor Workers Working poverty rate
1 Lavaltrie 440 5920 7,4 2 Richelieu 80 2170 3,7 3 Saint-Mathias-sur-Richelieu 90 1950 4,6 4 Chambly 530 12700 4,2 5 Carignan 120 3670 3,3 6 Saint-Basile-le-Grand 220 7730 2,8 7 McMasterville 110 2490 4,4 8 Otterburn Park 130 3750 3,5 9 Mont-Saint-Hilaire 260 7750 3,4 10 Beloeil 400 9810 4,1 11 Saint-Mathieu-de-Beloeil 60 750 8,0 12 Brossard 2500 31040 8,1 13 Saint-Lambert 350 7500 4,7 14 Boucherville 470 16660 2,8 15 Saint-Bruno-de-Montarville 300 10050 3,0
16 Longueuil 6960 92790 7,5 17 Sainte-Julie 340 13230 2,6 18 Saint-Amable 210 5320 3,9 19 Varennes 290 9670 3,0 20 Verchères 90 2480 3,6 21 Charlemagne 160 2490 6,4 22 Repentigny 1570 35600 4,4 23 Saint-Sulpice 90 1610 5,6 24 L'Assomption 520 9350 5,6 25 L'épiphanie 150 2230 6,7 26 L'épiphanie 80 1410 5,7 27 Terrebonne 2350 48460 4,8 28 Mascouche 910 20220 4,5 29 Laval 11300 161440 7,0 30 Montréal-Est 140 1490 9,4 31 Montréal 73070 591540 12,4 32 Westmount 420 5940 7,1 33 Montréal-Ouest 80 1870 4,3 34 Côte-Saint-Luc 1130 9090 12,4 35 Hampstead 160 2360 6,8 36 Mont-Royal 460 6740 6,8 37 Dorval 500 7170 7,0 38 Pointe-Claire 630 11140 5,7 39 Kirkland 290 7990 3,6 40 Beaconsfield 240 6910 3,5 41 Baie-D'Urfé 50 1110 4,5 42 Sainte-Anne-de-Bellevue 130 1900 6,8 43 Senneville 20 310 6,5 44 Dollard-Des Ormeaux 1240 17630 7,0 45 Saint-Mathieu 40 950 4,2 46 Saint-Philippe 110 2700 4,1 47 La Prairie 450 10340 4,4 48 Candiac 260 9130 2,8 49 Delson 150 3420 4,4 50 Sainte-Catherine 340 7830 4,3 51 Saint-Constant 550 11800 4,7 52 Saint-Isidore 150 1210 12,4 53 Mercier 290 5470 5,3 54 Châteauguay 1160 18030 6,4 55 Léry 60 920 6,5 56 Beauharnois 350 4970 7,0 57 Saint-Zotique 110 3170 3,5 58 Les Coteaux 150 2240 6,7 59 Coteau-du-Lac 140 3040 4,6 60 Les Cèdres 160 3080 5,2 61 Pointe-des-Cascades 30 580 5,2 62 L'île-Perrot 280 4300 6,5 63 Notre-Dame-de-l'île-Perrot 150 4730 3,2 64 Pincourt 270 6250 4,3 65 Terrasse-Vaudreuil 60 830 7,2 66 Vaudreuil-Dorion 810 16480 4,9 67 Vaudreuil-sur-le-Lac 0 0 0,0 68 Hudson 110 1740 6,3 69 Saint-Lazare 310 8500 3,6 70 Saint-Eustache 1110 18490 6,0
71 Deux-Montagnes 420 7560 5,6 72 Sainte-Marthe-sur-le-Lac 230 7630 3,0 73 Pointe-Calumet 210 2800 7,5 74 Saint-Joseph-du-Lac 190 2920 6,5 75 Oka 240 1710 14,0 76 Saint-Placide 50 660 7,6 77 Boisbriand 760 11890 6,4 78 Sainte-Thérèse 870 10080 8,6 79 Blainville 920 23760 3,9 80 Rosemère 250 5690 4,4 81 Lorraine 100 3810 2,6 82 Bois-des-Filion 260 4220 6,2 83 Sainte-Anne-des-Plaines 440 5850 7,5 84 Mirabel 1130 20760 5,4 85 Saint-Colomban 340 6810 5,0 86 Saint-Jérôme 2130 27030 7,9 87 Gore 50 550 9,1
Notes: the total population do not include students and only take into account people living on an autonomous
basis (see the method section for more details); all estimates are based on after-tax income for 2011.
Working poverty at the neighborhood scale: significant variation at
the intra-urban level
If the working poor are unevenly distributed at the scale of cities and municipalities, they are even more so at the neighborhood scale.
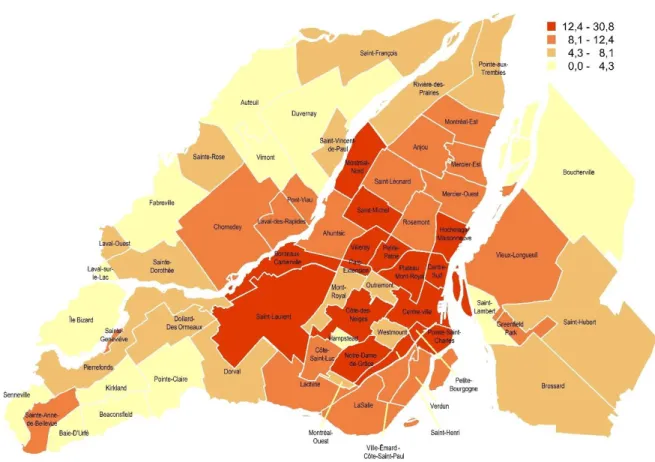
To illustrate this situation, Figure 5 presents the rate of working poverty at the scale of sociological neighborhoods on the Island of Montreal, Laval and the agglomeration of Longueuil. The data comes from the 2006 census. This was preferred to 2012 data because of its superior reliability at this scale. The boundaries of the sociological neighborhoods were determined by Centraide of Greater Montreal, the main partner in this research, in order to plan its activities. These areas serve as the territories for Neighborhood round tables and are based on local demographics and the community and public activities that take place in the areas.
Figure 5. Working poverty rate by neighbourhood in 2006 – Montréal Island, Laval and Longueuil
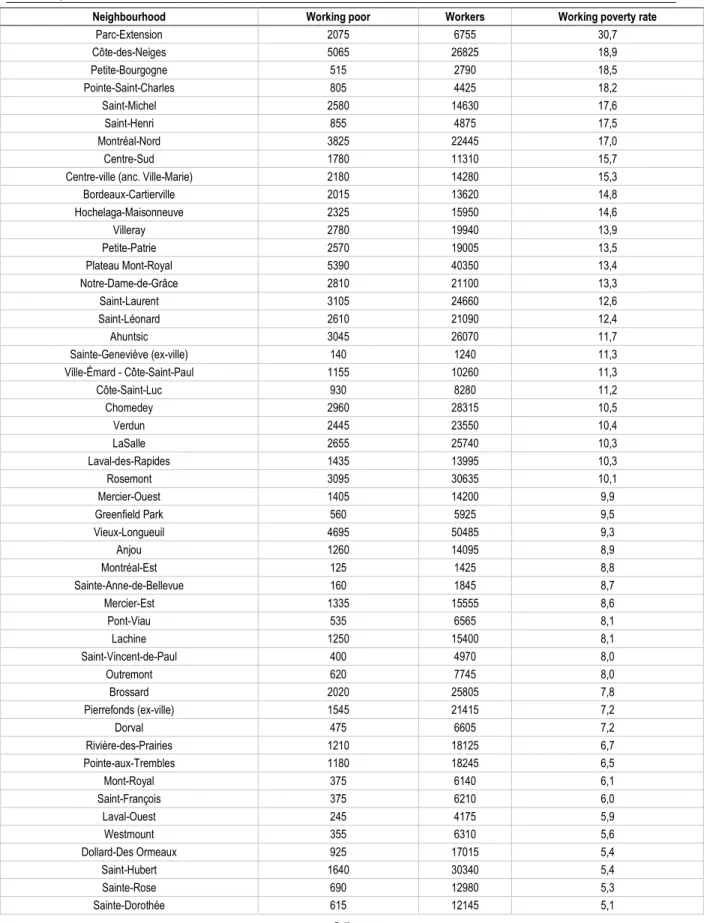
Table 5. List of neighbourhood in 2006 – Working Poor, Workers, and Working Poverty Rate
Neighbourhood Working poor Workers Working poverty rate
Parc-Extension 2075 6755 30,7 Côte-des-Neiges 5065 26825 18,9 Petite-Bourgogne 515 2790 18,5 Pointe-Saint-Charles 805 4425 18,2 Saint-Michel 2580 14630 17,6 Saint-Henri 855 4875 17,5 Montréal-Nord 3825 22445 17,0 Centre-Sud 1780 11310 15,7
Centre-ville (anc. Ville-Marie) 2180 14280 15,3
Bordeaux-Cartierville 2015 13620 14,8 Hochelaga-Maisonneuve 2325 15950 14,6 Villeray 2780 19940 13,9 Petite-Patrie 2570 19005 13,5 Plateau Mont-Royal 5390 40350 13,4 Notre-Dame-de-Grâce 2810 21100 13,3 Saint-Laurent 3105 24660 12,6 Saint-Léonard 2610 21090 12,4 Ahuntsic 3045 26070 11,7 Sainte-Geneviève (ex-ville) 140 1240 11,3 Ville-Émard - Côte-Saint-Paul 1155 10260 11,3 Côte-Saint-Luc 930 8280 11,2 Chomedey 2960 28315 10,5 Verdun 2445 23550 10,4 LaSalle 2655 25740 10,3 Laval-des-Rapides 1435 13995 10,3 Rosemont 3095 30635 10,1 Mercier-Ouest 1405 14200 9,9 Greenfield Park 560 5925 9,5 Vieux-Longueuil 4695 50485 9,3 Anjou 1260 14095 8,9 Montréal-Est 125 1425 8,8 Sainte-Anne-de-Bellevue 160 1845 8,7 Mercier-Est 1335 15555 8,6 Pont-Viau 535 6565 8,1 Lachine 1250 15400 8,1 Saint-Vincent-de-Paul 400 4970 8,0 Outremont 620 7745 8,0 Brossard 2020 25805 7,8 Pierrefonds (ex-ville) 1545 21415 7,2 Dorval 475 6605 7,2 Rivière-des-Prairies 1210 18125 6,7 Pointe-aux-Trembles 1180 18245 6,5 Mont-Royal 375 6140 6,1 Saint-François 375 6210 6,0 Laval-Ouest 245 4175 5,9 Westmount 355 6310 5,6 Dollard-Des Ormeaux 925 17015 5,4 Saint-Hubert 1640 30340 5,4 Sainte-Rose 690 12980 5,3 Sainte-Dorothée 615 12145 5,1
Montréal-Ouest 90 2020 4,5 Hampstead 105 2455 4,3 Auteuil 500 11705 4,3 Saint-Lambert 325 7665 4,2 Pointe-Claire 450 10630 4,2 Vimont 395 10435 3,8
Ile Bizard (ex-ville) 205 5655 3,6
Fabreville 590 17135 3,4 Kirkland 260 7565 3,4 Duvernay 265 7780 3,4 Beaconsfield 180 6715 2,7 Iles-Laval 10 385 2,6 Baie-D'Urfé 30 1185 2,5 Boucherville 295 15950 1,8 Senneville 0 345 0,0 Laval-sur-le-Lac 0 275 0,0
Notes: the total population do not include students and only take into account people living on an autonomous
basis (see the method section for more details); all estimates are based on before-tax income for 2005.
Source: Statistics Canada, Census of Canada 2006, special tabulation prepared for the NCRP.
The map shows that the rate of working poverty varies substantially from one neighborhood to the next, which is also shown in Table 5. For each neighborhood, the table shows the total number of working poor, the total working population and the rate of working poverty. Lastly, the neighborhoods are sorted by this third measure in descending order.
Parc-Extension is the neighborhood with the highest rate of working poverty in the CMA, at 30%. It is part of a group of neighborhoods characterised by poverty and large under-privileged populations. This group includes, among others, Côte-des-Neiges, Downtown, the Centre-Sud and Hochelaga-Maisonneuve, Saint-Michel and Montreal North and finally, Bordeaux-Cartierville and Saint-Laurent. It is important to note that working poverty is also present in central neighborhoods and suburbs which are a priori not associated with poverty, such as the Plateau-Mont-Royal, Petite-Patrie, Villeray, LaSalle or Vieux-Longueuil. We will discuss this spreading of working poverty shortly.
This geography of working poverty closely follows that of more general poverty and it is not difficult to attribute it to other determining factors, such as large populations of immigrants, visible minorities, single parents, people with low levels of education or people living alone. Analysis presented in the unabridged version of this report allows us to confirm these interpretations and identify single parenthood and immigration as the two main factors associated with spatial concentrations of working poverty.
These findings merit consideration. They show that under-privileged neighborhoods are not only populated by unemployed people living in poverty, but also increasingly by the working poor. As such, the correlation between rates of working poverty and total poverty is close to 95% for both 2006 and 2012, a very high spatial correlation for two phenomena (this rate was calculated at the level of census tracts, a smaller scale than that of the map). The correlation is around 85% when we use the rate of working poverty and the rate of non-working poverty as variables. This strong association shows that the non-working poor not only
have to deal with the growing casualization of the labour market, but also live in neighborhoods where the social milieu, housing conditions and services can be of lower quality as a result of the concentration of under-privileged and poor populations. The consequences of working poverty are thus also collective by the constraints put on residential choices and the spatial concentration of poverty produced, with a growing concern for the negative effects this last process might trigger. To put it simply, working poverty contributes significantly to the creation and reinforcement of socio-spatial inequalities; it creates costs for all of society in that it maintains a large part of the population in difficult living and housing conditions, which has further effects on that population's health and social and psychological well-being.
If the geography of working poverty appears to be relatively stable over time, certain changes have nonetheless occurred in its spatial distribution. These changes can be linked to the progressive appearance of a kind of working poverty strongly affecting university graduates in a range of intellectual occupations, such as the social sciences, education, government service or the arts, culture, sport and recreation. The rate of working poverty has also tended to increase in the socially mixed spaces of the central city, such as the Plateau-Mont-Royal, the areas around the University of Montreal in Côte-des-Neiges, and the downtown areas surrounding McGill and Concordia Universities. These spaces of working poverty also extend to areas adjacent to them. This is the case in Rosemont and Petite-Patrie, close to the Plateau-Mont-Royal. A space of precarious and poorly remunerated intellectual work has developed that is not unrelated to a broad range of young professionals, university graduates and employees in various service sectors, including public and community service. This group also includes individuals who combine multiple professional activities, often on a self-employed basis. This particular trend of working poverty may well grow in years to come and it will be important to pay close attention to its effects on social and residential situations in central neighborhoods.
The other process spreading working poverty concerns neighborhoods like LaSalle or Saint-Léonard, which have seen rates of working poverty increase with the arrival of new waves of immigration. These two areas and others undergoing similar changes are faced with increased social polarization and declining average household incomes.
Factors explaining the growth of working poverty
The transition to a Post-Fordist regime of accumulation
It would be difficult to explain the increases in working poverty without considering global transformations that capitalist economies have experienced since the mid-1970s. These transformations have been described by a group of heterodox economists as the passage of a Fordist system of accumulation to a post-Fordist regime (Boyer 2000).
This interpretation largely rests on the notion that a stable world economic system was put in place in the immediate post-war period. This system relied on an industrial complex able to generate gains in productivity and a range of international agreements that guarantied stability and growth of the world economy (the most important of which were the Bretton Woods accords signed in 1944 to put in place a new international monetary system). The Fordist system also relied on a sharing of growth between labour and capital that aimed to encourage demand for mass consumer goods. This objective was attained by paying stable salaries that increased with gains in productivity. Lastly, the system relied on an industrial base able to produce standardised goods in large quantities. The various actors involved in this base, management, organisations representing workers came to professional agreements to determine working conditions and wages.
Over the course of the 1970s, this system began to encounter problems as a result of various crises. Rising oil and energy prices eroded its industrial base. The end of the international monetary system shifted the balance of trade. The new appetite of consumers for personalized and more varied goods also called into question the standardised production model. As a result, a new model of accumulation progressively appears that has been called Post-Fordist, based more strongly on innovation, new technologies, flexibility in the organisation of the production of goods and services, and placing more importance on finance. The effects of this transition are many. Gains in production have tended to decrease between the 1970s and today, along with the capacity of industries and companies to guarantee growing incomes for households, and the decreased relative influence of organised labour.
A precarious and flexible labour market
One of the other major effects of the transition from the Fordist to the Post-Fordist regime of accumulation was a profound transformation of the labour market.
While the labour market was relatively stable in the Fordist system, offering quality jobs and incomes to workers, it has become much more precarious and flexible. The first indicator of this transformation was the entry of many countries into a long period of structural or endemic unemployment, which would exacerbate pressures on individuals to find work regardless of the conditions offered by employers9.
9 Until the 1970s, observed unemployment rates were low and indicated a job market where full employment was attained (unemployment rates were described as frictional, mostly
A second indication of this transformation is the appearance of a variety of management and human resources techniques designed to increase the flexibility of the workforce and reduce costs. "Just-in-time" and "zero stock" management, the growing reliance on temporary employees or employees hired by placement agencies, as well as on sub-contracting and off-shoring of certain activities increased pressures on workers. These new management strategies changed the structure of labour organisations, which became more scattered and spatially dispersed (Veltz 2002, 2000; Linhart and Linhart 1995). Different groups of workers had more difficulty voicing their grievances and having their rights respected as they were more spatially dispersed and divided into different employment statuses. This situation favoured neither collective organisation of labour, nor the development of solidary around common interests (Beaud 2002).
A final element characterising these transformations in the labour market is the multiplication of precarious jobs, in other words temporary contracts, on-call or commission-based positions, lower wages, fewer or no benefits and little to no opportunity for advancement in company hierarchies. Quebec has been particularly affected by the appearance and multiplication of precarious jobs in the past few decades. According to different definitions of this type of employment, the proportion of these jobs in the workforce is as high as one third, a situation that presents considerable challenges for the social security of workers and their capacity to escape dependence on odd jobs taken out of necessary rather than choice (Yerochewski 2014; Bernier 2013; Bernier, Vallée and Jobin 2003).
Insufficient employment income
Looking at the various statistics cited in this report, it is obvious that the main cause of working poverty is insufficient employment income. This insufficiency can however have several causes.
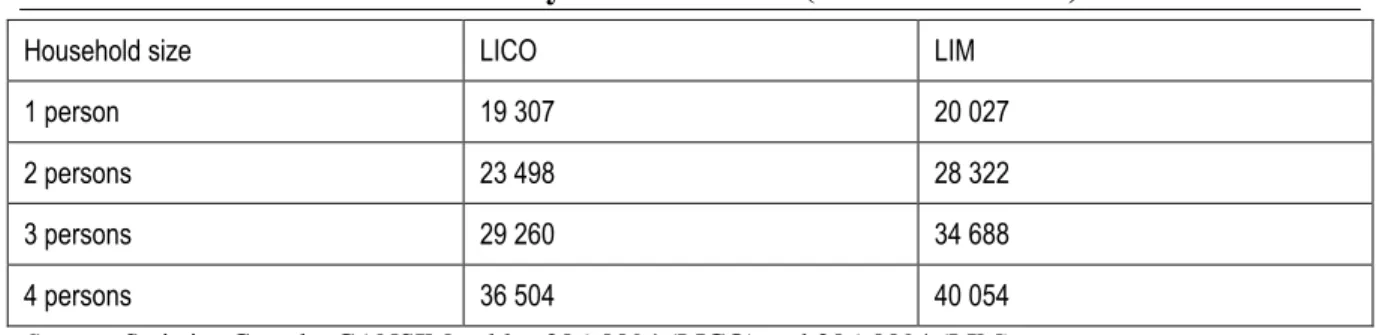
The first cause is a lack of work, where individuals are unable to find enough hours to make enough income to escape poverty. This phenomenon explains without a doubt the prevalence of working poverty among people who do not have a full-time job. It is also related to the increased number of workers that provide insufficient information about how many hours they work. The "missing information" category not only increased between 2001 and 2006, but this group had a high percentage of working poor. This trend is undoubtedly related to the difficulty for workers in precarious situations to precisely state the number of hours they work. However, it is important not to overestimate the effect of time worked on working poverty, as 70% of workers in poverty have full-time employment. The second cause of insufficient income is the hourly rate of pay of individuals. One way to measure the disparity between incomes and the various measures of poverty and low income is to compare the LIM and LICO with the average income of workers in poverty. We have chosen 2011 as a reference year and after-tax incomes for this measure. Table 6 related to changes in employment and the entry of young people into the job market). After the 1970s, unemployment rates were too high to be described as frictional, and indicated a chronic lack of jobs to meet the employment needs of households.
below shows the cut-offs for both measures of poverty according to the size of households.
Table 6. LICO and LIM in 2011 by household size (after-tax income)
Household size LICO LIM
1 person 19 307 20 027
2 persons 23 498 28 322
3 persons 29 260 34 688
4 persons 36 504 40 054
Source: Satistics Canada, CANSIM, tables 206-0094 (LICO) and 206-0094 (LIM).
As noted previously, the average income for individuals in working poverty for 2011 was $15,460 (after-tax), far below the cut-offs in the previous table for one person households. The cut-offs for census families with at least one person in working poverty, all household sizes combined, was $17,920 (also after-tax), also far below the cut-offs for households with two persons or more. As we can see, the disparity between average incomes of workers in poverty and the cut-offs of the measures of low income most commonly used by Statistics Canada are significant (it makes sense that the incomes of the working poor are lower than the LIM, considering the way we define working poverty, but this is not the case for the LICO, which is lower than the LIM and based on an older and more conservative estimate of poverty). This suggests that the only means that individuals and households in situations of working poverty have to get out of poverty is to make more money on average per hour worked.
Simply put, incomes for the working poor appear to be insufficient. A good indication of this is the fact that the minimum hourly income in 2011 was $9.65, which would mean that a person working full time for the entire year could expect to make a before-tax annual income of $19,454 (based on a 40-hour work week and 252 working days). Once taxes are deducted, it is clear that this income alone is not sufficient to escape poverty.
The best strategy to reduce the disparity between this level of income and the measures of poverty identified above is without a doubt fiscal policy favoring low and middle income workers. However, we have seen that Canada's fiscal policy already partly fulfills this need. The authors of the reports on working poverty in Vancouver and Toronto came to the same conclusion after considering the measures taken by the federal and provincial governments to assist low income workers (Ivanova 2016; Stapleton, Murphy and Xing 2012). In other words, the various levels of government have limited leeway, even if additional effort is possible to change fiscal policy so that it can be more advantageous for low income households. The solution is therefore for the most part a better distribution of employer profits between capital and labour. This better distribution will involve a higher minimum wage and higher quality job offers, in a context when companies have seen their tax burden lightened under the Conservative government's legislation. This last point is certainly worth considering in future reflections on the organisation of the working world and on the potential means to eradicate poverty and reduce inequalities.
Conclusion
Working poverty has increased between 2001 and 2012. The first half of this period was marked by a significant increase, with an average annual growth rate of 3.9% between 2001 and 2006, while the second period saw a slowing of this growth rate, at an average of 1.5% per year. Over the entire period, working poverty increased by around a third (approximately 30%). During the same period, employment grew by an average of a little less than one percent annually. This difference in the growth rate of working poverty and employment is all the more surprising in that the first half of the decade coincides with sustained economic growth, while the second, with a major recession (2008). In total, the presence of working poverty in the working population has continued to grow, as the working poor were 7.2% of workers at the beginning of the period and 8.4% at the end. Working poverty is, as such, a major characteristic of labour market and economy of Montreal, even though it is proportionally less present than in Toronto and Vancouver, the other two major cities in Canada. The fact that working poverty has increased in the Montreal CMA suggests that the economic restructuring that has been experienced there has had effects on individuals and households, which have had increased difficulty finding well-paid, quality jobs.
The data presented here also shows that the difference between the incomes of the working poor and non-poor workers has increased over time. This trend explains in part how high levels of inequality have continued to exist in the Montreal CMA. That working poverty is a relatively major phenomenon in a context where incomes are, on average, lower than in other regions of the country paints the portrait of an economy that relies at least in part on low wages. Any explanation of household and socio-spatial inequalities would be incomplete without taking into consideration what occurs at the bottom of the social ladder, where a large proportion of people in poverty hold a job (38%), as we have seen above. Consequently, Montreal's economic situation at least in part relies on the availability of a flexible workforce, prepared to work for lower incomes. As we have seen, immigrants, especially those who arrived in Canada less than 10 years ago, members of visible minorities, single parents, and young people have rates of working poverty above the regional average. These groups seem to play this role in the labour market, but they are not alone. As a trend, increases in working poverty affect all social groups, becoming a generalised phenomenon extending to groups that are a priori less vulnerable in the labour market. This is the case for university graduates, among whom the number of working poor increased by 75% between 2001 and 2006. Employees of particular sectors of service jobs, such as work in the social sciences, education, government service and religion are other affected groups, among which the rate of working poverty has doubled over the same period. Even fields that are generally assumed to provide higher wages, like management or applied sciences, have seen a higher rate in the increase of working poverty than of total employment.
The final element discussed in this study concerns the spatial distribution of working poverty in the Montreal region. Clearly, the phenomenon is unevenly distributed in space, whether we look at larger geographical areas, cities and municipalities, or neighborhoods.
As such, the Island of Montreal and the City of Montreal contain a large proportion of the working poor in the CMA, and the neighborhoods that are most affected are those generally associated with the geography of poverty. These neighborhoods are characterised by an overrepresentation of a number of social groups more at risk of working poverty. They also contain larger populations with of non-working poor and are therefore high priority areas for social development efforts, and measures to assist integration into the labour market. At the same time, recent changes in working poverty have meant that the phenomenon has spread to other areas. A number of central neighborhoods were more affected by working poverty in 2012 than in 2001, including socially mixed areas marked by gentrification (the Plateau-Mont-Royal, parts of the South-West and downtown, for example). In this first group, certain people who are vulnerable in the labour market are post-secondary graduates, but in disciplines that put them at risk on the labour market. Another group of neighborhoods is comprised of areas that are experiencing relative decline, resulting from recently immigrated populations as well as the aging of older immigrant and non-immigrant populations (Saint-Léonard or LaSalle, for example). In the second group of neighborhoods, we have observed a polarisation of incomes and decreases in average available incomes. This study demonstrates the importance of considering the reality of people in situations of working poverty when developing public policy and community efforts, as a result of increases in this population and its relative spatial concentration.
Works Cited
Beaud, Stéphane. 2002. 80% au bac... et après? Les enfants de la démocratisation scolaire. Paris: La Découverte.
Bernier, Jean. 2013. « Les conventions collectives et les emplois atypiques. » Regards sur le
travail 4 (1): 2-17.
Bernier, Jean, Guylaine Vallée and Carole Jobin. 2003. Les besoins de protection sociale
des personnes en situation de travail non traditionnelle. Québec: Gouvernement du
Québec.
Boyer, Robert. 2000. « The Political in the Era of Globalization and Finance: Focus on Some Regulation School Research. » International Journal of Urban and Regional
Research 24 (2): 274-322.
Dubé, Jean and Mario Polèse. 2015. « Resilience Revisited: Assessing the Impact of the 2007–09 Recession on 83 Canadian Regions with Accompanying Thoughts on an Elusive Concept. » Regional Studies 50 (4): 615-628.
ILO. 2016. WORLD EMPLOYMENT SOCIAL OUTLOOK 2016 Transforming jobs to end
poverty. Geneva: International Labour Organization.
Ivanova, Iglika. 2016. Working Poverty in Metro Vancouver. Vancouver: CCPA - Canadian Center for Policy Alternatives.
Linhart, Danièle and Robert Linhart. 1995. « Les ambiguités de la modernisation. Le cas du juste-à-temps. » Réseaux (69): 45-69.
Osberg, Lars. 2001. « Poverty among Senior Citizens: A Canadian Success Story. » In The
State of Economics in Canada: Festschrift in Honour of David Slater, sous la dir. de
Patrick Grady et Andrew Sharpe, 151-180. Ottawa: Center for the Study of Living Standards and John Deutsch Institute.
Polèse, Mario. 2009. Montréal économique : de 1930 à nos jours. Récit d'une transition
inachevée. Montréal: Inédits, INRS-UCS.
Rose, Damaris and Amy Twigge-Molecey. 2013. Une métropole à trois vitesses? Bilan sur
les écarts de revenu dans le Grand Montréal, 1970-2005. Toronto: Cities Center,
Rose, Damaris and Paul Villeneuve. 1998. « Engendering Class in the Metropolitan City: Occupational Pairings and Income Disparities among Two-Earner Couples. » Urban
Geography 19 (2): 123-159.
Shillington, Richard. 2016. An Analysis of the Economic Circumstances of Canadian
Seniors. Ottawa: Broadbent Institute.
Stapleton, John, Brian Murphy and Yue Xing. 2012. The "Working Poor" in the Toronto
Region: Who they are, where they live, and how trends are changing. Toronto:
Metcalf Foundation.
Ulysse, Pierre-Joseph. 2006. Travail et pauvreté : quand le travail n'empêche plus d'être
pauvre!: Forum de développement social de l'île de Montréal.
Veltz, Pierre. 2000. Le nouveau monde industriel. Paris: Gallimard.
———. 2002. Des lieux et des liens. Politiques du territoire à l'heure de la mondialisation. La Tour d'Aigues: Editions de l'Aube.
Walks, Alan. 2013. Income Inequality and Polarization in Canada’s Cities: An
Examination and New Form of Measurement. Toronto: Cities Centre, University of
Toronto.
Yerochewski, Carole. 2014. Quand travailler enferme dans la pauvreté et la précarité. Québec: Presses de l'Université du Québec.