doi:10.1006/mpev.2000.0849, available online at http://www.idealibrary.com on IDE~L@
.
The Bushlike Radiation of Muroid Rodents Is Exemplified by the
Molecular Phylogeny of the LCAT Nuclear Gene
Johan Michaux and François Catzeflis
Laboratoire de Paléontologie, Institut des Sciences de l'Evolution, UMR 5554 CNRS,
Université de Montpellier 2, 34095 Montpellier, France Received January 11, 2000; revised July 26, 2000
Phylogenetic relationships among 40 extant species of rodents, with an emphasis on the taxonomic sam-pling of Muridae and Dipodidae, were studied using sequences of the nuclear protein-coding gene LCAT (lecithin cholesterol acyl transferase). Analysis of 804 bp from the exonic regions of LCAT confirmed many traditional groupings in and around Muridae. A strong support was found for the families Muridae (represented by 29 species) and Dipodidae (5 species). Compared with Sciuridae, Gliridae, and Caviomor-pha, the Dipodidae family appeared the closest rela-tive of Muridae, confirming the suprafamilial Myo-donta concept. Within the speciose family Muridae, the first branching leads to the fossorial Spalacinae and semifossorial Rhyzomyinae. The remaining com-ponents of Muridae appear as a polytomy from which are issued Sigmodontinae, Calomyscinae, Arvicolinae, Cricetinae, Mystromyinae, Nesomyinae, and some Dendromurinae (Steatomys and Dendromus). This phylogeny is interpreted as the result of a bushlike radiation at the end of the early Miocene, leading to emergence of most living subfamilies. The separation between three additional taxa, Murinae, Gerbillinae, and "Acomyinae" (which comprises the genera Aco-mys, DeoAco-mys, UranoAco-mys, and Lophuromys), has oc-curred more recently from a common ancestor issued from the main basal radiation. As previously shown by other molecular studies, the vlei rats, Otomyinae, are nested within Old World Murinae. ln the same way, the zokors, Myospalacinae, appear strongly nested within the hamsters, Cricetinae. Finally, we propose a sister group relationship between Malagasy Nesomyi-nae and south African MystromyiNesomyi-nae. @2000Academic Press
Key Words: phylogeny; Muridae; Myodonta; radia-tion; LCAT.
least 1326 species spanning more than 281 genera (Musser and Carleton, 1993). Thus, this single rodent taxon represents about 29 and 25% of ail mammalian species and genera, respectively. The evolutionary sys-tematics of this speciose family bas been very difficult and despite many attempts (i.e., Miller and Gidley, 1918; Simpson, 1945; Hooper and Musser, 1964; Chaline et al., 1977; Carleton, 1980), many uncertainties, confusions, and conflicting views have persisted for these animais. For this reason, in their recent review, Musser and Car-leton (1993) decided to keep a prudent state of uncer-tainty of the hierarchical pattern of muroid suprageneric groups and to divide the family Muridae into 17 subfam-ilies considered at the same taxonomic level. These "ma-jor lineages" within murids are Arvicolinae*,
Calomysci-nae*, CricetiCalomysci-nae*, Cricetomyinae, DendromuriCalomysci-nae*, Gerbillinae*, Lophiomyinae, Murinae*, Myospalacinae*, Mystromyinae*, Nesomyinae*, Otomyinae*, Petromysci-nae, PlatacanthomyiPetromysci-nae, Rhizomyinae*, Sigmodonti-nae*, and Spalacinae* (a star denotes taxa investigated in this study). Murid species and genera are not equally distributed among these subfamilies: most of them are included in the Old World rats and mice, Murinae (re-spectively, 40 and 45%), the New World rats and mice, Sigmodontinae (32 and 28%), the voles and lemmings, Arvicolinae (11 and 6.5%), and the gerbils, Gerbillinae (7 and 6%). Some ofthese subfamilies are very depauperate, such as the maned or crested rats, Lophiomyinae (1 spe-cies), the white-tailed mice, Mystromyinae (1 spespe-cies), or the mouse-like hamsters, Calomyscinae (1 genus and 6 species).
Although Borne Muridae species (i.e., from the genera Mus, Peromyscus, Mesocricetus, Phodopus, Rattus, etc.) have been used often in laboratories for genetic, physiological, or behavioral studies, there remains a strong need to better define the taxonomic boundaries of these subfamilies and especially the relationships among them. Many important questions concerning the evolutionary origins of most of the 17 subfamilies, their rates of evolution, or the sister group relation-ships between Muridae and other rodent families are not yet adeQuately answered.
INTRODUCTION
The rodents of the family Muridae (as defined by Musser and Carleton, 1993, and corresponding to the superfamily Muroidea of McKenna and Bell, 1997) are the most diverse group of mammals, encompassing at
280
1055-7903/00 $35.00
Copyright @ 2000 by Academic Press
BUSHLIKE RADIATION OF MUROID RODENTS
281
DNAIDNA hybridization and molecular sequences (128 rRNA and nuclear ribonucleases, respectively), confirmed the hypothesis of Denys et al. (1992) against the monophyly of Murinae and Dendromurinae and proposed to erect a new "Acomyinae" subfamily. This additional muroid lineage clusters genera which were previously classified as members of Murinae (Acomys, Uranomys, Lophuromys) or Dendromurinae (Deomys). A recent molecular analysis of the mitochondrial cyto-chrome b gene variation in several subfamilies of murids (Jansa et al., 1999), with a special emphasis on Malagasy Nesomyinae, suggested some suprageneric relationships, but these results are here considered doubtful as an inappropriate outgroup was selected for rooting highly saturated sequences. Finally, Robinson et al. (1997), in a study of LCAT (lecithin cholesterol acyl transferase) nuclear gene sequences, confirmed that 8palacinae and Rhizomyinae were early sepa-rated from five other subfamilies that were surveyed. The remaining murids appeared as a polytomy from which were issued Gerbillinae, Murinae, 8igmodonti-nae, Criceti8igmodonti-nae, and Arvicolinae.
However, the former study by Robinson et al. (1997) considered only 7 of the 17 lineages listed by Musser and Carleton (1993). To broaden the picture, we here enlarge the taxonomie sampling of rodents, with a spe-cial emphasis on Dipodidae (sampling 4 of 7 subfami-lies) and Muridae (13 of 17 subfamilies and four rep-resentatives of "Acomyinae"). The nuclear gene LCAT was used, as Robinson et al. (1997) demonstrated that it is a promising marker for this taxonomie level. This gene codes for a key enzyme in the reverse cholesterol pathway and consists of six exons totaling 1320 nucle-otides in Homo sapiens (McLean et al., 1986; Warden et al.. 1989).
Paleontological studies have provided important in-sights into Saille ofthese questions. For example, fairly good fossil records in Saille lineages were the basis for estimating the Mus-Rattus dichotomy (= 12 million years) (Jaeger et al., 1986; Jacobs et al., 1989, 1990; J acobs and Down, 1994) and the separation between Spalacinae, Rhizomyinae, and the remaining living Muridae (= 20 million years) (Flynn, 1990; Hugueney and Mein, 1993). These data are generally used to calibrate the molecular clocks in molecular studies. ln another way, clear morphological diagnoses were evi-denced to define Saille subfamilies, such as Gerbillinae (gerbils, jirds, and sand rats), Arvicolinae (voles, lem-mings, muskrats), Cricetomyinae (pouched rats and mice), Spalacinae (blind mole rats), Rhizomyinae (bamboo rats and African mole rats), or Cricetinae (hamsters) (Ellerman, 1940, 1941; Ognev, 1963; Carle-ton, 1980; Carleton and Musser, 1984; Jacobs et al.,
1989; Catzeflis et al., 1992). On the contrary, Saille subfamilies are more resistant to a morphological di-agnosis, such as Sigmodontinae (New World rats and mice) or Nesomyinae (Malagasy rats and mice). Fi-naIly, Saille other murid subfamilies might weIl prove para- or polyphyletic, such as Dendromurinae, whose monophyly was recently challenged by Denys et al. (1995).
Dental and cranial characters commonly used in morphological and paleontological studies are often subject to parallelism, convergence, and reversaIs events (Carleton and Musser, 1984; Catzeflis et al., 1992). These homoplasic characteristics have re-stricted their use for inferring the relationships be-tween aIl subfamilies and have yielded numerous con-flicting hypotheses, depending on which characters were emphasized by the various students of muroid systematics (Simpson, 1945; Honacki and Kinman, 1982; Chaline et al., 1977; Hooper and Musser, 1964).
Molecular phylogenetic studies, if based on genes legs subject to homoplasy than traditional morpholog-ical characters, could produce important complemen-tary information for a better understanding of the evo-lutionary systematics of Muridae. Currently, tao few molecular analyses with the aim of embracing the sub-familial diversity of murids have been performed. Saille studies have provided molecular signatures, such as the presence of a repetitive element called Lx for defining Murinae (Pascale et al., 1990; Furano et al., 1994). Catzeflis et al. (1993), through DNA/DNA hybridization, proposed that cricetines, arvicolines, sigmodontines, and possibly Mystromys were clustered in a clade, separate from the murines, gerbillines, and spalacines. On the basis of 12S rRNA mitochondrial sequences and DNA/DNA hybridization, Dubois et al. (1996) suggested the monophyly of Nesomyinae and a sister group relationship of these with the African Cricetomyinae. Chevret et al. (1993a, 1994), Hanni et al. (1995), and Dubois et al. (1999), on the basis of
MATERIAL AND METHODS
DNA was extracted and purified from ethanol-pre-served tissues taken from the Collection ofMammalian Tissues housed at Montpellier (Catzeflis, 1991). When-ever possible, we selected two species for each studied subfamily (see Table 1). This biological sampling was aimed at obtaining an equilibrated representation of each round lineage and at diminishing a possible long-branch attraction effect.
DNA Sequencing of LCAT Gene
Two fragments (as in Fig. 1, p. 424, in Robinson et al., 1997) of the nuclear gene LCAT were amplified using the PCR primers previously designed by Robin-son et al. (1997). AlI PCRs used the following protocol: 5 min at 94°C, 33 cycles (45 s at 94°C, 30 s at 52°C, and 1 min at 72°C), plus 10 min at 72°C in a Appligen Crocodile 3 thermal cycler. Total reaction volume was 100 ILl. PCR products were purified using the Ultra-free DNA Amicon kit (Millipore) and directlv
se-quenced. Sequencing on bath strands was clone using a dye terminator (Perkin-Elmer) sequencing kit and a ABI 373 (Perkin-Elmer) automatic sequencer. Sequence Alignment and Phylogenetic
Reconstructions
Previously known sequences were extracted from GenBank and aligned with the new sequences using CLUSTAL W (Thompson et al., 1994) and the ED edi-tor (MUST package; Philippe, 1993). The phylogenetic analysis was conducted on 804 nucleotides correspond-ing to the exonic regions of the two amplified frag-ments. The aligned sequences were treated by distance (neighbor-joining, NJ; Saitou and Nei, 1987), maxi-mum-parsimony (MP), and maximum-likelihood (ML) analyses using, respectively, MUST (NJboot program; Philippe, 1993; Tamura and Nei (1993) distance esti-mator), PAUP4.0b1 (NJ: ME criterion andTBRbranch swapping option; MP: heuristic search and TBR branch swapping option (Swofford, 1998)), and PUZZLE ver-sion 4.0 (quartet puzzling procedure; Strimmer and Von Haeseler, 1996; Tamura and Nei (1993) model of evolution and mixed (1 Inv + 8 gamma rates) model of among-sites rates heterogeneity). The robustness of inferences was assessed through bootstrap resampling (BP) (1000 repetitions) with the distance and parsi-mony approaches. ln the case of ML, the reliability percentage (RP; Strimmer and Von Haeseler, 1996) estimated the occurrence of the nodes in the quartet puzzling trees after 1000 puzzling steps. Bremer's sup-port index (BSI) (Bremer, 1988) was also calculated on the most-parsimonious tree with enforcement of topo-logical constraints. Likelihoods of alternative topolo-gies were compared with MOLPHY 2.3b3 (Adashi and Hasegawa, 1996) and PUZZLE (Strimmer and Von Haeseler, 1996). According to Kishino and Hasegawa (1989), an alternative hypothesis was rejected when 81nL> 1.96 SE, where 8lnL is the difference between the log-likelihoods of the best and those of the evalu-ated trees, and SE is the standard error of this differ-ence.
Relative-Rate Test
Relative-rate tests were conducted with RRTree, ver-sion 1.0 (Robinson et al., 1998), which improves the test of Wu and Li (1985) by taking into account the taxo-nomic representativity and its phylogenetic relation-ships. Relative-rate tests were performed among ro-dents at supra- and intrafamiliallevels; the ML tree derived from quartet puzzling was chosen as the refer-ence phylogeny. With regard to the different levels of analyses (see below), various outgroups were chosen: primates (Homo and Papio) for tests at the suprafamil-iallevel and Dipodidae for tests between the Muridae subfamilies. Relative-rate tests were performed on the proportions of synonymous (Ks) and nonsynonymous (Ka) substitutions.
RESULTS
Sequenced Species
The 21 new rodent sequences of the LCAT gene are indicated in Table 1, where rodent taxa are listed fol-lowing the taxonomie arrangement of Wilson and Reeder (1993). These sequences have been deposited in the EMBL gene bank under Accession Nos. AJ275513 to AJ275617.
The newly determined sequences have been com-pared to 17 rodent sequences determined by Robinson et al. (1997), as weIl as to Mus and Rattus (available in GenBank) (Table 1). We also conducted a few analyses with additional nonrodent taxa as outgroups: two Pri-mates (Homo sapiens, GenBank Accession No. X04981; Papio anubis L08633) and one Lagomorpha (Oryctola-gus cuniculus D13668).
Nucleotide Characteristics of LCAT and Analysis of Saturation
The aligned data matrix includes 43 mammalian species and 804 sites, 456 of which were variable and 317 phylogenetically informative when aIl events (transitions (TS) and transversions (TV)) are consid-ered; 53% of variable sites and 65% of informative sites concern the third position where most synonymous changes take place.
As already shown by Robinson et al. (1997), the mean frequency of nucleotides in the sequences compared shows an overall high GC content in LCAT (22.0% A,
28.2% C, 24.8% G, 25.0% T, 53% GC). This value is more pronounced in the third codon position (61.6% GC3), where it ranges from 54.8 (Myospalax) to 77.9 (Papio sp.). However, as already shown by Robinson et al. (1997), this variation in GC content does not seem to affect phylogenetic reconstruction. The average ratio of TSrrv is 1.90, ranging from 0.94 (Spalax ehrenbergil Spalax leucodon comparison) to 3.56 (Peromyscus
man-iculatuslAcomys cahirinus and Mystromys albicauda-tuslAcomys cahirinus).
The above differences in base composition and in rates ofTSrrv changes indicate that the data matri.x i8 heterogeneous with regard to the different substitution types at each codon position. To better locate ho-moplasy, we searched for evidence of saturation using the method of Hassanin et al. (1998a, b). This analysis aims at determining the relative importance of multi-ple substitutions by comparing, in scatterplots, the pairwise numbers of observed vers us inferred changes of each of the six substitution types at each codon position. Each of the 18 resulting scatterplots can be characterized by the consistency index (CI) of the most-parsimonious tree and by the slope (S) of the linear regression between observed and inferred changes. Such information provides a rough idea of the level of saturation for each kind ofnucleotide substitution
(Ta-BUSHLIKE RADIATION OF MUROID RODENTS 283 TABLE 1
References of Rodent Tissues Used for the Experiments
Tissue sample
Suprafamily Subfamily Species Geographic origin Collector Accession Nos. Dipodoidea Sicistinae Sicista kazbegica T-762 Central Caucasus, Cew Valley,
RUBsia
M. Baskevitch AJ275513 ta AJ525517
Muroidea
Allactaginae Allactaga elater T-I045 Turbat Jam, Iran Majad Zadé AJ275518 to AJ275522 Zapodinae Napaeozapus insignis T-240 Nova Scotia, Cumberland County, V. Volobouev AJ275523 ta AJ275527
Canada
Dipodinae Dipus sagitta T-869 Caucasus Mountains, Russia P. Gambarian AJ275528 ta AJ275532 Jaculus jaculus T-552 Djoudj, Senegal J.-M. Duplantier AJ275533 ta AJ275537 Calomyscinae Calomyscus mystax T-I067 Caucasus Mountains, Russia P. Gambarian AJ275538 to AJ275542 Dendromurinae Steatomys sp. T-1167 Sapago, Burkina-Faso J. C. Gautun AJ275543 to AJ275547
Deomys ferrugineus T-778 Goumina, Congo L. Granjon AJ275548 ta AJ275552 Dendromus mystacalis T-1422 Transvaal, South Africa G. Bronner and D. AJ275553 ta AJ275557
Bellars
Gerbillinae Tatera gambiana T-913 Robinson et al., 1997 U72297 ta U72298 Gerbillus henleyi T-1165 Robinson et al., 1997 U72295 ta U72296 Mystromyinae Mystromys albicaudatus T-1365 Natal, Nottingham Rd, South G. Bronner AJ275558 to AJ275562
Africa
Nesomyinae Macrotarsomys ingens T-1150 Ampijora, Madagascar D. Rakotondravony AJ275563 to AJ275567 Nesomys rufus T-1125 Ranomafana, Madagascar D. Rakotandavony AJ275568 ta AJ275572 Sigmodontinae Neotoma fuscipes T-385 Monterrey Co, California, USA M. Salvioni AJ275613 ta AJ275617
Akodon torques T-449 Robinson et al., 1997 U72303 ta U72304 Peromyscus maniculatus T-142 Robinson et al., 1997 U72307 to U72308 Cricetinae Phodopus roborowski T-714 Laboratory-bred, Gôttingen, 1. Hansmann AJ275573 ta AJ275577
Germany
Mescocricetus auratus T-1162 Laboratory-bred, montpellier, F. Catzeflis AJ275578 to AJ275582 France
Cricetulus migratorius T-325 Robinson et al., 1997 U72305 ta U72306 Myospalacinae Myospalax sp. T-394 Unknown locality, Russia P. Gambarian AJ275583 to AJ275587 Arvicolinae Dicrostonyx torquatus T-1337 Taimyr peninsula, Siberia, Russia R. A. Ims AJ275588 to AJ275592
Microtus nivalis T-523 Robinson et al., 1997 U72301 to U72302 Clethrionomys glareolus T-357 Robinson et al., 1997 U72299 to U72300
Murinae Lophuromys sikapusi T-1179 Man, Ivory Coast J.-M. Duplantier AJ275593 ta AJ275597 Rattus norvegicus GenBank X54096
Mus musculus GenBank JO5154
Micromys minutus T-1196 Robinson et al., 1997 U72293 to U72294 Uranomys ruddi T-1184 Kédougou, Senegal J.-M. Duplantier AJ275598 ta AJ275602 Acomys cahirinus T-1670 Greta island, Greece P. Lymberakis AJ275603 to AJ275607 9tomys angoniensis T-718 Nylsulei, South Africa G. Contrafatta AJ275608 to AJ275612 Nanospalax ehrenbergi T-268 Robinson et al., 1997 U72309 ta U72310 Nanospalax leucodon T-I009 Robinson et al., 1997 U72311 ta U72312 Rhizomys pruinosus T-1284 Robinson et al., 1997 U72313 ta U72314 Octodon lunatus T-I001 Robinson et al., 1997 U72325 to U72326 Myocastor coypu T-245 Robinson et al., 1997 U72323 ta U72324 Myoxus glis T-1453 Robinson et al., 1997 U72317 to U72318 Eliomys quercinus T-1499 Robinson et al., 1997 U72315 ta U72316 ~~.~.u~~ Sciurus vulgaris T-1279 Robinson et al., 1997 U72321 ta U72322 Marmota kamtschatika T-1552 Robinson et al.. 1997 U72319 ta U72320
Octodontoidea Dasyproctoidea Gliroidea Sciuroidea
Note. The taxonomie arrangement follows that of Wilson and Reeder (1993).
ble 2). The results show that the C-T and A-G transi-tions exhibit a lower slope (average, for the three codon positions, of 0.59 for A-G and 0.63 for C-T) and consis-tency index (average of 0.33 for A-G and 0.35 for C-T) with regard to the transversions, whatever the codon position. Considering also the fact that the highest nurnbers of informative characters are the result of transitional changes (Table 2), this analysis of satura-tion justifies Borne down-weighting for A-G and C-T changes.
Consequently, in parallel to a classical unweighted parsirnonyanalysis (MP), we performed a second anal-ysis (MPw) in which we weighted each substitution event according to its slope (taking 1000 tirnes this value for each substitution cell to use the "steprnatrix" option of PAUP). Otomyinae Spalacinae Rhizomyinae Octodontidae Myocastoridae Gliridae Q~;..";,Ioo Phylogenetic Reconstructions Analyses with 43 Eutherian Mammals
A first set of analyses (Table 3, Fig. 1) considered 40 rodents, 2 primates, and 1 lagomorph for aIl coding sequences (concatenations of exons 2, 3, 4, 5, and 6), that is 804 nucleotides, or 268 amino acids. We ex-cluded three codons corresponding to autapomorphic insertions (one codon for Sciurus vulgaris and two for Microtus nivalis).
The maximum-parsimony reconstruction based on equal weighting of each nucleotide substitution yielded 24 most-parsimonious trees. Each tree is 1541 steps long, with a consistency index (excluding uninforma-tive characters) of 0.38 and a retention index of 0.56. Bootstrapping and Bremer's support index values are
TABLE 2
Number of Informative Sites, Consistency Index, and Slope of Saturation for Each of the 18 Substitution
Types Caviomorpha Sciuridae Gliridae Number of informative sites 81ope of saturation (8) Consistency index (CI) Sicista Jaculus Dipus Napaeozapus Allactaga DiDodidae 0.53 0.32 0.56 0.61 0.38 0.51 0.83 0.57 0.9 0.82 0.66 0.83 22 47 9 24 41 21 20 42 17 27 49 19 0.58 0.36 0.81 0.76 0.39 0.73 0.92 0.69 0.98 0.86 0.71 0.98 Muridae lst Codon A-C A-G A-T C-G C-T G-T 2nd Codon A-C A-G A-T C-G C-T G-T 3rd Codon A-C A-G A-T C-G C-T G-T 26 41 15 19 64 17 0.55 0.32 0.65 0.61 0.29 0.53 0.92 0.52 0.83 0.86 0.54
0.84 FIG. 1. Synthetic tree summarlzing the results derived from
three approaches on 43 mammalian DNA sequences of the LCAT gene. The robustness of each node Oabeled A ta H) is described in Table 3 for maximum-parsimony (bootstrap percentage and Brem-er's support index), distance analysis (bootstrap percentage), and maximum-likelihood (reliability percentages). The tree was rooted by the two primate sequences.
indicated in Table 3 for the ancestral segments labeled A to H in Fig. 1. There exists a strong support for the families Sciuridae (node D; BP = 99%; BSI = + 12), Gliridae (node E: 100%, + 14), Muridae (node H: 99%; +8), and Dipodidae (node G: 98%; +6), and for the suprafamilial taxon Caviomorpha (node C: 100%; +23). This maximum-parsimony analysis also
con-TABLE 3
Indices of Robustness for the Nodes of the Phyloge-netic Tree Represented in Fig. 1 Using Maximum-Par-simony (MP), Distance, and Maximum-Likelihood (ML) Analyses MPw BSI NJ ML Nodes MP A B C D E F G H 100 96 100 99 100 96 98 99 100 97 100 99 100 98 99 100 +23 +19 +23 +12 +14 +8 +6 +8 100 94 100 100 100 95 96 97 90 82 92 85 92 89 92 81
Note. Bootstrap percentages computed after standard MP (with equal weighting), MP weighted by slopes of saturation profiles (MPw), and neighbor-joimng (NJ) on Tamura and Nei (1993) dis-tances with gamma rates (alpha = 0.38) are reported. Reliability percentages deduced from the quartet puzzling ML methods are also given. Finally, Bremer support indices (BSls) are indicated.
firms the Myodonta concept (Schaub, in Grassé, 1955) including the Dipodidae and Muridae families (node F with BP of 96% and BSI of +8). The weighted-parsi-mony analysis with the stepmatrix (taking into ac-count a different saturation level for each kind of sub-stitution) did not show any interesting difference with regard to the classical parsimony analysis (compare BP values for MP and MPw in Table 3). To the contrary of other studies with mitochondrial genes (Hassanin et al., 1998a, b), this a priori weighting did not improve the robustness of the maximum-parsimony tree.
Reliability percentages (ML analysis with a esti-mated at 0.38 and estiesti-mated proportion of invariant sites of 0.0) and bootstrap percentages (NJ with a = 0.38 according to the puzzle analysis) yield results similar to those obtained with the parsimony analysis (Table 3). AlI the ancestral segments that were strongly supported through parsimony are also re-trieved with a high robustness by the two other opti-mality criteria.
We checked that the Myodonta support was not due to the particular taxonomie sampling of our data set, especially with regard to differences between the Di-podidae (5 species) and the Muridae (29 species)
rep-position
position
BUSHLIKE RADIATION OF MUROID RODENTS 285
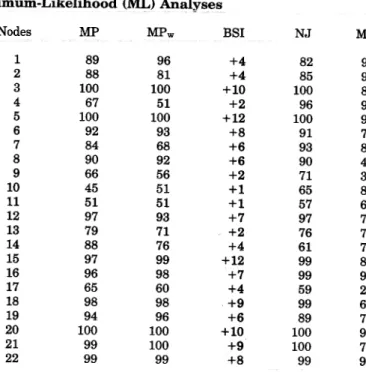
Maximum-parsimony. The parsimony reconstruc-tion based on equal weighting of each nucleotide sub-stitution yielded eight most-parsimonious trees. Each tree is 1096 steps long, with a consistency index (ex-cluding uninformative characters) of 0.40 and a reten-tion index of 0.53. Figure 2 indicates that, within Muri-dae, the first dichotomy isolates a clade (node 4 in Table 4) comprising Spalax and Rhizomys. The re-maining Muridae comprise a strongly supported clade (BP of 92% and BSI of +8: node 6). The monophyly of several subfamilies represented by at least two genera is robust: Nesomyinae (node 9), Arvicolinae (node 15), and Gerbillinae (node 20) are supported by BPs be-tween 84 and 100% and by BSIs bebe-tween +7 and +12. On the contrary, as was already observed by Robinson et al. (1997), the New World rats and mice, Sigmodon-tinae (node 10), represented in this study by Peromys-eus, Neotoma, and Akodon, are poorly defined (BP of 45% and BSI of + 1). Maximum-parsimony analysis also clearly shows (BP of 98% and BSI of +9) that Acomys, Uranomys, and Lophuromys do not belong to the true Murinae (represented here by Mus, Rattus, Micromys) but are clustered in a suprageneric clade
TABLE 4
Indices of Robustness for the Nodes of the Phyloge-netic Tree with Myodonta Only Represented in Fig. 2 Using Maximum-Parsimony (MP), Distance, and Max-imum-Likelihood (ML) Analyses
FIG. 2. Synthetic tree summarizing the results derived from three approaches on 34 Myodonta DNA sequences of the LCAT gene. The robustness of each node (labeled 1 to 22) is documented in Table 4 for maximum-parsimony (bootstrap percentage and Bremer's sup-port index), distance analysis (BP), and maximum-likelihood (reli-ability percentages). The tree was rooted by five Dipodidae se-quences. Nodes MP MPw BSI NJ ML 1 2 3 4 5 6 7 8 9 10 Il 12 13 14 15 16 17 18 19 20 21 22 89 88 100 67 100 92 84 90 66 45 51 97 79 88 97 96 65 98 94 100 99 99 96 81 100 51 100 93 68 92 56 51 51 93 71 76 99 98 60 98 96 100 100 99 +4 +4 +10 +2 +12 +8 +6 +6 +2 +1 +1 +7 +2 +4 +12 +7 +4 +9 +6 +10 +9 +8 82 85 100 96 100 91 93 90 71 65 57 97 76 61 99 99 59 99 89 100 100 99 94 94 83 96 98 70 87 49 34 82 65 75 72 75 88 93 25 68 72 95 77 92
resentations. Distance analysis (Tamura-Nei,
a =0.38) was repeated 10 times with a random sample of five Muridae sequences, and the robustness of nodes was addressed by bootstrap. The average BP was 87.2 for Myodonta (SD 9.9, range 74-98), 92.7 for Dipodidae
(SD 5.2, range 82-98), and
93.9for Muridae (SD 8.8,
range 76-100). Thus, we feel confident that the Myo-donta clade is robust and reliable and that this node does not rely upon a particular choice of its represen-tative taxa.
Analyses with Dipodidae only as Outgroup
As shawn by the previous analysis, the Myodonta monophyly, as weIl as the naturalness of Dipodidae and Muridae, appears weIl established. Thus, for the purpose of avoiding the use of tao-distant outgroups with regard to within-Muridae relationships, we per-formed a second set of analyses using only the five Dipodidae as outgroup for a monophyletic Muridae (Fig. 2 and Table 4).
Note. As in Fig. 1, bootstrap percentages computed after standard MP (with equal weighting), MP weighted by slopes of saturation profiles (MP w), and neighbor joining (NJ) on Tamura and Nei (1993) distances with gamma rates (alpha = 0.41) are reported. Reliability percentages deduced from the quartet puzzling ML methods are also given. Finally, Bremer support indices (BSIs) are indicated.
previously obtained by the distance and parsimony criteria.
Likelihood alternatives to the best tree. The highest-likelihood tree was used as the reference topology to apply the test of Kishino and Hasegawa (1989) for assessing the following clades: (1) the monophyly of each of the "Acomyinae" and Sigmodontinae groups; (2) the sister group relationships between (a) Mystromyi-nae and NesomyiMystromyi-nae and (b) GerbilliMystromyi-nae, MuriMystromyi-nae, and "Acomyinae;" and (3) the nested position of (a) Otomyi-nae within MuriOtomyi-nae and (b) MyospalaciOtomyi-nae within Cricetinae.
For doing gO, we tested different alternative topolo-gies derived from traditional morphological and pale-ontological studies or from various molecular hypoth-eses: Acomys, Uranomys, and Lophuromys in Murinae (Carleton and Musser, 1984; Musser and Carleton, 1993); Deomys in Dendromurinae (Carleton and Musser, 1984; Musser and Carleton, 1993); Peromys-cus (Sigmodontinae) with Clethrionomys (Arvicolinae) (Dickerman, 1992); Neotoma (Sigmodontinae) with Eurasian Cricetinae (Dickerman, 1992); Myospalax with Spalax and Rhizomyinae (Miller and Gidley, 1918); Mystromys with Cricetinae (Carleton and Musser, 1984); Otomys as the sister taxon of Murinae (Thomas, 1896; Misonne, 1971; Chaline et al., 1977); Murinae, Gerbillinae, and Acomyinae paraphyletic (Ameur, 1984; Flynn et al., 1985).
AlI these alternative topologies exhibited a signifi-cantly worse log-likelihood than the one measured for the highest-likelihood tree. Based on these tests, we maintain the previously mentioned relationships, in particular the monophyly of each of the two subfami-lies "Acomyinae" and Sigmodontinae and the inclusion of Otomyinae and Myospalacinae within Murinae and Cricetinae, respectively.
Relative-Rate Tests
To identify whether differences in rates of LCAT change existed in the major taxa of rodents (Gliridae, Sciuridae, Dipodidae, Muridae, and Caviomorpha), rel-ative-rate tests were conducted with each of them against the remaining lineages. K. comparisons did not evidence significant differences in relative rate in the different groups. To the contrary, Ka comparisons (non-synonymous changes) showed marked differences in evolutionary rates: Dipodidae and Sciuridae appear to be slowly evolving taxa (respectively, P < 0.001 and P < 0.03). Among Sciuridae, more detailed analyses showed that only Marmota had a slow rate of evolution (P < 0.003). On the other hand, within Dipodidae, four of the five studied species showed a significantly lower rate of nonsynonymous change (Sicista, Jaculus, Di-pus, and Napaeozapus) (P < 0.01). Muridae as a whole did not have a particularly fast rate of evolution.
Relative-rates tests were then performed among Muridae using the slowly evolving Dipodidae as out-(node 18), which also includes Deomys (traditionally
classified with Dendromurinae). Following Hânni et al. (1995, p. 132), we name "acomyines" or [provisionally] "Acomyinae" as the clade containing the genera Acomys, Deomys, Lophuromys, and Uranomys.
A new finding for nonmorphological studies ofmurid systematics is the nesting of Myospalacinae within Cricetinae (BP characterizing Cricetinae + Myospal-acinae of 97%; BSI of +7) (node 12). As previously shown by Chevret et al. (1993b), Otomyinae (Otomys) is included within Murinae (as the sister genus of Mus: node 22) with a strong support: BP of 99% and BSI of +8. The ancestral segment (numbered 8 in Table 4 and Fig. 2) uniting the Malagasy Nesomyinae (represented by Nesomys and Macrotarsomys) with the South Afri-can Mystromyinae (represented by Mystromys) is strongly supported (BP of 90% and BSI of +6). Finally, parsimony suggests a clade comprising Murinae, Ger-billinae, and" Acomyinae" (node 17), although with a poor support (BP of 60-65% and BSI of +4).
The weighted parsimony analysis (with stepmatri-ces) gave approximately the same values as the un-weighted analysis and did not improve the robustness of the inferences (compare columns MP and Mpw in Table 4). An unexpected observation was that Borne nodes were legs supported (i.e., for node 7: BP of 84% for equal weighted analysis and 68% for weighted anal-ysis) when saturation was taken into account.
Neighbor-joining and maximum-likelihood. The clus-tering of Spalacinae and Rhizomyinae as the earliest off shoot from murid ancestors was strongly supported by NJ and ML analyses (respectively, BP and RF of 96%), compared to the poor robustness observed through max-imum-parsimony methods (node 4 in Table 4). Similarily, the monophyly of Sigmodontinae is also more robust with maximum-likelihood (RP
=
82%). For the NJ analysis,branching pattems and bootstrap values were similar using either MUST or PAUP. The use of the Tamura and Nei (1993) model of substitution along with a mixed model of among-sites rate heterogeneity could explain the better performances of distance and likelihood opti-mality criterions, because such approaches take into ac-count the heterogeneities existing in the data matrix. The higher (Rhizomys) or slower (Sigmodontinae) rates of evolution characterizing Borne of these taxa (see below) could also explain the relative difference in robustness between maximum-parsimony and other approaches. AlI other nodes that were strongly supported through maxi-mum-parsimony analysis are also retrieved as strong ancestral segments in the maximum-likelihood and dis-tance results (Table 4).
The highest-likelihood tree (lnL
=
-6687.93) on 34Myodonta species was identified with PUZZLE (Strim-mer and Von Haeseler, 1996) among 945 alternative trees constructed using MOLPHY 2.3b3 (Adashi and
287
BUSHLIKE RADIATION OF MUROID RODENTS
TABLE 5
Estimations of the Separation Times of Different Events within the Muroids, on the Basis of the Molecular Data
Calibration point based on the
separation: Spalax/modern muroids (in Myr)
Calibration point based on the separation: Mus 1 Rattus (in Myr) SE SE
Separation events Paleontological estimations
Spalax/modern muroids 20 21.7 1 12 Mus/Rattus 11.5 1 7.8 7.4 1 0.7 8.8 8 1.1 0.8 Gerbillus / Tatera Clethrionomys / Microtus Myospalax/ Phodopus 4.5 0.7 5 0.7
Radiation of modern muroids 16.8 0.5 19 0.5
Steatomys 1 Dendromus 9.5 1.3 10.7 1.4
Gerbillinae/M urinae/ Acomyinae 15.4 0.7 16.6 0.7
20 Myr (Hugueney and Mein, 1993)
12 Myr (Jaeger et al., 1986; Jacobs and Down, 1994) 8-10 Myr (Tong, 1989) 3, 5-6 Myr (Chaline and
Graf, 1988)
2 Myr (Chaline et al., 1977; Carleton and Musser, 1984)
18 Myr (Tong and Jaeger, 1993)
8-11 Myr (McKenna and Bell, 1997)
16 Myr (Tong and Jaeger, 1993)
Note. The numbers in boldface correspond to the two calibration points used for this analysis: 20 Myr for the separation between Spalacinae and modem Muroids (Hugueney and Mein, 1993); 12 Myr for the separation between Mus and Rattus (Jacobs et al., 1986; Jacobs and Down, 1994). SE, standard error.
ration time between Spalacinae and aIl the remaining living Muridae estimated at approximately 20 Mybp (Hugueney and Mein, 1993). The ML distance between Mus and Rattus is 0.047, whereas that between Spalax and aIl remaining murids is 0.085. These values give a rate of 0.0039 (Mus/Rattus) or 0.0042 (Spalax/other Muridae) ML distance per million years. When these rather similar rates are applied to the different dichot-omies within Muridae, the following molecular datings are obtained: 16.8 to 19 Mybp for the initial bushlike radiation; 15.4 to 16.6 Mybp for the separation between Murinae, Gerbillinae, and Acomyinae; 7.8 to 8.8 Mybp between the gerbil genera Gerbillus and Tatera; 4.5 to 5.0 Mybp between the hamster Phodopus (Cricetinae) and the zokor Myospalax; 7.4 to 8.0 Mybp between the voles Microtus and Clethrionomys; and 9.5 to 10.7 Mybp between the two dendromurines Steatomys and Dendromus. Table 5 provides these values and their SE in comparison to paleontological estimates.
group. As previously, synonymous (K. values) changes did not show significant differences between the differ-ent Muridae subfamilies. However, Ka comparisons showed that Nesomyinae and Sigmodontinae were slowly evolving (respectively, P < 0.05 and P <
0.002) and that Rhizomyinae was rapidly evolving (P < 0.02). Within Malagasy rodents, further analyses showed that only Nesomys had a lower rate of evolu-tion. Within New World Sigmodontinae, aIl three gen-era (Neotoma, Peromyscus, and Akodon) were signifi-cantly slowly evolving (respectively, P < 0.001, P < 0.05, and P < 0.02).
The different results obtained for K. and Ka can be explained by the fact that synonymous substitutions saturate at the suprafamilial level, as was already suggested by the saturation analysis (see above and Table 2).
Consequently, to apply a molecular clock and esti-mate dates of separation between the murid genera and the subfamilies, we performed another maximum-likelihood analysis with Dipodidae as outgroup and aIl the Muridae except the slowest and fastest evolving species (Nesomys, aIl Sigmodontinae, and Rhizomys). The inferred maximum-likelihood distances were the basis for estimating separation times. Two calibration points derived from paleontological data were chosen: (1) the Mus/Rattus dichotomy set at 12 millions years before present (Mybp) (Jaeger et al., 1986; Jacobs et al., 1989. 1990: Jacobs and Down. 1994) and (2) the
sepa-DISCUSSION
Molecular Evolutionary Rates
As for another nuclear protein-coding gene which was sequenced in representatives of several rodent families (exon 28 of von Willebrandt Factor gene: Hu-chon et al., 1999), LCAT sequences show that Muridae are not especiallv rapidlv evolvinΠmammals. This
re-omy at 12 Mybp) suggests that this separation oc-curred approximately 20 Mybp, a dating in good agree-ment with paleontological inferences (Flynn et al.,
1985; Hugueney and Mein, 1993; Mein and Ginsburg, 1997). Thus, this study clearly identifies mole rats, Spalacinae, and bamboo rats, Rhizomyinae, as the sis-ter group of all remaining murid families, and this result conHicts with Jansa et al. (1999), who made the a priori choice of Calomyscus for rooting several sub-families of Mrican and Asian murids.
The remaining 12 subfamilies are clustered together in a strongly supported clade (node 6 on Fig. 2). The first branching event of this clade is a large polytomy, leading to seven lineages, of which three encompass more than 1 subfamily: Mystromyinae and Nesomyi-nae (node 8: Fig. 2 and Table 4), CricetiNesomyi-nae and Myo-spalacinae (node 12), and Murinae, Otomyinae, Ger-billinae, and Acomyinae (node 17). Thus, most of the "advanced" murid subfamilies appear to be of a polyto-mous origin, indicating the phenomenon of a spectac-ular bushlike radiation having led to the majority of them. Because ancestral segments with high bootstrap support are retrieved deeper into the trees of Fig. 1 (node H: Muroidea; node F: Myodonta) and Fig. 2 (node 3: Muridae), our inference for the existence of this radiation is probably real and not due to artifacts re-lated to saturation and homoplasy. On the basis of the molecular data, this event occurred 17-19 Mybp (Table 5). This approximation is in accordance with the fossil records (Hartenberger, 1985; Baskin, 1986; Jacobs et al., 1989; Tong and Jaeger, 1993); the oldest fossils considered direct ancestors of living murids, such as Potwarmus thailandicus, are dated ca. 18 Mybp (Mein and Ginsburg, 1997). Other molecular studies (DNA/ DNA hybridization: CatzeHis et al., 1993; nuclear LCAT gene: Robinson et al., 1997) have also estimated this radiation at "'" 18 Mybp. According to Aguilar et al. (1996, 1999), this period (end of early Miocene) was characterized by changes of climate, which favored the spread in Europe, northern Africa, and the Middle East of allochtonous groups such as the extinct cricetid rodents (Democricetodon), probably coming from Asia. It is also during this period of time that other cricetid rodents (Mrocricetodontinae) invaded, coming from Asia, the other Mrican regions, and Madagascar, lead-ing later to the appearance of modern Mrican subfam-ilies (Lophiomyinae, Cricetomyinae, Dendromurinae, Nesomyinae, Mystromyinae) (Lavocat, 1973, 1978; Bernor et al., 1987). Concerning the New World, the extinct genus Copemys, a taxon related to Democricet-odon (see discussion in Carleton and Musser, 1984), migrated at the end of early Miocene (Flynn et al., 1985) from the Palearctic to North America, where it Hourished and gave rise to the ancestors of Sigmodon-tinae (Martin, 1980; Carleton and Musser, 1984); Baskin (1986) describes Abelmoschomys simpsoni, a fossil dated at ca. 9 Mybp, as the oldest direct ancestor
suIt contrasts with results of other nuclear (DNAIDNA hybridization; Catzeflis et al., 1987; sequences: Li et al., 1987) and mitochondrial (Philippe, 1997) studies, most of them comparing a few murids with nonrodent euth-erian mammals. According to Huchon et al. (1999) and Robinson et al. (1998), part of "this result is probably the consequence of the use of a "topology-weighted" procedure in the computation of the relative-rate test." Another reason could be that the previous studies an-alyzed only a limited number of Muridae subfamilies (at most Murinae, Cricetinae, and Arvicolinae; Catze-flis et al., 1987; O'hUigin and Li, 1992) or, most com-monly, just the two laboratory-bred murines Mus and Rattus.
Thus, our study indicates that, if a sufficient sam-pling of Muridae representatives is considered, this speciose family will exhibit both slowly evolving (Sig-modontinae) and rapidly evolving (Rhizomys) taxa. Consequently, in comparison with other rodent fami-lies (Sciuridae, Gliridae, etc.), murids on average do not appear to have a particular pattern of evolution.
Relationships between Dipodidae and Muridae: the Myodonta Concept
The concept of a sister group relationship between Dipodidae and Muridae was proposed for the first time by Schaub (in Grassé, 1955) on the basis of morpholog-ical characters, uniting these taxa into the infraorder Myodonta. Later, in a comparative myological study, Klingener (1964) evidenced two exclusive synapomor-phies for the taxon Myodonta: the lack of differencia-tion of Musculus adductor magnus into M. adductor minimus and M. adductor magnus proprius and the separation of M. femorococcygeus from M. biceps fem-oris by the posterior femoral cutaneous nerve. Other embryological (see review in Luckett and Harten-berger, 1985) and molecular (Serdobova and Kramerov, 1998) studies confirmed the taxonomie value of this infraorder.
However, until now, nuclear (VWF gene; Huchon et al., 1999) and mitochondrial (12S rDNA; Nedbal et al., 1996) sequences gave a weak support for the mono-phyly ofthis infraoder. Thus, the phylogenetic signal of the LCAT gene, which strongly clusters Dipodidae and Muridae, gives additional support tothe morphological hypothesis for the Myodonta.
An Early Isolation of Spalacinae and Rhizomyinae and an Explosive Radiation Leading to dIe Remaining
Modem Muridae Subfamilies
As already shown in Robinson et al. (1997), our re-sults confirm the hypothesis derived from the fossil record of an early separation of Spalacinae and Rhizo-myinae from other Muridae (Flynn et al., 1985; Flynn, 1990, Hugueney and Mein, 1993). The LCAT molecular
dichot-BUSHLIKE RADIATION OF MUROID RODENTS 289 for the living New World rats and mice. Thus,
combin-ing our molecular evidence with paleontological data and interpretations, we suggest that the early Miocene bushlike radiation of Muridae was associated with and immediately followed by a large worldwide spread of several ancestral Asiatic cricetid rodents.
aration between them with regard to the other subfam. ilies of Muridae.
The Existence of an Acomyine Group and the Paraphyly of Dendromurinae
The LCAT gene study confirms with much robust-ness that Acomys, Lophuromys, Uranomys, and Deo-mys are clustered in a suprageneric clade, which we calI the "Acomyinae" group. This inference is in agree-ment with previous molecular data (Chevret et al., 1993a; Furano et al., 1994; Hanni et al., 1995; Ver-heyen et al., 1996; Dubois et al., 1999), which consid-ered a reduced taxonomie sampling pertaining to this question. However, a monophyletic acomyine subfam-ily is seriously at odds with traditional systematics based on comparative morphoanatomy (no morpholog'-ical signature is known for this group, especially con-sidering the inclusion of Deomys).
The separation between Deomys and the two other studied Dendromurinae (Dendromus and Steatomys) provides additional evidence for the paraphyly of this subfamily, as already suggested by Denys et al. (1995) and Verheyen et al. (1996) through comparative mor-phology and molecular data.
Otomyinae Are Nested within Murinae
As already shown by other molecular (Chevret et al., 1993b, unpublished; Usdin et al., 1995) and paleonto-logical (Senegas and Avery, 1998) studies, we confirm a close relationship between Otomyinae (represented by Otomys) and Murinae. This result and results of mor-phological studies (Chevret et al., 1993b; Senegas and Avery, 1998) suggest that this subfamily should be invalidated and that the Otomyinae should be consid-ered a tribe of Murinae, despite the tremendous differ-ences in the dental patterns ofvlei and karoo rats with regard to the remaining Old World rats and mice.
An African Origin for the Malagasy Nesomyinae Our results strongly suggest a sister group relation-ship between the two Malagasy Nesomyinae genera and the South Mrican Mystromyinae. This result is congruent with the hypothesis of Lavocat (1973, 1978) who proposed to ally Nesomyinae with other archaic African groups such as Mystromyinae, Cricetomyinae, and Lophyomyinae; Chaline et al. (1977) united these taxa into the family Nesomyidae. lndeed, aIl these murids would represent derivatives of an old African cricetodontine stock. On the basis of morphological characters, Carleton and Musser (1984) also proposed the association of the white-tailed hamster, Mystro-mys, with N esomyinae. However, other molecular studies suggested that the more recent relatives of Nesomyinae were Cricetomyinae (12S rRNA: Dubois et al., 1996) or Murinae (cytochrome b gene: Jansa et al.,
1999). Neverthele~~- hoth m]T Rnd n]]hoi~'~ pt n[ (l.Q.QR)
A Sister Group Relationship among Murinae, Gerbillinae, and Acomyinae
Traditional paleontological hypotheses never classi-fied or associated Gerbillinae with Murinae (Simpson, 1945; Chaline et al., 1977; de Graaf, 1981; Ameur, 1984; Flynn et al., 1985), most probably because their dental patterns are so different. A comparative chro-mosomal study (Viegas-Pequignot et al., 1986) sup-ported this view, arguing that a greater similarity in karyotypes was observed among Murinae, Cricetinae, and Sigmodontinae than between any of these and Neotominae, Nesomyinae, Arvicolinae, and Gerbilli-nae. Molecular studies based on 12S rRNA sequences (Hanni et al., 1995; Dubois et al., 1996) also suggested that Gerbillinae were external to a clade uniting Crice-tinae + Murinae. Nevertheless, this topology might have been the result of homoplasy related to the com-bination of a rapidly evolving mitochondrial gene with a too-distant outgroup (Gliridae only, in these refer-ences).
Although the resampling support is weak (BP values between 59 and 65: node 17 in Table 4), our results tentatively suggest that Gerbillinae, "Acomyinae," and Murinae had a more recent common ancestor with regard to the other Muridae subfamilies. The robust-ness of this cluster improves when LCAT sequences are combined with 12S rRNA data (BP of 86% and BSI of Il in MP; P. Chevret et al., unpublished); similarily, the Kishino and Hasegawa test (1989) also confirms a closer relationship between these three subfamilies.
This result is congruent with DNNDNA hybridiza-tion studies (Brownell, 1983; Chevret et al., 1993a, unpublished; Catzeflis et al., 1992, 1993). From a pa-leontological point ofview, recent studies (Jaeger et al., 1985; De Bruyn and Hussain, 1985; Tong, 1989; Tong and Jaeger, 1993) proposed the separation of Gerbilli-nae and MuriGerbilli-nae from a common ancestor at =16-18 Mybp. According to these authors, this event appeared 2 millions years after an initial separation from other cricetid muroids. This paleontological scenario is in accordance with the divergence times estimated in the molecular analyses (Table 5), namely 15.4 to 16.6 Mybp for the Gerbillinae/Murinae split, subsequent from the initial radiation of modern muroids set at 16.8 to 19.0 Mybp.
Thus, our molecular results give some evidence for confirming a sister group relationship among
sen-studies surfer from a poor taxonomie sampling with regard to Nesomyinae representation. Sequences of Cricetomyinae could not be obtained for the LCAT gene. On the other hand, the results and interpreta-tions of Jansa et al. (1999) remain doubtful for two reasons: their outgroup taxon (Calomyscus) was not adequate to root the different Asian and Mrican sub-families and most of the cytochrome b variation at such suprageneric levels is random homoplasy due to satu-ration (data not shown). Clearly, more analyses are needed for clarifying these relationships, especially sampling, through moderately evolving genes (such as nuclear LCAT or nonsynonymous substitutions in mi-tochondrial genes), additional taxa of Cricetomyinae (Cricetomys, Beamys, and Saccostomus) and of Ne-somyinae.
Are the New World Rats and Mice Paraphyletic? New World rats and mice have been occasionaIly grouped together with Palearctic hamsters in the fam-ily Cricetidae (EIlermann, 1941; Simpson, 1945). Later, other paleontologists and morphologists pro-posed to separate the New World species as a distinct subfamily (Hesperomyinae of Chaline et al., 1977), whose name is Sigmodontinae (Reig, 1980; Carleton and Musser, 1984). Moreover, Hooper and Musser (1964) divided this speciose subfamily (about 80 gen-era) into two groups according to the morphology of the glans penis: a simple type, characteristic of North American species and a complex type distributed among South American species. These two morpholog-ical archetypes led to distinct two tribes: the North American Peromyscini and the South American Sigmo-dontini. ln 1980, Reig proposed to designate the tribes as subfamilies: Neotominae and Sigmodontinae, re-spectively. However, Carleton (1980) cautioned that "formaI recognition of the two assemblages as subfam-ilies had not been convincingly demonstrated." On the basis of DNNDNA hybridization, Dickerman (1992) and Catzeflis et al. (1993) confirmed a phylogenetic dichotomy between North American and South Amer-ican cricetids and proposed to consider them two dis-tinct subfamilies.
Our data involve only three genera, but they confirm, although with a weak support, the monophyly of the New World Sigmodontinae. Based on a large taxo-nomic sampling of 38 South American and 4 North American genera of Sigmodontinae, Smith and Patton (1999) evidenced a weak support for the monophyly of the group based on the mitochondrial cytochrome b gene. For the LCAT gene, the alternative topologies contradicting this monophyly always exhibit signifi-cantly worse log-likelihood, suggesting confirmation of the Sigmodontinae concept. Moreover, the fact that aIl three Sigmodontinae examined here are characterized by a slower rate of DNA change corroborates this hy-pothesis.
A Close Relationship between Palearctic Myospalacinae and Cricetinae
Owing to their particular morphology, the Myospal-acinae have been associated with other groups of fos-sorial rodents such as the mole rats, Spalacidae (Miller and Gidley, 1918), or the bamboo rats, Rhyzomyinae (Tullberg, 1899). Later, Chaline et al. (1977) preferred to consider this group as a distinct subfamily and pro-posed that they evolved from Eurasian cricetodontines during the Pleistocene. ln the same way, Carleton and Musser (1984) concluded that Myospalax "is a primi-tive cricetid that probably became fossorially adapted before the Gobi region became arid." Our results indi-cate that Myospalacinae are nested within Cricetinae (particularly with the Asiatic species Phodopus) (see Table 4 and Fig. 2). For this reason, we propose to invalidate this subfamily and to consider the genus Myospalax (sole living member of "Myospalacinae") as defining a tribe among the subfamily Cricetinae. More-over, the divergence time estimation based on our mo-lecular data suggests that the separation between Myospalax and the other Cricetinae appeared during Early Pliocene (4-5 Mybp). Until recently, the oldest fossils attributed with confidence to zokors were at most of Upper Pliocene (ca. 2 Mybp: Lawrence, 1991). The synthesis by Zheng (1994) documented the fossil Episiphneus sinensis, dated at ca. 4 Mybp, as the direct ancestor for living Myospalax spp., thus a temporal estimate in good agreement with the molecular dating ofthis study. Inferences from the LCAT gene disagree with Lawrence's (1991, p. 282) opinion by which "the equal division of [morphological] characters between plesiomorphic murid features and derived characters associated with fossorial adaptation lends support to the proposaI that myospalacines are derived from a primitive murid stock. . .."
Differences between Datings Estimated by Fossils and Molecules
Although most of the separation times estimated on the basis of the molecular data are in good agreement with those obtained through the fossil records (Table 5), one seems unclear. The value of7.4 to 8.0 (SE = 0.8) Mybp for the split between the vole genera Clethriono-mys and Microtus is much older than the dating at 3.5 to 6.0 Mybp suggested by Chaline and Graf(1988). Our estimate is similar to that calculated by Robinson et al. (1997), also obtained with the nuclear LCAT gene, but is at odds with other molecular studies based on DNA/ DNA hybridization (Catzeflis et al., 1987) or on the nuclear ribonuclease gene sequences (Dubois et al., 1999). The relative-rate tests for LCAT showed that the two vole taxa do not evolve at a particular rate of evolution with regard to the other Muridae. Thus, the molecular clock of the LCAT gene seems also valid for these arvicoline taxa. ln conclusion. we SUf!f!est that
BUSHLIKE RADIATION OF MUROID RODENTS 291
additional taxa related to the Microtus/Clethrionomys divergence should be examined for their molecular di-vergence to confirm our 6.5 to 8 Mybp dating. If that dating is confirmed, the interpretation of the fossil record leading to the paleontological estimate (3.5 Mybp) should be reconsidered.
remote countries: Marina Baskevitch, Gary Bronner, Giancarlo Con-trafatto, D. Bellars, Marc Duplantier, Piotr Gambarian, Jean-Claude Gautun, Laurent Granjon, 1. Hansmann, Rolf Anker Ims, Petros Lymberakis, Daniel Rakotondravony, Marco Salvioni, Majad Zadé, and Vitaly Volobouev. Thanks are also expressed to Emmanuel Douzery, Dorothée Huchon, Pascale Chevret, Jean-Jacques Jaeger, Jacques Michaux, and Jean-Louis Hartenberger for their helpful discussions about analyses of saturation, relative-rate tests, and the phylogeny ofMuridae. A special thanks to Marie-Claire Beckers and Corinne Lautier for their advise in automatic sequencing and to Professor F. Gricorescu (Institut Universitaire de Recherche Clin-ique, Montpellier) for the use of bis automatic sequencer. This is contribution ISEM 2000-098 of Institut des Sciences de l'Evolution de Montpellier (UMR 5554 CNRS-Université Montpellier 11).
CONCLUSIONS
REFEREN CES
This molecular study was performed on a nuclear gene sequenced for representatives of 13 of 17 Muridae subfamilies and 4 of 7 Dipodidae subfamilies. This taxonomie sampling led us to confirm the Myodonta infraorder including Muridae and Dipodidae. Within the largest mammalian family, Muridae, the use of the LCAT gene evidenced the following results: (1) that murids do not have a faster-evolving rate of change with regard to other rodents such as glirids, sciurids, or caviomorphs; (2) the monophyly of several subfamilies including the Spalacinae, Nesomyinae, Cricetinae, Ar-vicolinae, Gerbillinae, and Sigmodontinae; this result is nevertheless preliminary, as most of these taxa were represented by too few genera in this study; (3) that Myospalacinae (fossorial zokors) should be invalidated and considered a tribe of Cricetinae; in the same way, we propose to abandon the subfamilial rank for Oto-myinae and to include them as a tribe within Murinae; (4) the confirmation of the Acomyinae subfamily, which comprises genera previously classified in Murinae (Acomys, Lophuromys, and Uranomys) or in Dendro-murinae (Deomys); as a consequence, the traditional Murinae and Dendromurinae (as of Carleton and Musser, 1984; Musser and Carleton, 1993) are paraphyletic and/or polyphyletic; (5) the following sis-ter group relationships: (a) Spalacinae and Rhizomyi-nae, which were early separated from aIl other Muri-dae; (b) Mrican Mystromyinae and Malagasy Nesomyinae; this relationship should be further tested by including other African archaic murids such as Petromyscus and Cricetomyinae; and (c) Murinae, Ger-billinae, and Acomyinae; and (6) that, when calibrated by two paleontological data sets within muroids, the datings of different separation events estimated on the basis of molecular data confirm those documented by the fossil record.
FinaIly, our results strongly suggest that there bas been a bushlike radiation, = 18 Mybp, leading to the majority of the Muridae subfamilies. This interpreta-tion should now be tested by the use of another nuclear gene, encompassing a similar biodiversity for an ade-quate representation of this speciose family.
ACKNOWLEDGMENTS
This research was funded by a grant from the European Commu-nit y Project ERB-FMRX-CT98-0221. We thank aIl people who pro-vided tissue samples of rodent taxa that they collected. often in
Adachi, J., and Hasegawa, M. (1996). MOLPHY: Programs for mo-lecular phylogenetics Version 2.3 edit. Institute of Statistical Mathematics, Tokyo.
Aguilar, J. P., Clauzon, G., de Goer de Herve, A., Maluski, H., Michaux, J., and Welcomme, J. L. (1996). The MN3 fossil mammal-bearing locality of Beaulieu (France): Biochronology, radiometric dating, and lower age limit of the Early Neogene renewal of the mammalian fauna in Europe. Newsl. Stratigr. 34: 171-191. Aguilar, J. P., Escarguel, G., and Michaux, J. (1999). A succession of
Miocene rodent assemblages from fissure fillings in southern France: Palaeoenvironmental interpretation and comparison with Spain. Palaeogeogr.- Palaeoclimat. Palaeoecol. 145: 215-230. Ameur, R. (1984). Découverte de nouveaux rongeurs dans la
forma-tion miocène de Bou Hanifia (Algérie Occidentale). Géobios 17: 165-175.
Baskin, J. A. (1986). The late Miocene radiation of Neotropical sig-modontine rodents in North America. Contr. Geol. Univ. Wyoming Special Paper 3: 287-303.
Bernor, R. L., Brunet, M., Ginsburg, L., Mein, P., Pickford, M., Rtigl, F., Sen, S., Steininger, F., and Thomas, H. (1987). A consideration of Borne major topics concerning Old World Miocene mammalian chronology, migrations and paleogeography. Geobios 20: 431-439. Bremer, K. (1988). The limits ofamino Reid sequence data in
angio-sperm phylogenetic reconstruction. Evolution 42: 795-803. Brownell, E. (1983). DNA/DNA hybridization studies of muroid
ro-dents: Symmetry and rates of molecular evolution. Evolution 37: 1034-1051.
Carleton, M. D. (1980). Phylogenetic relationships in neotomine-peromyscine rodents (Muroidea) and a reappraisal of the dichot-omy within New World Cricetinae. Misc. Publ. Univ. Michigan 157: 1-146.
Carleton, M. D., and Musser, G. G. (1984). Muroid rodents. ln "Or-ders and Families of Recent Mammals of the World" (S. An"Or-derson and J. K Jones, Eds.), pp. 289-379. Wiley, New York.
Catzeflis, F. M., Sheldon, F. H., Ahlquist, J. E., and Sibley, C. G. (1987). DNA-DNA hybridization evidence of the rapid rate of muroid rodent DNA evolution. Mol. Biol. Evol. 4: 242-253. Catzeflis, F. (1991). Animal tissue collections for molecular genetics
and systematics. Trends Ecol. Evol. 6: 168.
Catzeflis, F. M., Aguilar, J.-P., and Jaeger, J.-J. (1992). Muroid rodents: Phylogeny and evolution. Trends Ecol. Evol. 7: 122-126. Catzeflis, F. M., Dickerman, A. W., Michaux, J., and Kirsch, J. A. W.
(1993). DNA hybridization and rodent phylogeny. ln "Mammal Phylogeny" (F. S. Szalay, M. J. Novacek, and M. C., McKenna, Eds.), pp. 159-172. Springer-Verlag, New York.
Chaline, J., and Graf, J.-D. (1988). Phylogeny of the Arvicolidae (Rodentia): Biochemical and paleontological evidence. J. Mamm. 69: 22-33.
Chaline, J., Mein, P., and Petter, F. (1977). Les grandes lignes d'une classification évolutive des Muroidea. Mammalia 41: 245-252. Chevret, P., Denys, C., Jaeger, J.-J., Michaux, J., and Catzeflis, F. M.
(1993a). Molecular evidence that the spiny mouse (Acomys) is more closely related to gerbils (Gerbillinae) than to true mite (Murinae). Froc. Natl. Acad. Sci. USA 90: 3433-3436.
Chevret, P., Denys, C., Jaeger, J.-J., Michaux, J., and Catzeflis, F. (1993b). Molecular and fossil aspects of the tempo and mode of evolution in Otomys (Otomyinae: Muridae: Mammalia). Biochem. Syst. Ecol. 21: 123-131.
Chevret, P., Granjon, L., Duplantier, J.-M., Denys, C., and Catzeflis, F. M. (1994). Molecular phylogeny of the Praomys complex (Ro-dentia, Murinae): A study based on DNA/DNA hybridization ex-periments. Zool. J. Linn. Soc. 112: 425-442.
de Bruyn, H., and Hussain, S. T. (1985). The succession of rodent faunas from the Lower Mancher Formation, southern Pakistan, and its relevance for the biostratigraphy of the Mediterranean Miocène. Paléobiol. Continentale (Montpellier) 14: 191-204. de Graaff, G. (1981). "The Rodents of Southern Africa,"
Butter-worths, Durban.
Denys, C., and Michaux, J. (1992). La troisième molaire supérieure chez les Muridae d'Afrique tropicale et le cas des genres Acomys, Uranomys et Lophuromys. Bonn. Zool. Beitr. 43: 367-382. Denys, C., Michaux, J., Catzeflis, F., Ducrocq, S., and Chevret, P.
(1995). Morphological and molecular data against the monophyly ofDendromurinae (Muridae: Rodentia). Bonn. Zool. Beitr. 45: 173-190.
Dickerman, A. W. (1992). "Molecular Systematics of Some New World Muroid Rodents," PhD thesis, University of Wisconsin at Madison.
Dubois, J.-Y., Rakotondravony, D., Hanni, C., Sourrouille, P., and Catzeflis, F. M. (1996). Molecular evolutionary relationships of three genera of Nesomyinae, endemic rodent taxa from Madagas-car. J. Mamm. Evol. 3: 239-260.
Dubois, J.-Y., Catzeflis, F. M., and Beintema, J. (1999). The phylo-genetic position of "Acomyinae" (Rodentia, Mammalia) as sister-group of a Murinae + Gerbillinae clade: evidence from the nuclear ribonuclease gene. Mol. Phylogenet. Evol. 13: 181-192.
Ellerman, J. R. (1940). "The Families and Genera of Living Rodents," Vol. l, Br. Mus. (Nat. Hist.), London.
Ellerman, J. R. (1941). "The Families and Genera of Living Rodents," Vol. 2, Br. Mus. (Nat. Hist.), London.
Flynn, L. J. (1990). The natural history of rhizomyid rodents. ln "Evolution of Subterranean Mammals at the Organismal and Mo-lecular Levels" (E. Nevo, and O. A. Reig, Eds.), pp. 155-183. A. R. Liss, New York.
Flynn, L. J., Jacobs, L. L., and Lindsay, E. H. (1985). Problems in muroid phylogeny: Relationships to other rodents and origin of major groups. ln "Evolutionary Relationships among Rodents" (W. P. Luckett, and J.-L. Hartenberger, Eds.), pp. 589-616. Ple-num, New York.
Furano, A. V., Hayward, B. E., Chevret, P., Catzeflis, F., and Usdin, K. (1994). Amplification of the ancient murine Lx family of long interspersed repeated DNA occurred during the murine radiation. J. Mol. Evol. 38: 18-27.
Grasse, P. P. (1955). Traité de Zoologie (Anatomie, Systématique, Biologie), Tome XVII, Masson, Paris.
Hiinni, C., Laudet, V., Barriel, V., and Catzeflis, F. M. (1995). Evo-lutionary relationships of Acomys and other murids (Rodentia, Mammalia) based on complete 12S rRNA mitochondrial gene se-quences. Israel J. Zool. 41: 131-146.
Hartenberger, J.-L. (1985). The order Rodentia: Major questions on their evolutionary origin, relationships and suprafamilial system-atics. ln "Evolutionarv Relationships among Rodents" (W. P.
Luckett and J.-L. Hartenberger, Eds.), pp. 1-33. Plenum, New York.
Hassanin, A., Pasquet, E., and Vigne, J.-D. (1998a). Molecular sys-tematics of the subfamily Caprinae (Artyodactyla, Bovidae) as determined from cytochrome b sequences. J. Mamm. Evol. 5: 217-236.
Hassanin, A., Lecointre, G., and Tillier, S. (1998b). The "volutionary signal" of homoplasy in protein carling gene sequences and its consequences for a priori weighting in phylogeny. C. R. Acad. Sei. Paris 321: 611-620.
Honacki, J. H., and Kinman, K E. (1982). "Mammal Species of the World," Allen Press, New York.
Hooper, E. T., and Musser, M. D. (1964). The glans penis in Neotro-pical cricetines (Family Muridae) with comments on classification ofmuroid rodents. Misc. Publ. Univ. Michigan 123: 1-57. Huchon, D., Catzefiis, F. M., and Douzery, E. J. P. (1999). Molecular
evolution of the nuclear von Willebrand Factor gene in mammals and the phylogeny ofrodents. Mol. Biol. Evol. 16: 577-589. Hugueney, M., and Mein, P. (1993). A comment on the earliest
Spalacinae (Rodentia, Muroidea). J. Mamm. Evol. 1: 215-223. Jacobs, L. L., and Downs, W. R. (1994). The evolution of murine
rodents in Asia. ln "Rodent and Lagomorph Families of Asian Origin and Diversification" (Y. Tomida, C. Li, and T. Setoguchi, Eds.), Vol. 8, pp. 149-156, National Science Museum Monographs, Tokyo.
Jacobs, L. L., Flynn, L. J., and Downs, W. R. (1989). Neogene rodents of southern Asia. ln "Papers on Fossil Rodents in Honor of Albert Elmer Wood" (C. C. Black, and M. R. Dawson, Eds.), Science Series No. 33, pp. 157-177. Nat. Hist. Mus. Los Angeles County, Los Angeles.
Jacobs, L. L., Flynn, L. J., Downs, W. R., and Barry, J. C. (1990). Quo vadis, Antemus? The Siwalik muroid record. ln "European Neo-gene Mammal Chronology" (E. H. Linday, V. Fahlbusch, and P. Mein, Eds.), pp. 573-586. Plenum, New York.
Jaeger, J.-J., Tong, H., Buffetaut, E., and Ingavat, R. (1985). The first fossil rodents from the Miocene of northern Thailand and their bearing on the problem of the origin of the Muridae. Rev. Paléobiol. 4: 1-7.
Jaeger, J.-J., Tong, H., and Buffetaut, E. (1986). The age of Mus-Rattus divergence: Paleontological data compared with the molec-ular clock. C. R. Acad. Sei. Paris Ser. 2 302: 917-922.
Jansa, S. A., Goodman, S. M., and Tucker, P. K. (1999). Molecular phylogeny and biogeography of the native rodents of Madagascar (Muridae: Nesomyinae): A test of the single-origin hypothesis. Cladistics 15: 253-270.
Kishino, H., and Hasegawa, M. (1989). Examination of the maximum likelihood estimate of the evolutionary tree topologies from DNA sequence data, and the branching order in Hominoidea. J. Mol. Evol. 29: 170-179.
Klingener, D. (1964). The comparative myology of four dipodoid rodents (genera Zapus, Napeozapus, Sicista and Jaculus). Misc. Publ. Mus. Zool. Univ. Michigan 124: 1-100.
Lavocat, R. (1973). Les rongeurs du Miocène d'Afrique Orientale. Mém. Trav. Ecole Pratique Hautes Etudes 1: 1-284.
Lavocat, R. (1978). Rodentia and Lagomorpha. ln "Evolution of Af-rican Mammals" (V. J. Maglio, and H. B. S. Cooke, Eds.), pp. 69-89. Harvard Univ. Press, Cambridge, MA.
Lawrence, M. A. (1991). A fossil Myospalax cranium (Rodentia: Muri-dae) from Shanxi, China, with observations on Zokor relation-ships. Bull. Am. Mus. Nat. Hist. 206: 261-286.
Li, W. K., Tanimura, M., et al. (1987). An evaluation of the molecular clock hypothesis using mammalian DNA sequences. J. Mol. Evol. 25: 330-342.