Proceedings of the ASME 2013 32nd International Conference on Ocean, Offshore and Arctic Engineering OMAE 2013 June 9-14, 2013, Nantes, France
OMAE2013-11568
DRAFT: ASSESSMENT OF FATIGUE RELIABILITY FOR JACKET-TYPE OFFSHORE
PLATFORMS CONSIDERING DYNAMIC BEHAVOIR
Mohammad Reza Khedmati*
Faculty of Marine Technology, Amirkabir University of Technology (Tehran Polytechnic)
Tehran, Iran
Philippe Rigo
University of Liège, ANAST, Chemin des Chevreuils 1 (B52/3), 4000 Liège, Belgium
Amrane Amirouche
University of Liège, ANAST, Chemin des Chevreuils 1 (B52/3), 4000 Liège, Belgium
Masoud Nazari
Faculty of Marine Technology, Amirkabir University of Technology (Tehran Polytechnic)
Tehran, Iran
*
Associate Professor and author of correspondence Abstract
In order to traditionally investigate the strength of marine structures, the structure is subjected to a maximum static load. However, the marine structures are usually suffering environmental forces varying with time. Wave forces are the most important time dependent loading that causes fatigue in structural elements and joints. In this paper different methods base on S-N curve and linear elastic failure mechanics are presented. The governing equations and theories that are used in each method are expressed and the application of each method will be discussed.
The two main methods of deterministic analyses are: stress-based approach (S-N curve approach) and linear elastic fracture mechanics (LEFM) approaches. These approaches are applicable to different analyzing strategies, ie the first approach is used for cases in which general form of fatigue is dominant, but the latter involves the calculations of reliability as functions of crack geometry and its boundary conditions.
The SPD12C jacket platform is also modeled as a case study and the results of fatigue reliability analysis are presented. In this paper a comprehensive method is presented to accurately predict the reliability of offshore platforms. This method is based on S-N curve and the results are compared with the fatigue life of joints.
Due to nonlinear interaction of soil and piles and the other affecting parameters such as flexibility of joints, non Gaussian procedure of loading, and nonlinearity of reaction force, the
precise analyzing of stress levels will be impossible and a complex numerical analysis could only give limited information about the statistical properties of stress. In order to perform the fatigue analysis and predicting the cycles of stress SACS was used which is known as a powerful software in designing and analyzing offshore structures.
In this paper the whole structure was modeled subjected to different forces such as wave and sea currents. The effects of parameters such as marine growth and interaction of soil and piles are also included. The latter is shown to have a significant effect on determination of fatigue life of the platform.
Introduction
Fatigue is a kind of deterioration that can occur in any metallic structure and mechanical part. The occurrence of fatigue in marine structures is quite different from ordinary mechanical machines. The first difference is the number of cyclic loading which is much more in marine environment. The other major difference is that the wave forces have no specific pattern and due to irregular nature of sea waves, the corresponding loading is stochastic and nonlinear [1].
The disaster of Kielland semi-submersible platform is an example of fatigue induced failures. The main cause of failure was the propagation of fatigue cracks in the platform legs.
There are two main approaches commonly used for fatigue analysis. The first approach was developed by Miner and named
as Miner’s rule of S-N. This rule relates stress ranges (S) to the number of cyclic loading (N) [2].
The other was based on linear fracture mechanics (LEFM) and consists the rate of crack growth as a function of parameters such as crack geometry and loading condition [3].
Tang and Yao studied the structural reliability using S-N curve and linear elastic failure mechanics. Their proposed method was comprised of Miner’s rule and the number of stress cycles causing fatigue. The number of cyclic loading was considered as stochastic variable. [4].
Yao utilized the Miner’s rule for designing structures based on a certain level of fatigue reliability [5]. This approach was then used by Wirsching to present a reliability analysis for welded joints of offshore structures [6]. In 1984 Wirsching applied an approach based on Miner’s rule in order to suggest a rule for reliability of TLPs [7].
The reliability of platform joints was evaluated by Ortiz and Kiremidjian. They used LEFM method and first order reliability method to express a fatigue reliability approach [8]. The Monte Carlo simulations associated with LEFM model were used by Wirsching to estimate the failure probability [9]. Jiao and Moan published a method of fatigue reliability based on inspection data of structural members [10]. Ximenses and Mansour studied the reliability of TLP tendons considering inspection procedures [11].
Faber et al studied the fatigue reliability of offshore structures by means of linear elastic fracture mechanism. The limit state function was based on stress intensity factor. They also used a jacket in North Sea as case study [12].
Jiao proposed a scheduling inspection of TLP tethers based on a procedure of reliability assessment [13]. The same procedure was used by Hovde and Moan to predict the fatigue reliability of TLP. Their method accounts for inspections and repairs of the structure [14].
Zhao et al applied Miner’s rule and LEFM based approach for computation of structural reliability of bridges [15]. An optimal inspection scheduling procedure for offshore structures was applied by Madsen et al. They used LEFM approach for reliability analysis of structural elements [16]. Fujita et al used a model with optimization process to minimize the failure costs, inspection and repair [17].
The event tree techniques were first adopted by Moan et al in order to study the effects of inspection and repair on fatigue reliability [18]. There are also studies that focused on in-service inspection and their effect on reliability analysis of offshore structures [19, 20].
Structural Reliability Analysis
In order to perform an analysis of structural reliability, numerical techniques can be used. The limit state function must contain the mathematical expression of failure and safe states. Therefore it is possible to estimate the state of the structure.
Several numerical procedures have been used for structural reliability analyses such as: First Order Reliability Method (FORM) and Second Order Reliability Method (SORM).
The FORM is known as the most applicable method to calculate the probability of failure. This method gives the sensitivity of failure probability to initial parameters that are essential for designing and maintaining structures. The SORM is usually used for estimating the limit state surface at the design point by second order surface.
Deterministic Fatigue Analysis
Deterministic analyses are often used for estimating the fatigue lifetime of structures subjected to cyclic loadings. The two main methods of deterministic analyses are: stress-based approach (S-N curve approach) and linear elastic fracture mechanics (LEFM) approaches [8]. The actual state of fracture and crack dimension is not included in the stress-based approaches. On the other hand, the LEFM approach contains the effects of stress field, crack size and its rate of growth. The S-N curve Approach (Stress-Based Approach)
The stress-based approach is usually used for fatigue analysis of structures where stresses and strains don’t exceed the yield strength of material. The structural components should also be free of any crack at the initiation of analysis. The relationship between stress amplitudes (SR) and number of cycles to failure can be expressed as:
m R
f
A
S
N
=
⋅
− (1)Where A and m are material related constants. In order to construct an S-N curve, a large number of fatigue tests must be performed. In these cases where an indicated probability of failure exists, it is referred to as a deterministic approach because there is no reliability calculations based on the actual condition.
Miner (1945) proposed a rule to explain the effects of fatigue on structural components. The Miner’s rule was based on linearly accumulated damage for structures subjected to variable-amplitude loading. Miner’s damage accumulation index, D, is defined as follows:
∑
= = k i fi i N n D 1 , (2)Where ni is the actual number of cycles associated with a stress level of SR,i, and Nf,I represents the number of cycles associated with a constant-amplitude stress range level, SR,I, leading failure. It is obvious that if D<1 then it can be concluded that the structure is in the safe state. Also we can say that the fails occurs whenever D≥1. This expression is commonly referred to as Miner’s rule of accumulation damage. The Miner’s rule can be expressed in the following form:
[
.]
1 , , = = ⋅ = ⋅ ⋅ =∑
∑
∑
− m RE m i R i m i R i i f i S A N S A N S A N N n γ γ (3)[
m]
m i R i RE S S =∑
γ
⋅ , 1 (4)Where SRE represents the equivalent stress range. γi is the ratio of ni to the total number of accumulated stress cycles, N. In other words:
N ni
i = ⋅
γ
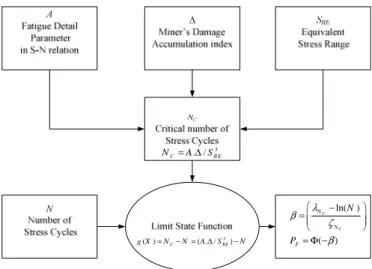
(5)After determination of SRE, it is possible to estimate the number of cycles to failure for any structural element experiencing cyclic loading. This can be done by using a conventional S-N curve. Figure 1 shows the flowchart of fatigue reliability analysis using S-N curve.
3 . / C RE N = ∆A S 3 ( ) C ( . / RE) g X =N −N=A∆S −N ln( ) ( ) C C N N F N P λ β ζ β − = = Φ −
Figure 1. Flowchart of fatigue reliability analysis using S-N
curves.
Target Reliability
In order to establish a reliability-based design it is necessary to select a target reliability level. The target reliability index, βtarget, is defined as the minimum safety level approved and accepted for a specific application and represents the probability of failure of a structure. The use of βtarget as a starting point is tied to notions of probability. For example requiring βtarget to be such that the probability of failure will be a small value such as 0.0001.
The three main methods that can be used to select a target reliability value are as follows:
Agreeing upon a reasonable value (usually applicable for novel structures without prior history).
Selecting and calibrating reliability levels from existing design codes.
Considering economic concepts and choosing a reliability level that results in minimum total expected costs during the service life of the structure.
The recommended range of target reliability index is usually in the range from 2.0 to 4.0.
The target reliability index, βtarget, can be expressed in the form of:
(
F)
et t =Φ −P −11 arg β (6)Where Φ-1(1-PF) is the inverse of the cumulative distribution function of a standard Gaussian random variable and PF is the acceptable probability of failure. Another application of βtarget is to describe the results of reliability analyses. It is also possible to establish and use a maximum acceptable probability of failure instead without affecting the formulation of the reliability analyses. It should be noted that higher target reliability index used will result in safer design of a structural detail during service lifetime. On the other hand, it will be more expensive to design and to maintain the high level of safety due to additional inspections and repairs required. As mentioned, there is a balanced level between the reliability index and the costs involved.
The target reliability index values for North Sea jacket platforms are given in table 1.
Table 1. Target reliability index, βtarget, for North Sea jackets
Failure Consequence Target Reliability Index βtarget Failure Probability PF Very Serious 4.27 10-5 Serious 3.72 10-4 Not Serious 3.09 10-3 Local Effect 2.33 10-2 Negligible Effect 1.28 10-1
Fatigue analysis results
SACS finite element program has been used in order to simulate the fatigue behavior and stress levels over the structure. Figure 2 shows a perspective view of SPD 12C jacket platform modeled in this study.
The jacket platform was analyzed considering the effects of wave, sea current, marine growth, and the interaction of soil and piles. The structure was modeled including structural joining details such as anchors, anodes, etc. The procedure of analyzing was performed in static and dynamic modes.
In order to perform a frequency domain analysis it is necessary to linearize the nonlinear model of foundation. Thus the linearized super elements of foundation was used.
The main parameters of wave for center of damage was considered as:
Significant wave height: 2.252 m Zero crossing period: 4.856 sec Maximum wave height: 4.189 m Associated time period: 6.313 sec Dominate period: 6.847 sec
∑
∑
= = × = n i n i Di Hsi Di Hs 1 1 (7)∑
∑
= = × = n i n i Di Tzi Di Tz 1 1 (8)Where HSi and TZi represents the significant wave height and zero crossing period of sea state i. Di is the damage contribution and Pi is the probability of occurrence relating to the sea state i.
Figure 2. A perspective view of SPD 12C jacket platform
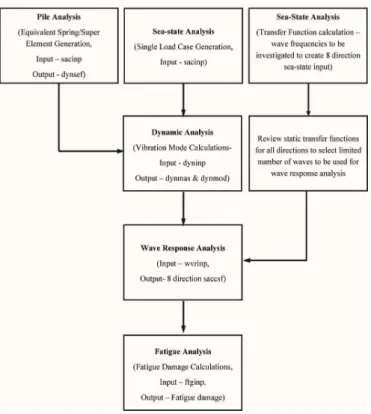
Figure 3 shows a fatigue analysis flow chart for offshore platforms.
After performing fatigue analysis the following outputs can be extracted:
- Fatigue calculations for each joints and in 8 directions (up, up-right, up-left, left, down-left, down-right, right) at connection region of bracings to the leg.
- The calculations for 8 different fatigue loading conditions
- The critical point for each joint with loading properties such as stress levels, cycles, fatigue life, the fatigue induced damge, the method of selecting SCF, and the value of SCF, etc.
The curve of stress-cycle for joint 1500 (shown in figure 6) is shown in figure 4. As it can be seen the relation of number of cycles with equivalent level of stress are depicted. For example with stress level of 2.775 KNSCM the critical number of cycles will be 108.
Figure 3. The flow chart of fatigue analysis for a platform [21]
Figure 4. stress-cycle curve for joint “1500”
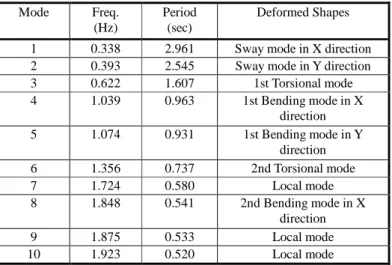
Table 2 presents nonlinear analysis of foundation and the first 10 natural periods and associated modes.
Table 3 shows the same results with fixed supports. In other words the interactions of soil and pile are not included and a linear analysis of foundation is performed.
As we can see, the interaction of soil and pile has significant effect on the first 3 modes. In the case of nonlinear analysis, the periods have higher values in comparison with the case that the effects of soil are neglected.
Therefore it is important to consider the dynamic effects and neglecting them may lead to unreliable results. The first natural mode of the platform is depicted in figure 5.
Table 2.Natural periods with flexible supports
Deformed Shapes Period (sec) Freq. (Hz) Mode
Sway mode in X direction 2.961
0.338 1
Sway mode in Y direction 2.545 0.393 2 1st Torsional mode 1.607 0.622 3 1st Bending mode in X direction 0.963 1.039 4 1st Bending mode in Y direction 0.931 1.074 5 2nd Torsional mode 0.737 1.356 6 Local mode 0.580 1.724 7 2nd Bending mode in X direction 0.541 1.848 8 Local mode 0.533 1.875 9 Local mode 0.520 1.923 10
Table 3. Natural periods with fixed supports
Deformed Shapes Period (sec) Freq. (Hz) Mode
Sway mode in X direction 1.668
0.6 1
Sway mode in Y direction 1.601 0.625 2 1st Torsional mode 1.168 0.857 3 1st Bending mode in X direction 0.654 1.528 4 1st Bending mode in Y direction 0.632 1.582 5 2nd Torsional mode 0.562 1.781 6 Local mode 0.471 2.122 7 2nd Bending mode in X direction 0.470 2.128 8 Local mode 0.450 2.224 9 Local mode 0.406 2.465 10
Fatigue Life and Reliability of Joint “1500”
In this section the fatigue life and reliability the joint “1500” at 8 different locations is presented. A schematic view of the tubular joint “1500” is presented in figure 6.
The fatigue life of the joint is depicted in figure 7. Table 4 shows detailed results of fatigue analysis for the joint.
Figure 5. the first natural mode of the platform
Fatigue reliability index of the joint “1500” at 8 different locations and 8 different fatigue loading condition are presented in the figures 8 and 9 respectively.
As we can see, the joint is subjected to more fatigue damages at the “down” location; and therefore this location is regarded as the critical point for this joint.
It can also be seen that the fatigue reliability, the fatigue life, and the fatigue reliability index for the joint “1500” have lower values for location of “down”.
The results also show that the fatigue reliability index and fatigue life show significant sensitivity towards the position. Therefore selecting the critical point plays an important role in designing and assessing a structure against fatigue loading.
Table 4. Fatigue life of joint “1500” at 8 locations
Fatigue Life (years) Damage Fatigue Reliability, β Ntarget Number of Stress Cycles SRE Brace Location 161.951 0.154 7.997 75×106 14408840 2.426 Top 153.003 0.163 7.828 75×106 15525706 2.418 Top Left 71.729 0.348 5.987 67×106 28083547 2.511 Left 17.963 1.391 2.636 56×106 84695229 2.666 Bottom Left 10.111 2.472 1.297 50×106 125424055 2.775 Bottom 17.758 1.407 2.633 56×106 84571336 2.668 Bottom Right 70.27 0.355 5.977 75×106 18000473 2.516 Right 149.505 0.167 7.802 75×106 15677132 2.419 Top Right 0 20 40 60 80 100 120 140 160 180
top top left left bottom left bottom left bottom right
right top right
8 brace location F a ti g u e l if e ( y e a r)
Figue 7. Fatigue life of joint “1500” at 8 locatins
0 1 2 3 4 5 6 7 8 9
top top left left bottom left bottom left bottom right
right top right
8 brace location F a ti g u e R e li a b il it y , β
Figure 8. fatigue reliability of joint “1500” at 8 locations
0 5 10 15 20 25 30 lc1 lc2 lc3 lc4 lc5 lc6 lc7 lc8
8 Fatidue Load Case
F a ti g u e R e li a b il it y , β
Figure 9. Fatigue reliability index for joint “1500” for 8 fatigue
loading conditions.
Figures 10 and 11 present the fatigue reliability and fatigue life of the joint “1500” using different methods for calculating stress concentration factor. As it can be seen the difference between the results seems to be considerable. Amongst these values, the methods Efthymiou, Kuang & Wordsworth, UEG (Underwater Engineers), and DNV led to similar results but the methods COJAC, Marshall, and Smedley & Fisher results in overdesign values. The minimum value of stress concentration factor for fatigue calculation is usually set 2.0.
Offshore platforms are expensive structures due to their construction and maintenance. Occurrence of a damage to such structures may result in irrecoverable economic failure and environmental disasters. Therefore using conservative methods for calculation of fatigue reliability such as Efthymiou would be a wise choice.
0 5 10 15 20 25 30 35 40 45 Efthymiou Kuang-Wordsworth Smedley-Fisher
COJAC UEG Marshal DNV
SCF methods F a ti g u e l if e ( y e a r)
Figure 10. fatigue life of the joint “1500” with different SCF
calculation methods. 0 0.5 1 1.5 2 2.5 3 3.5 4 4.5 5 Efth ymio u Kuan g-W ords worth Smed le y-Fish er CO JAC UEG Mar shal DNV SCF methods F a ti g u e R e li a b il it y , β
Figure 11. Fatigue reliability of joint “1500” obtained by different
SCF calculation methods
The analyses of fatigue reliability were performed in two different ways, i.e. the interaction effects of soil and piles may be neglected and the other way consists of nonlinear analysis. The linear analysis can be conducted by considering the fixed ends of piles at the base.
In this study the whole structure with all of its joints and structural details such as deck, anchoring system, anodes, and marine growth are modeled. The response of structure is simulated both in statically and dynamically.
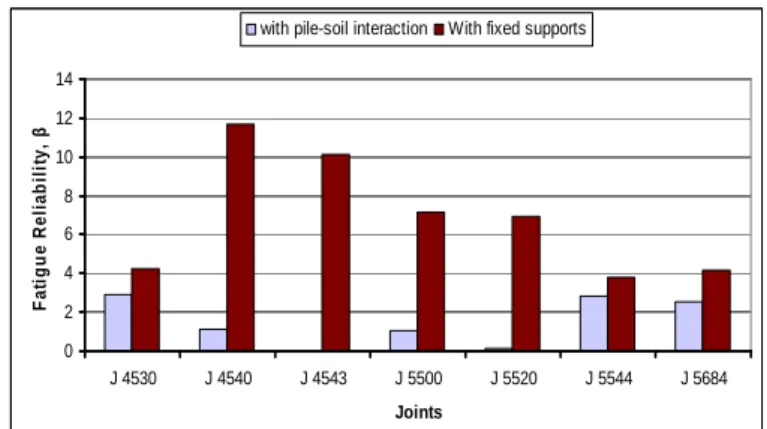
Figures 12 and 13 show the results of fatigue life and fatigue reliability of some joints with respect to consideration of pile and soil interactions.
As it can be seen, the fatigue life and fatigue reliability of the joints would be greater in linear analysis thus lead to overestimated and unrealistic values. Therefore in order to precisely model the dynamic behavior of such structures, it is important to consider the effects of pile and soil interactions.
0 10 20 30 40 50 60 70 80 90 100 J 4530 J 4540 J 4543 J 5500 J 5520 J 5544 J 5684 Joints F a ti g u e l if e ( y e a r )
With pile-soil interaction With fixed supports
Figure 12. The effects of pile and soil interactions on fatigue life of
some joints. 0 2 4 6 8 10 12 14 J 4530 J 4540 J 4543 J 5500 J 5520 J 5544 J 5684 Joints F a ti g u e R e li a b il it y , β
with pile-soil interaction With fixed supports
Figure 13. The effects of pile and soil interactions on fatigue reliability
of some joints.
CONCLUSIONS
A concise reliability analysis for offshore platforms under fatigue loading is presented. The stress-based approach or S-N curve method and its main stages are briefly discussed. The model with structural details and environmental conditions were included in dynamic analysis of the platform structure.
A wide range of uncertainty parameters such as hydrodynamic coefficients, marine sediments, stress concentration factors, stress intensity factors, and initial imperfections are involved in fatigue reliability analysis.
It has been shown that dynamic effects play an important role in structural response of offshore platforms, thus these effects must be included in designing and analyzing such structures.
The interaction of pile and soil is shown to have significant effects on dynamic behavior of the structure. These effects would be emphasized in the presence of wave forces as a dominant cyclic loading. In order to study this effect, the analyses of fatigue and reliability were conducted considering fixed supports of piles and then nonlinear simulation of soil reactions. It has been shown that the natural frequencies of
structures, fatigue life, and fatigue reliability of joints are directly affected by soil modeling.
Different methods of calculating stress concentration factor were used and it was found that their results may vary notably. It was recommended to use the method of Efthymiou to realistically compute SCF.
The results of fatigue analysis and reliability analysis for the platform joints were presented. The results consist of 8 different positions around the joint and different loading conditions.
It has been found that the results show good agreement with reliability analysis based on Aashto method.
8 REFERENCES
[1] Bai, Y., Marine Structural Design, 2003, first edition. [2] Miner, M. A., “Cumulative damage in fatigue”, Journal of
Applied Mechanics, Vol. 12, No. 3, pp. 159-164, 1945. [3] Paris, P. C., Erdogan, F., “A Critical Analysis of Crack
Propagation Laws”, Journal of Basic Engineering, ASME, Vol. 85, pp. 528-534, 1963.
[4] Tang, J. P., Yao, J. T. P., “Fatigue Damage Factor in Structural Design”, Journal of the Structural Division, Proceedings of the American Society of Civil Engineers, ASCE, Vol. 98, No. ST1, pp. 125-134, 1972.
[5] Yao, J. T. P., “Fatigue Reliability and Design”, Journal of the Structural Division, Proceedings of the American Society of Civil Engineers, ASCE, Vol. 100, No. ST9, pp. 1827-1836, 1974.
[6] Wirsching, P. H., “Fatigue Reliability in Welded Joints of Offshore Structures”, Proceedings of Offshore Technology Conference, Vol. 1, pp. 197-202, 1979.
[7] Wirsching, P. H., “Fatigue Reliability for Offshore Structures”, Journal of Structural Engineering, ASCE, Vol. 110, No. 10, pp. 2340-2356, 1984.
[8] Ortiz, K. and Kiremidjian, A., “A Fatigue Reliability Model for Offshore Structures”, Proceedings of the 4th ASCE Specialty Conference on Probabilistic Mechanics and Structural Reliability, Berkeley California, pp. 363-366, 1984.
[9] Wirsching, P. H., Ortiz, K., Chen, Y. N., “Fracture Mechanics Fatigue Model in a Reliability Format”, Proceedings of the 6th International Symposium on OMAE, Houston Texas, pp. 331-337, 1987.
[10] Jiao, G., Moan, T., “Methods of Reliability Model Updating Through Additional Events”, Structural Safety, Vol. 9, No. 2, pp. 139-153, 1990.
[11] Ximenes, M. C. C., Mansour, A. E., “Fatigue System Reliability of TLP Tendons Including Inspection Updating”, Proceedings of the 10th International Conference on Offshore Mechanics and Arctic Engineering, ASME, Vol. 2, Stavanger Norway, pp. 203-211, 1991.
[12] Faber, M. H., Sorensen, J. D., Rackwitz, R, Thoft-Christensen, P., Bryla, P., “Reliability Analysis of an Offshore Structure: A Case Study 1” Proceedings of the 11st
International Conference on Offshore Mechanics and Arctic Engineering, ASME, Vol. 2, Calgary Canada, pp. 449-455, 1992.
[13] Jiao, G., “Reliability Analysis of Crack Growth with Inspection Planning”, Proceedings of the 11st International Conference on Offshore Mechanics and Arctic Engineering, ASME, Vol. 2, Calgary Canada, pp. 227-235, 1992.
[14] Hovde, G. O., Moan, T., “Fatigue Reliability of TLP Tether System”, Journal of Offshore Mechanics and Arctic Engineering, ASME, Vol. 119, pp. 53-60, 1997.
[15] Zhao, Z., Haldar, A., Breen, F., “Fatigue-Reliability Evaluation of Steel Bridges” Journal of Structural Engineering, ASCE, Vol. 120, No. 5, pp. 1608-1623, 1994. [16] Madsen, H. O., Sorensen, J. D., Olesen, R., “Optimal
Inspection Planning for Fatigue Damage of Offshore Structures.” Proceedings of the 5th International Conference on Structural Safety and Reliability, pp. 2099-2106, 1989. [17] Fujita, M., Schall, G., Rackwitz, R., “Adaptive
Reliability-Based Inspection Strategies for Structures Subject to Fatigue”, Proceedings of the 5th International Conference on Structural Safety and Reliability, pp. 1619-1626, 1989. [18] Moan, T., Hovde, G. O., Blanker, A. M., “Reliability-Based
Fatigue Design Criteria for Offshore Structures Considering the Effect of Inspection and Repair”, Proceedings of Offshore Technology Conference, pp. 591-600, 1993. [19] Dharmavasan, S., Faber, M. H., Dijkstra, O. D., Cervetto,
D., Manfredi E., “Reliability Based Inspection Scheduling for Fixed Offshore Structures”, Proceedings of the 13th International Conference on Offshore Mechanics and Arctic Engineering, ASME, Vol. 2, Houston USA, pp. 227-235, 1994.
[20] Lotsberg, I., Sigurdsson, G., Wold, T. P., “Probabilistic Inspection Planning of the Asgard A FPSO Hull Structure with Respect to Fatigue”, Proceedings of the 18th International Conference on Offshore Mechanics and Arctic Engineering, ASME, Vol. 2, St. John’s Canada, pp. 259-266, 1999.
[21] Worley Parsons,” SPD12 Jacket Dynamic Spectral Fatigue Analysis Design Basis”, AP12-46-235-002/D4, 2009.